

Earlier today, the Australian dollar moved lower against its U.S. counterpart after official data showed that Chinese fixed-asset investment for July rose less-than-expected. Additionally, industrial production and retail sales numbers also disappointed market participants, which approached AUD/USD to the Wednesday’s low. What happened at the same time with our other currency pairs?
In our opinion the following forex trading positions are justified - summary:
- EUR/USD: none
- GBP/USD: short (a stop-loss at 1.3579; initial downside target at 1.2519)
- USD/JPY: none
- USD/CAD: short (stop-loss at 1.3274; initial downside target at 1. 2740)
- USD/CHF: short (stop-loss at 0.9895; initial downside target at 0.9651)
- AUD/USD: none
EUR/USD
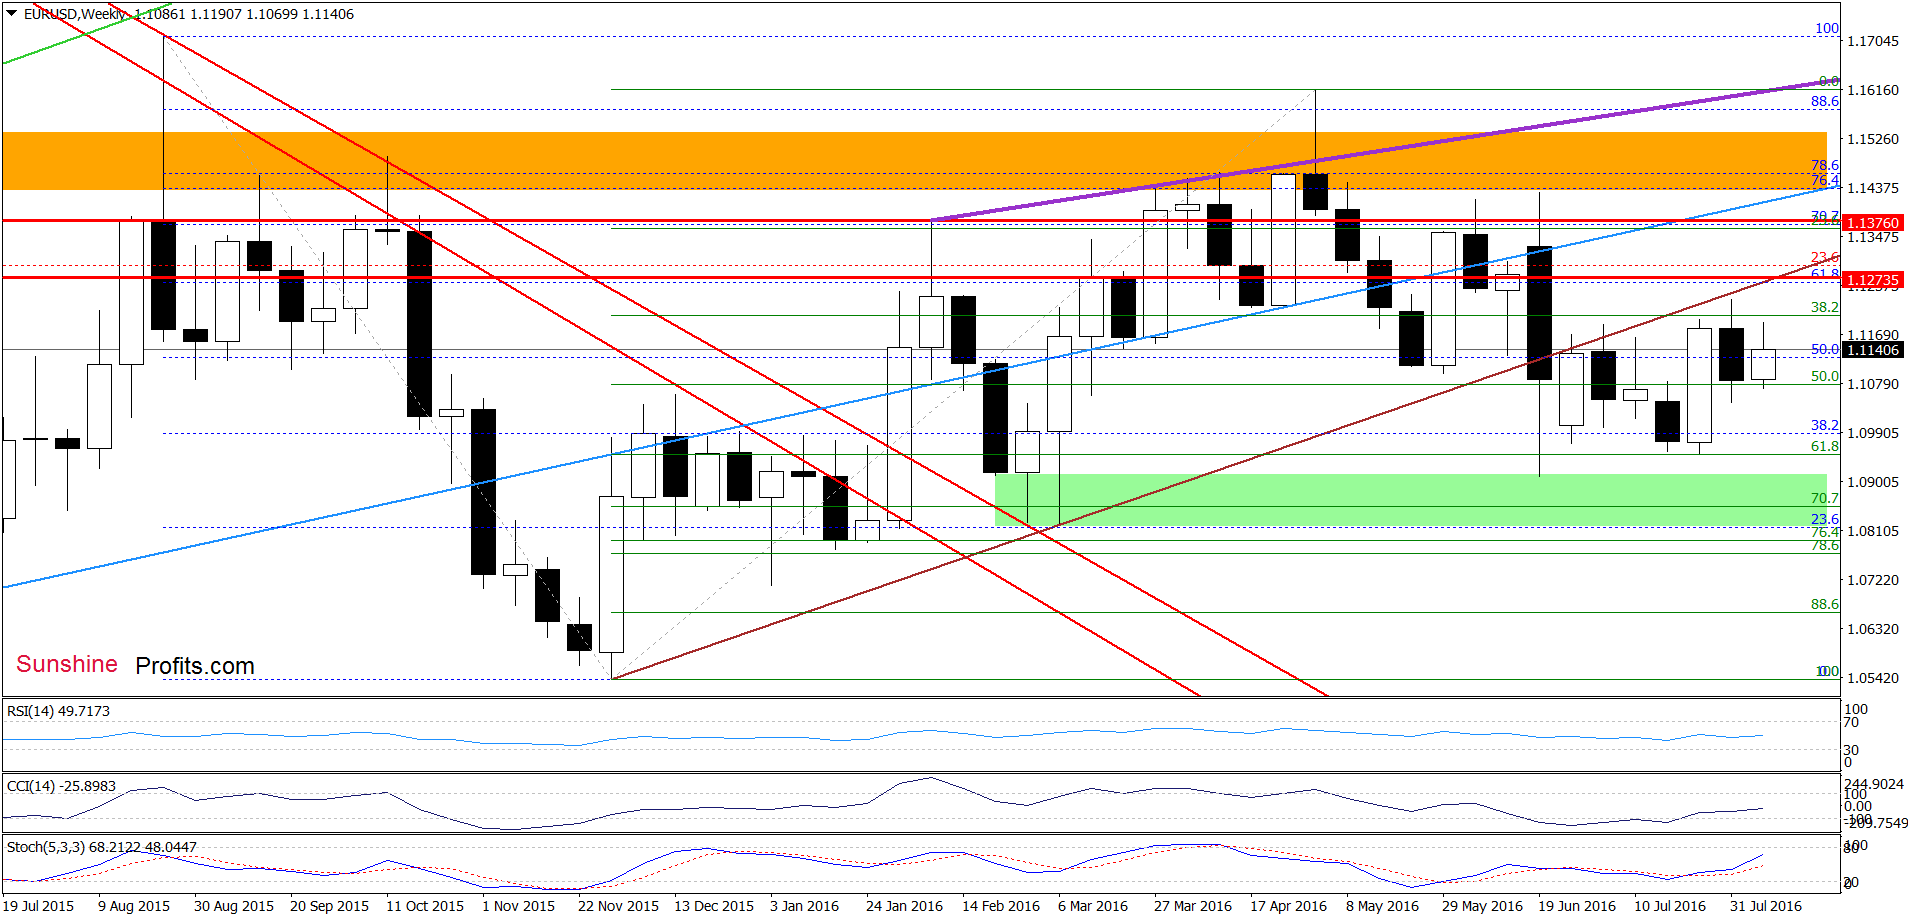
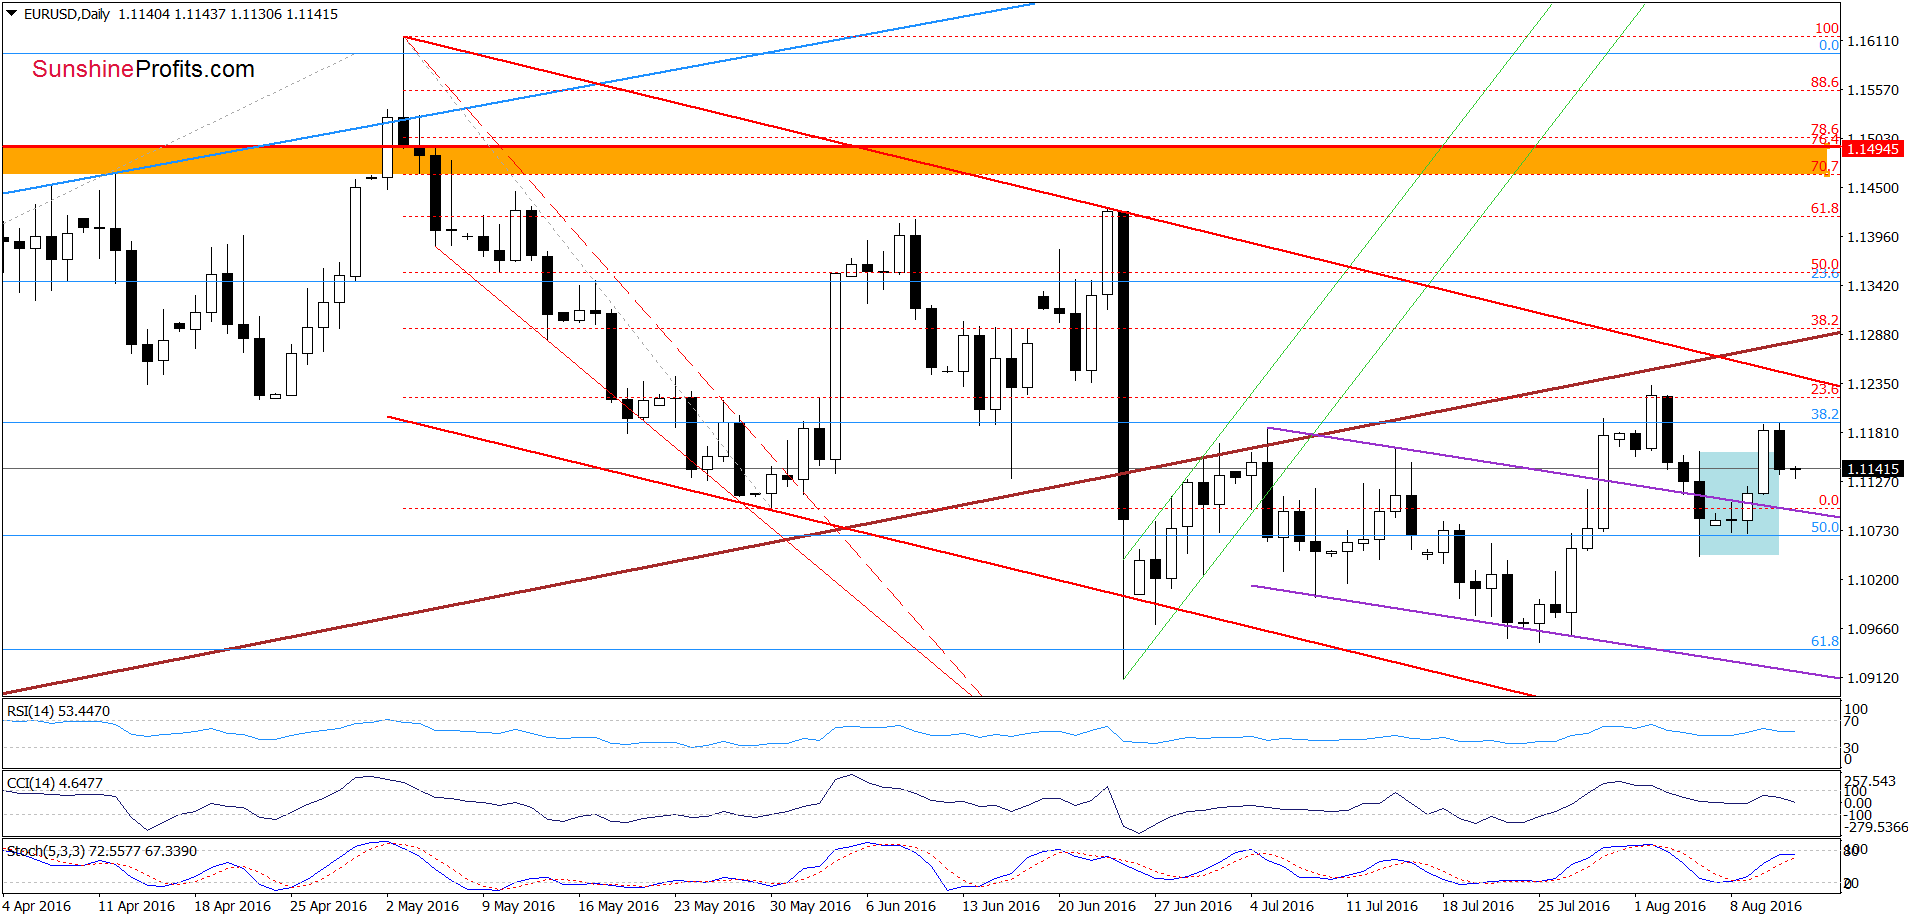
Yesterday, EUR/USD moved lower and closed the day under the upper border of the blue consolidation, invalidating earlier breakout. Although this is a negative signal that suggests further deterioration, it seems that as long as there won’t be sell signals generated by the indicators, another attempt to move higher can’t be ruled out. Therefore, if the pair rebounds, we may see a test of the upper border of the medium-term red declining trend channel or even the brown resistance line in the coming days.
Very short-term outlook: mixed with bullish bias
Short-term outlook: mixed
MT outlook: mixed
LT outlook: mixed
Trading position (short-term; our opinion): No positions are justified from the risk/reward perspective. We will keep you informed should anything change, or should we see a confirmation/invalidation of the above.
GBP/USD
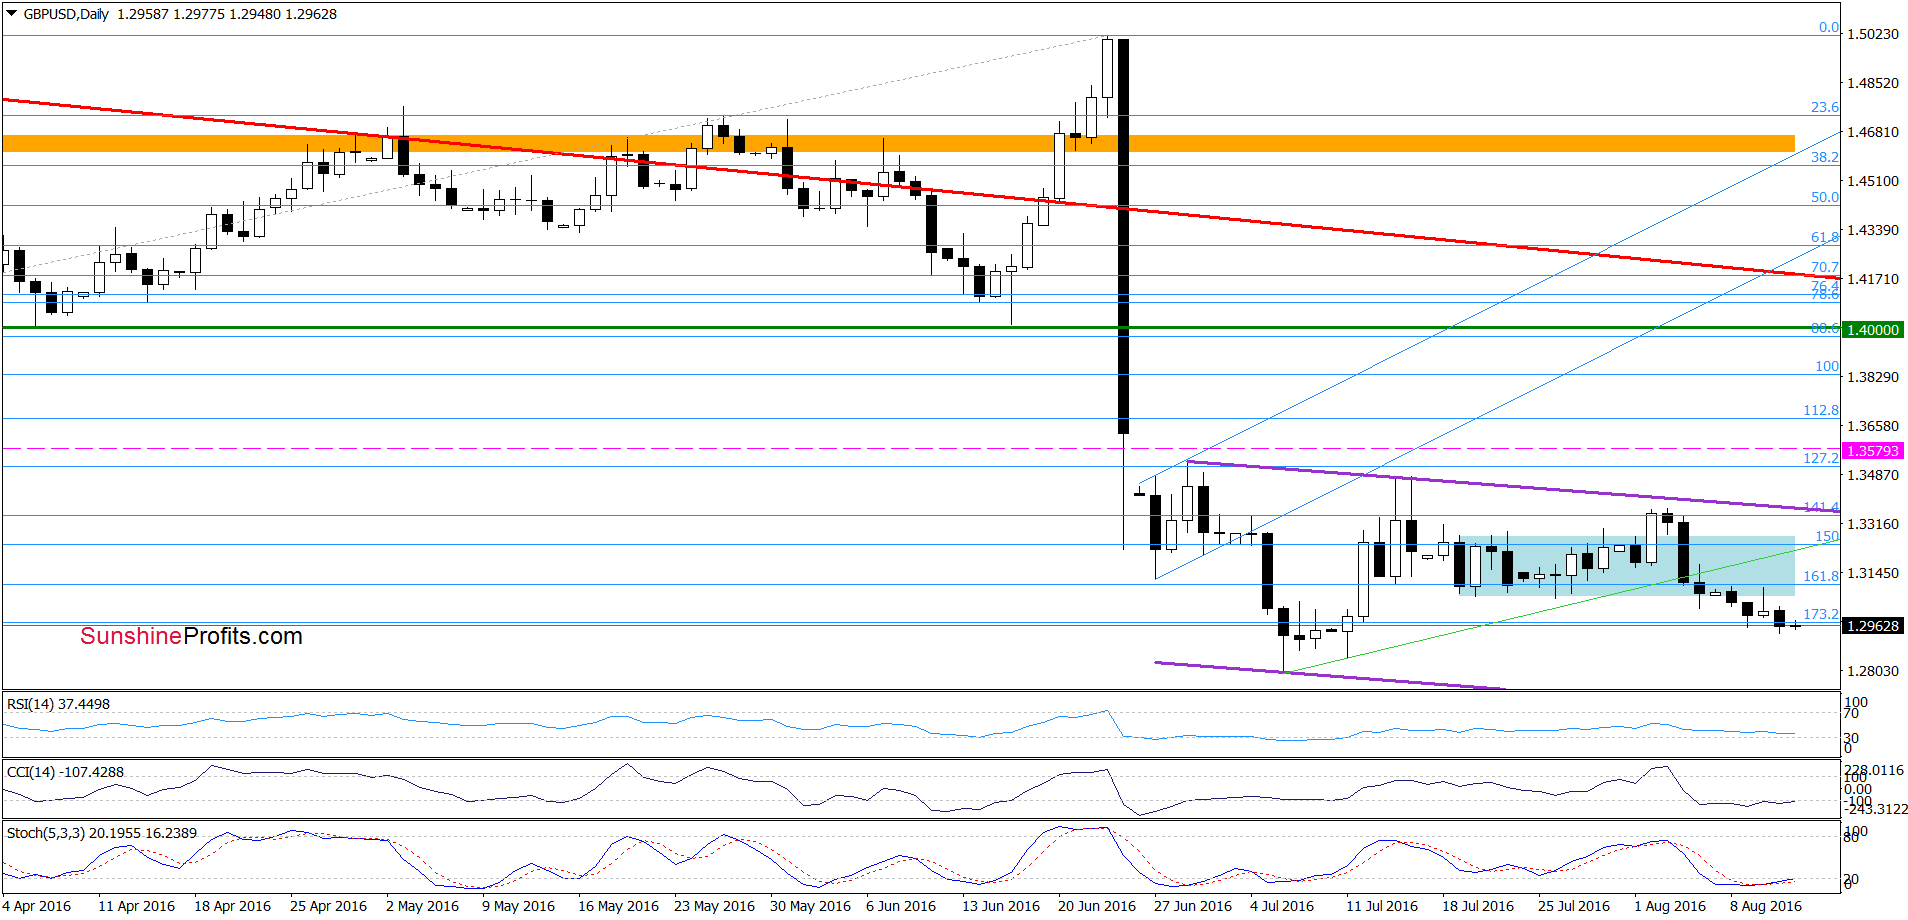
On the daily chart, we see that GBP/USD remains under the previously-broken lower border of the blue consolidation, which means that what we wrote yesterday is up-to-date:
(…) Wednesday’s move could be just a verification of the breakdown below the lower border of the blue consolidation. This scenario is also reinforced by today’s drop, which means that (…) negative image that emerges from the long- and medium-term perspective will trigger another move to the downside in near future. If this is the case, and GBP/USD declines from current levels, we’ll see (at least) a test of the Jul lows.
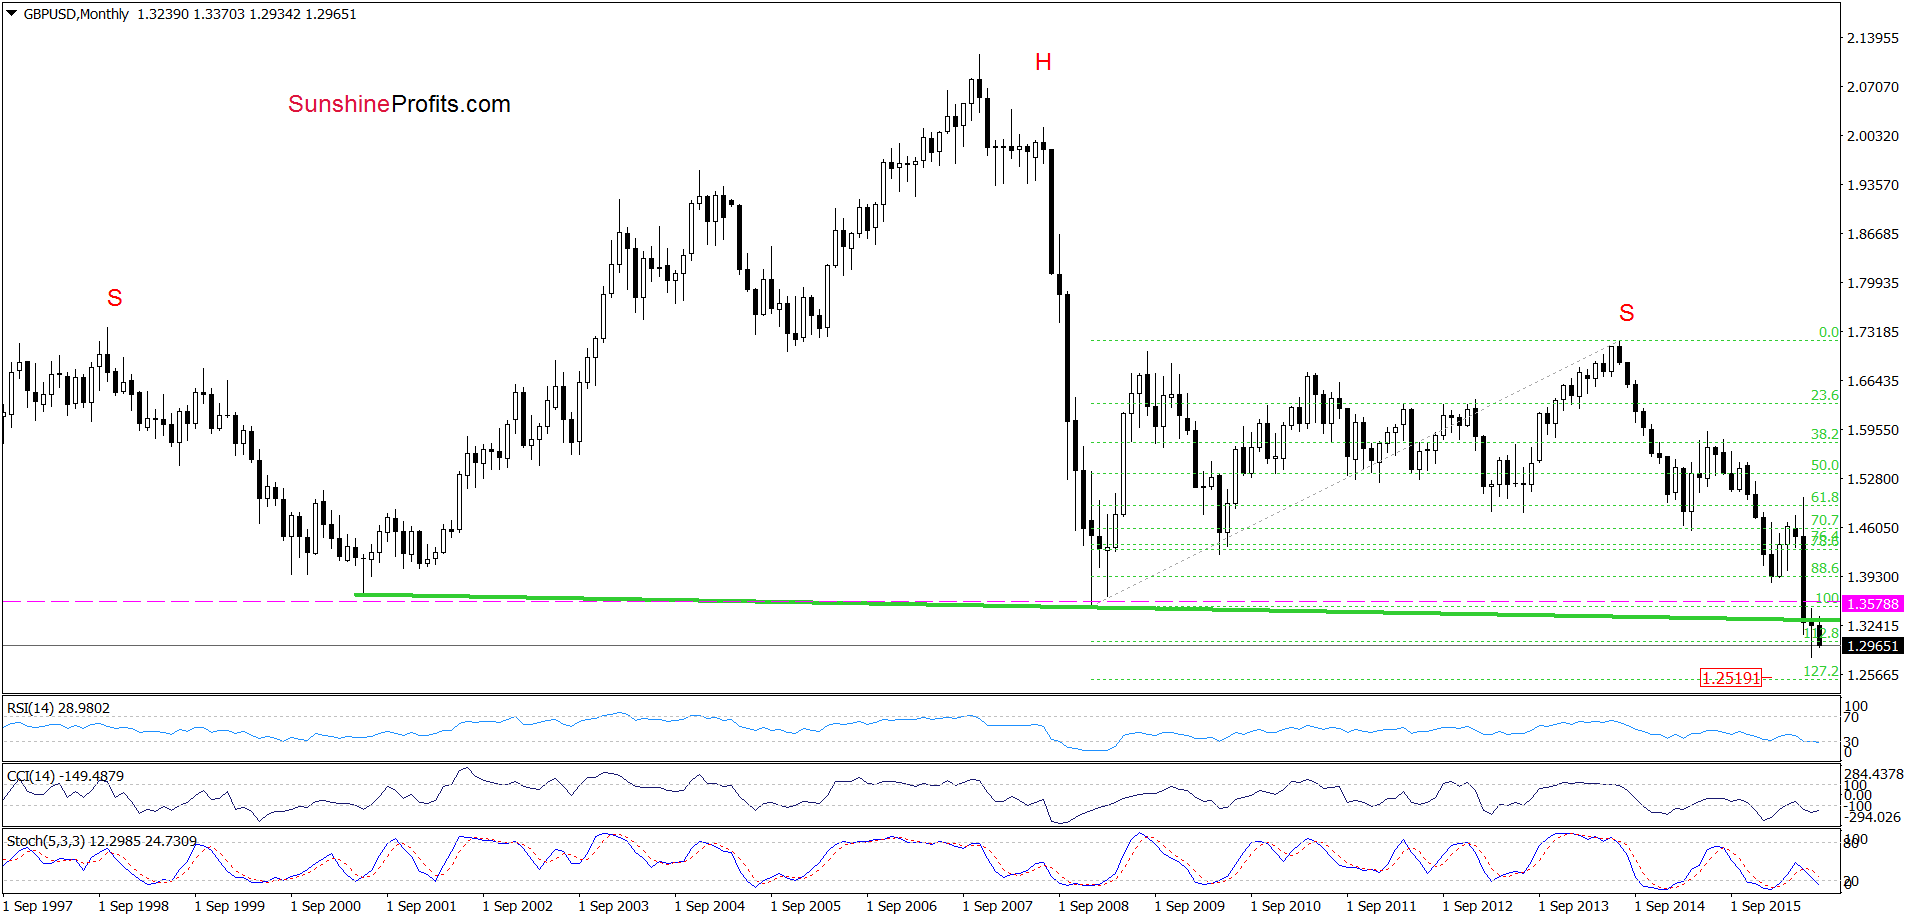
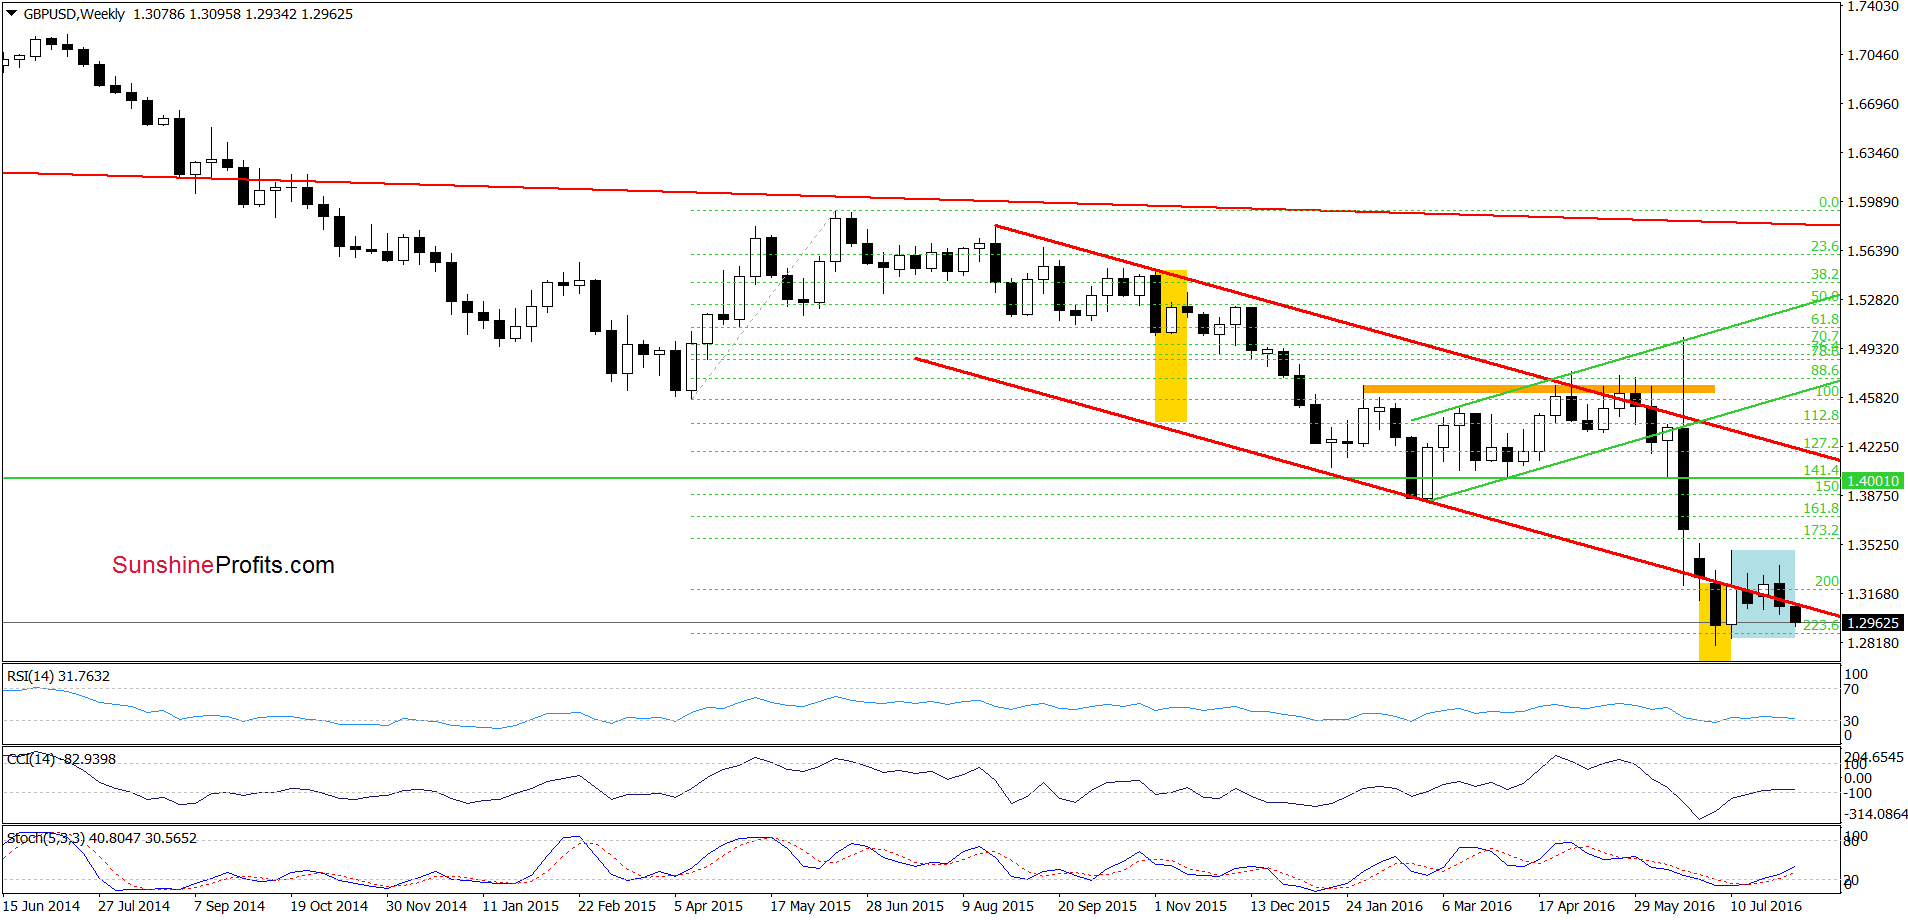
(…) GBP/USD extended losses (although it is still trading in the blue consolidation) under the lower border of the red declining trend channel and the neck line of the head and shoulders formation, which is a negative signal that suggests further deterioration.
Very short-term outlook: bearish
Short-term outlook: bearish
MT outlook: bearish
LT outlook: bearish
Trading position (short-term; our opinion): Short positions (with a stop-loss at 1.3579 and the initial downside target at 1.2519) are justified from the risk/reward perspective at the moment. We will keep you informed should anything change, or should we see a confirmation/invalidation of the above.
USD/JPY
Yesterday, we wrote:
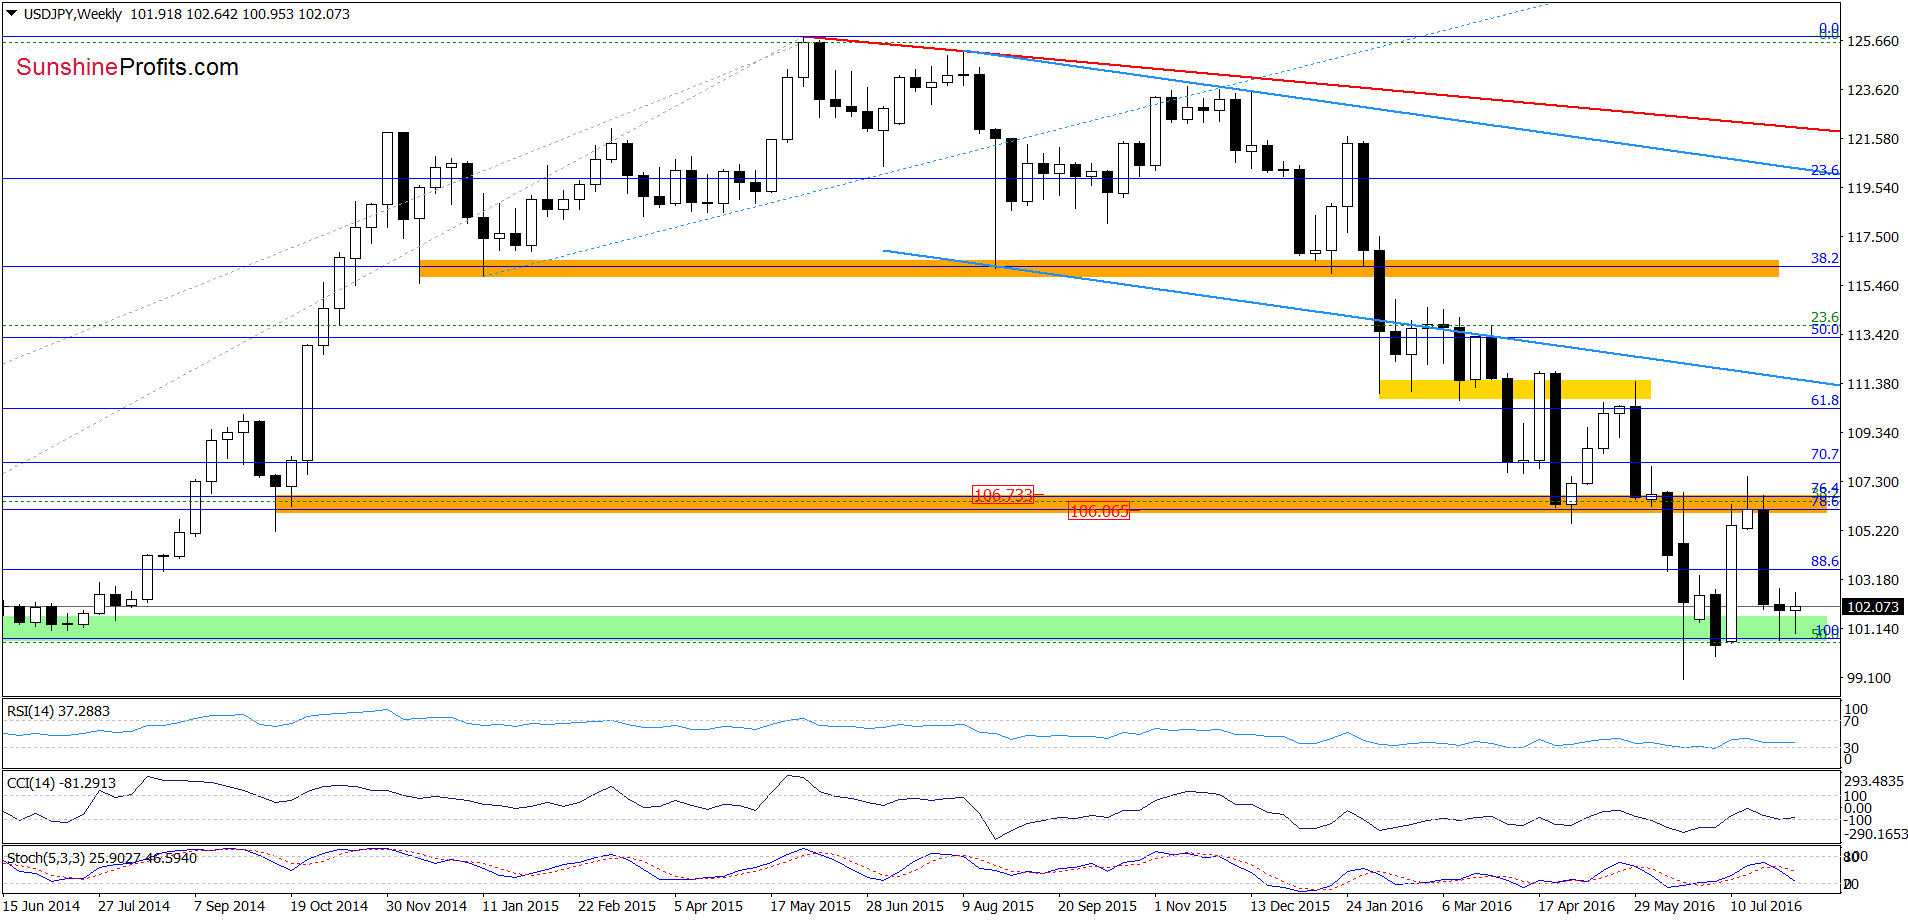
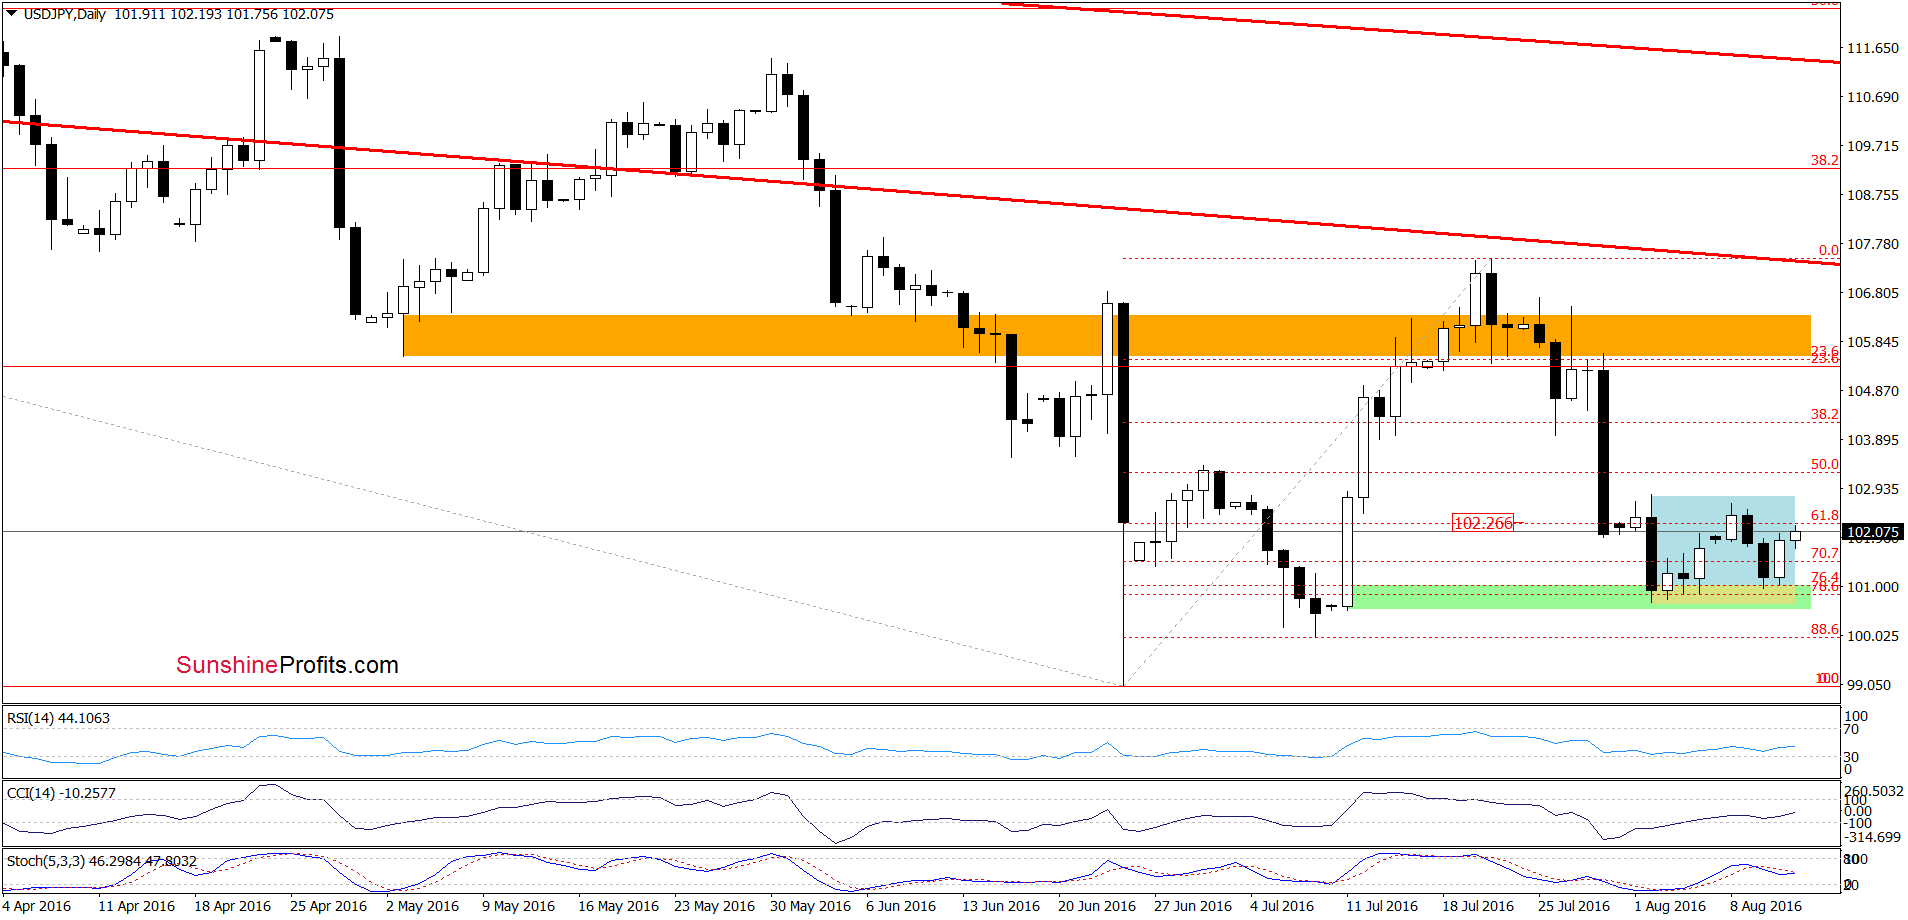
(…) the upper border of the blue consolidation in combination with sell signals generated by the indicators encouraged currency bears to act, which resulted in a decline in recent days. With this move, USD/JPY re-approached the last week’s lows and the green support zone, which could trigger another rebound in the coming day(s).
Looking at the daily chart, we see that currency bulls pushed USD/JPY higher, which suggests a re-test of the upper border of the blue consolidation in the coming day(s). Nevertheless, as long as there won’t be a breakout above the last week’s high or a breakdown under the green zone, another bigger move is not likely to be seen.
Very short-term outlook: mixed
Short-term outlook: mixed
MT outlook: mixed
LT outlook: mixed
Trading position (short-term; our opinion): No positions are justified from the risk/reward perspective at the moment. We will keep you informed should anything change, or should we see a confirmation/invalidation of the above.
USD/CAD
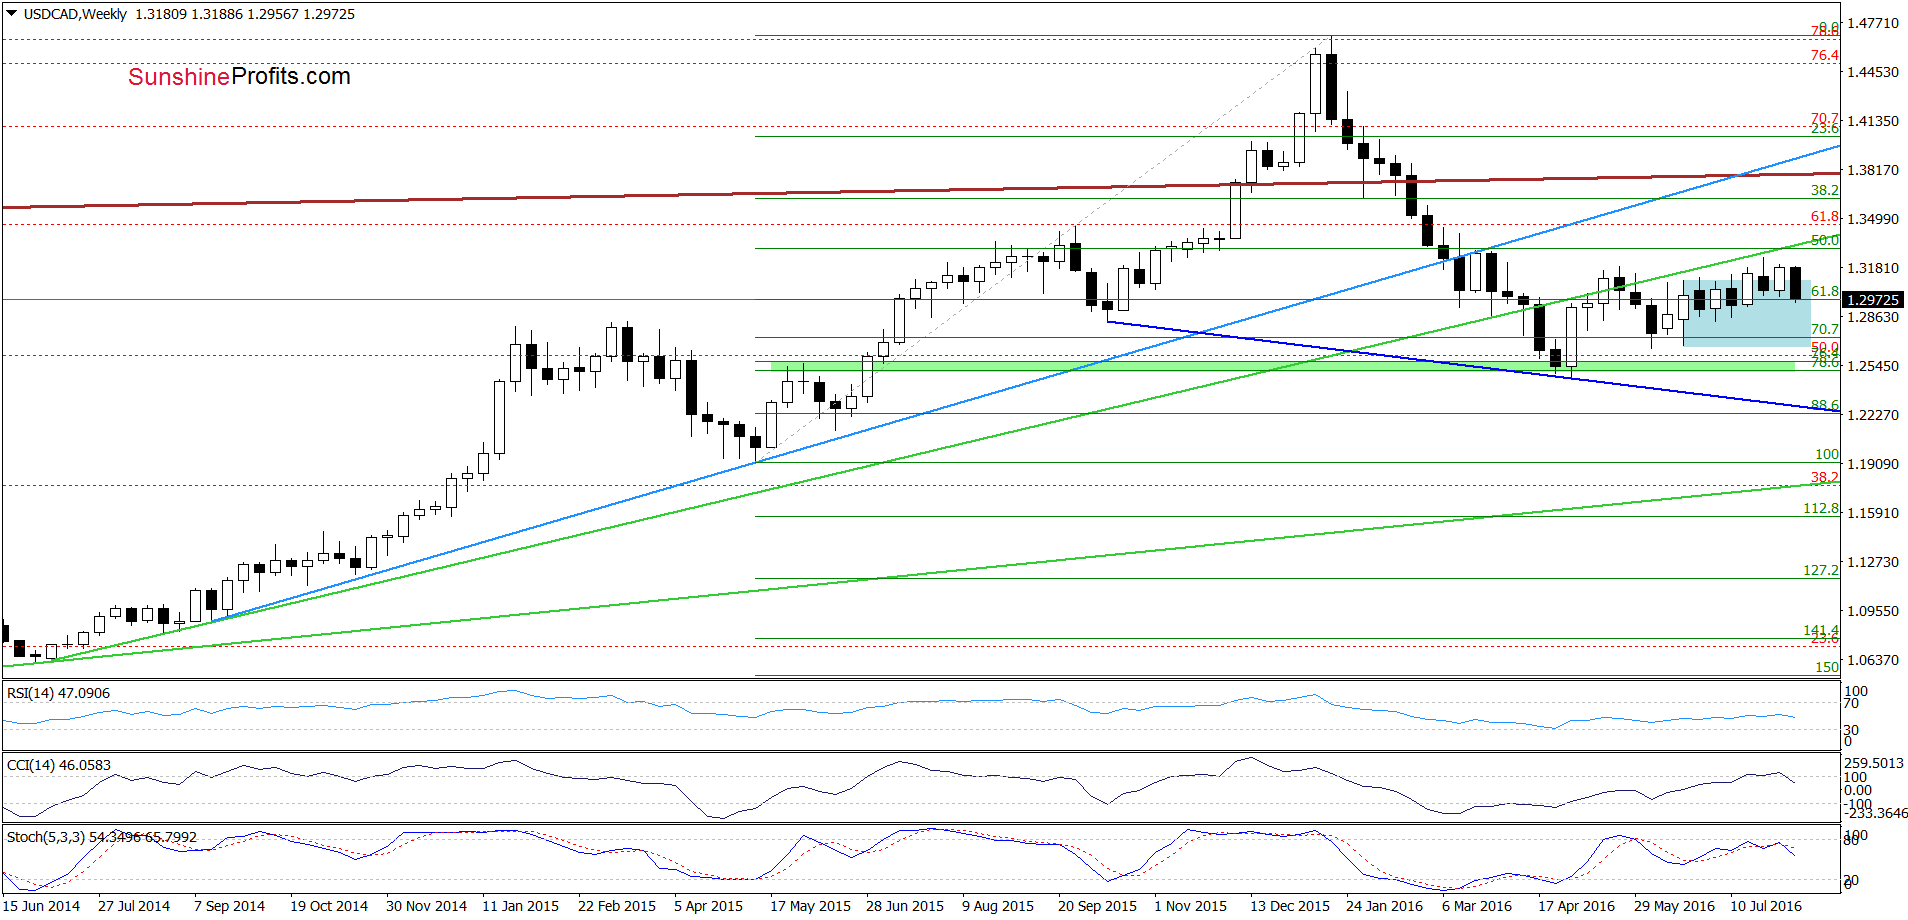
On the weekly chart, we see that USD/CAD reversed and declined, which resulted in a comeback to the blue consolidation (an invalidation of earlier breakout above the upper line of the formation is a negative signal – especially if the exchange rate closes the week below it). How did this drop affect the very short-term picture? Let’s check.
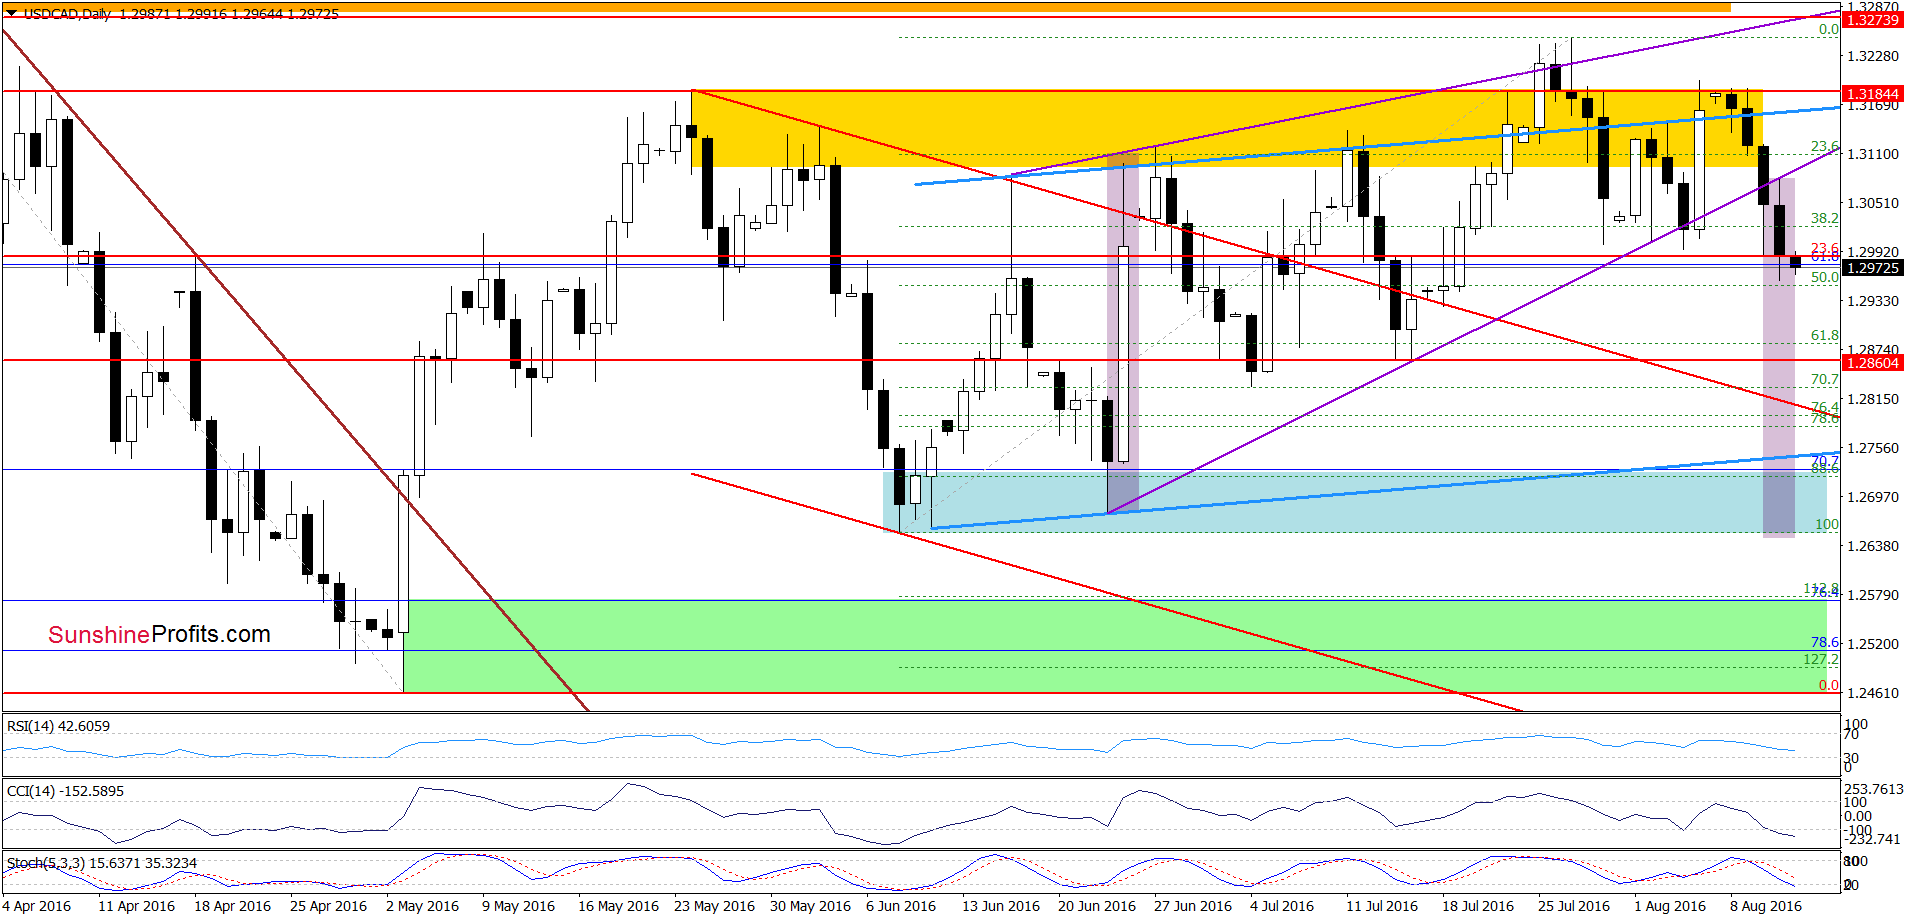
Quoting our previous commentary on this currency pair:
(…) USD/CAD closed the day below the upper blue line, invalidating Friday’s breakout, which triggered a sharp decline earlier today. With this move the exchange rate reached the last week’s lows, which could result in a rebound. Nevertheless, the current position of the indicators (they generated sell signals) suggests that lower values of USD/CAD are still ahead us.
As you see, the situation developed in line with the above scenario and USD/CAD declined after an increase to the previously-broken lower border of the purple rising wedge. In this way, the exchange rate verified earlier breakdown, which is a negative signal that suggests further deterioration. If this is the case the next downside target would be around 1.2860, where the mid-Jul lows are. However, taking into account the height of the rising wedge (and sell signals generated by the weekly indicators) , it seems that USD/CAD will move even lower and test the blue support zone created by the Jun lows (around 1.2653-1.2739) in the coming week. Therefore, we believe that opening short positions is justified from the risk/reward perspective.
Very short-term outlook: bearish
Short-term outlook: mixed with bearish bias
MT outlook: mixed
LT outlook: mixed
Trading position (short-term; our opinion): Short positions (with a stop-loss order at 1.3274 and initial downside target at 1. 2740) are justified from the risk/reward perspective. We will keep you informed should anything change, or should we see a confirmation/invalidation of the above.
USD/CHF
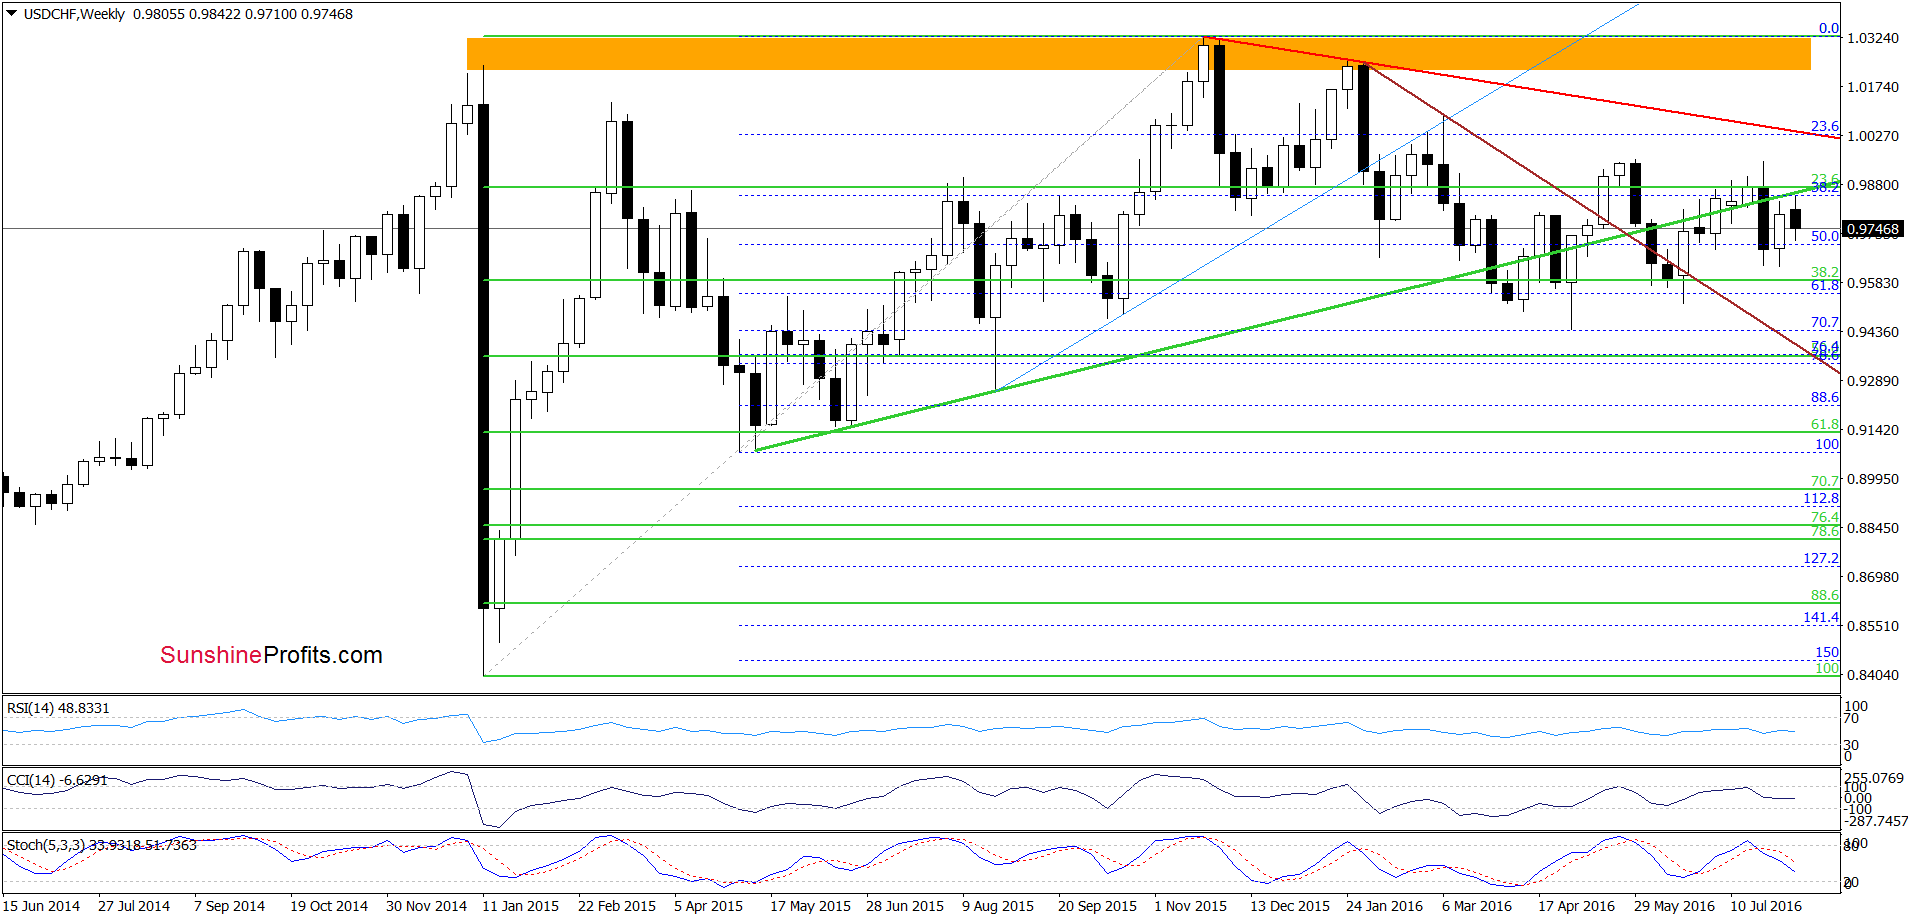
Looking at the weekly chart, we see that the proximity to the green resistance line encouraged currency bears to act, which resulted in a decline earlier this week. What impact did this drop have on the daily chart? Let’s take a closer look and find out.
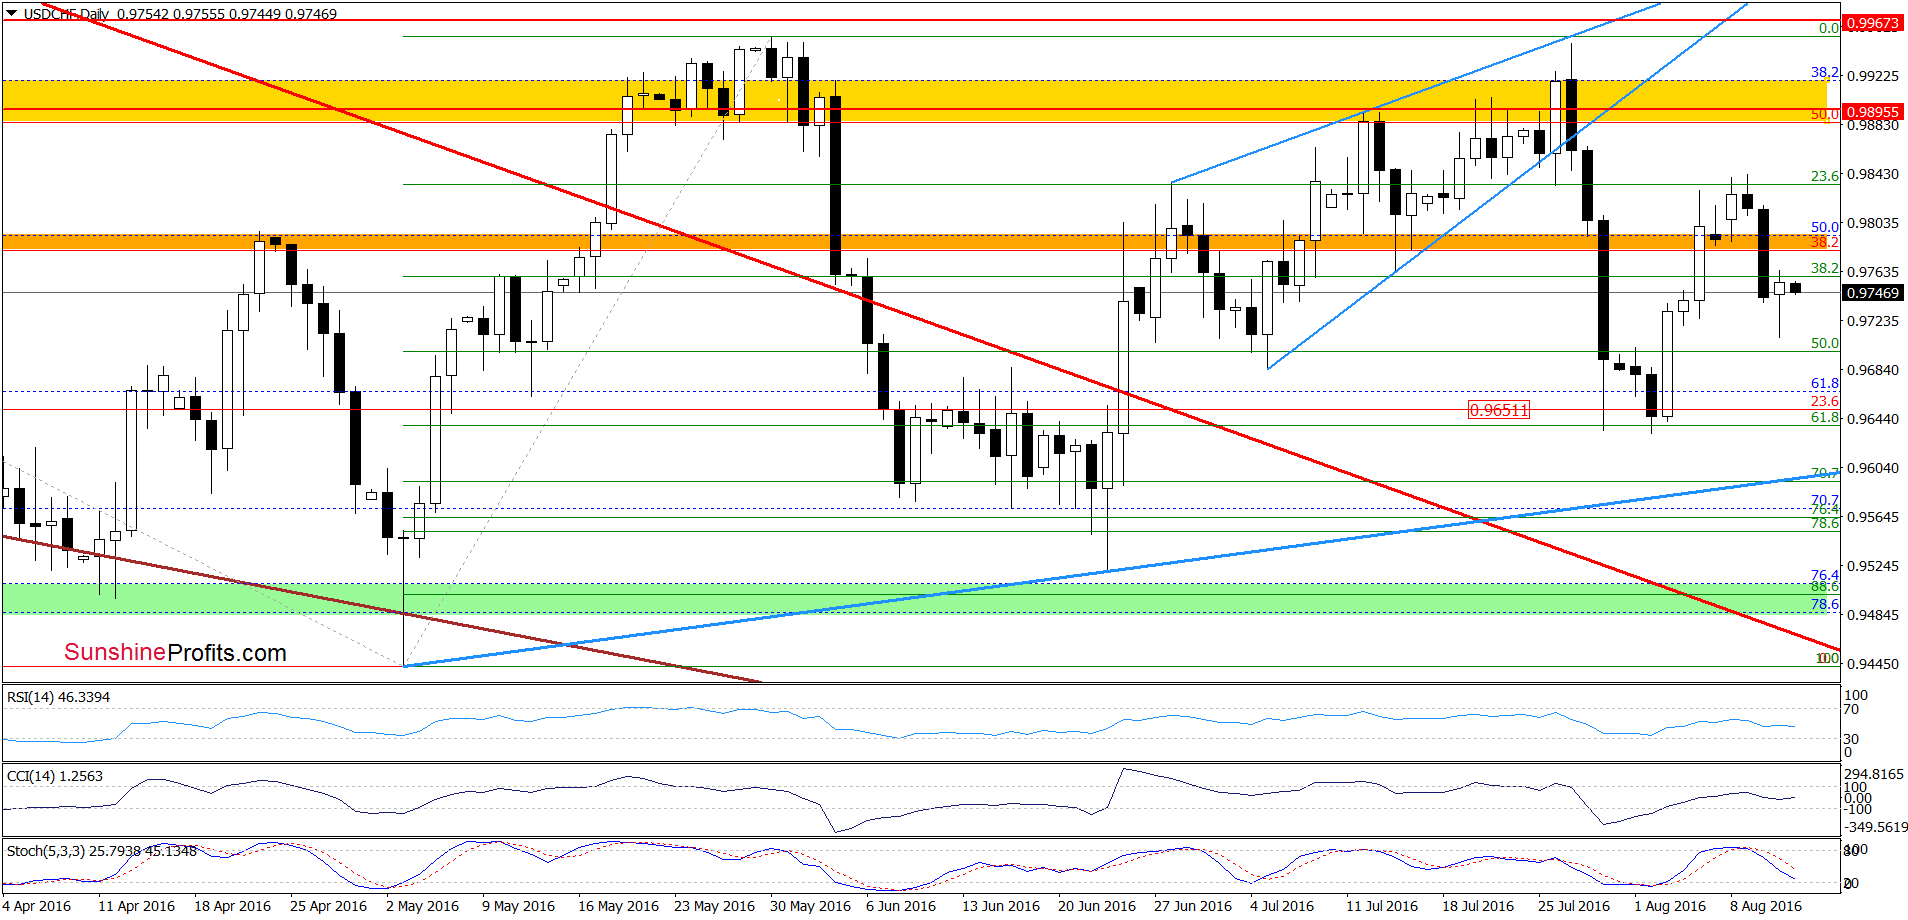
From this perspective, we see that although USD/CHF rebounded slightly yesterday, the orange resistance zone continues to keep increases in check. Additionally, sell signals remain in place, suggesting further deterioration. Taking the above into account, we think that lower values of the exchange rate are just around the corner. If this is the case and the pair moves lower from current levels, we’ll see a re-test of the 61.8% Fibonacci retracement and recent lows in the coming days.
Very short-term outlook: bearish
Short-term outlook: mixed with bearish bias
MT outlook: mixed
LT outlook: mixed
Trading position (short-term; our opinion): Short positions (with a stop loss order at 0.9895 and initial downside target at 0.9651) are justified from the risk/reward perspective at the moment. We will keep you informed should anything change, or should we see a confirmation/invalidation of the above.
AUD/USD
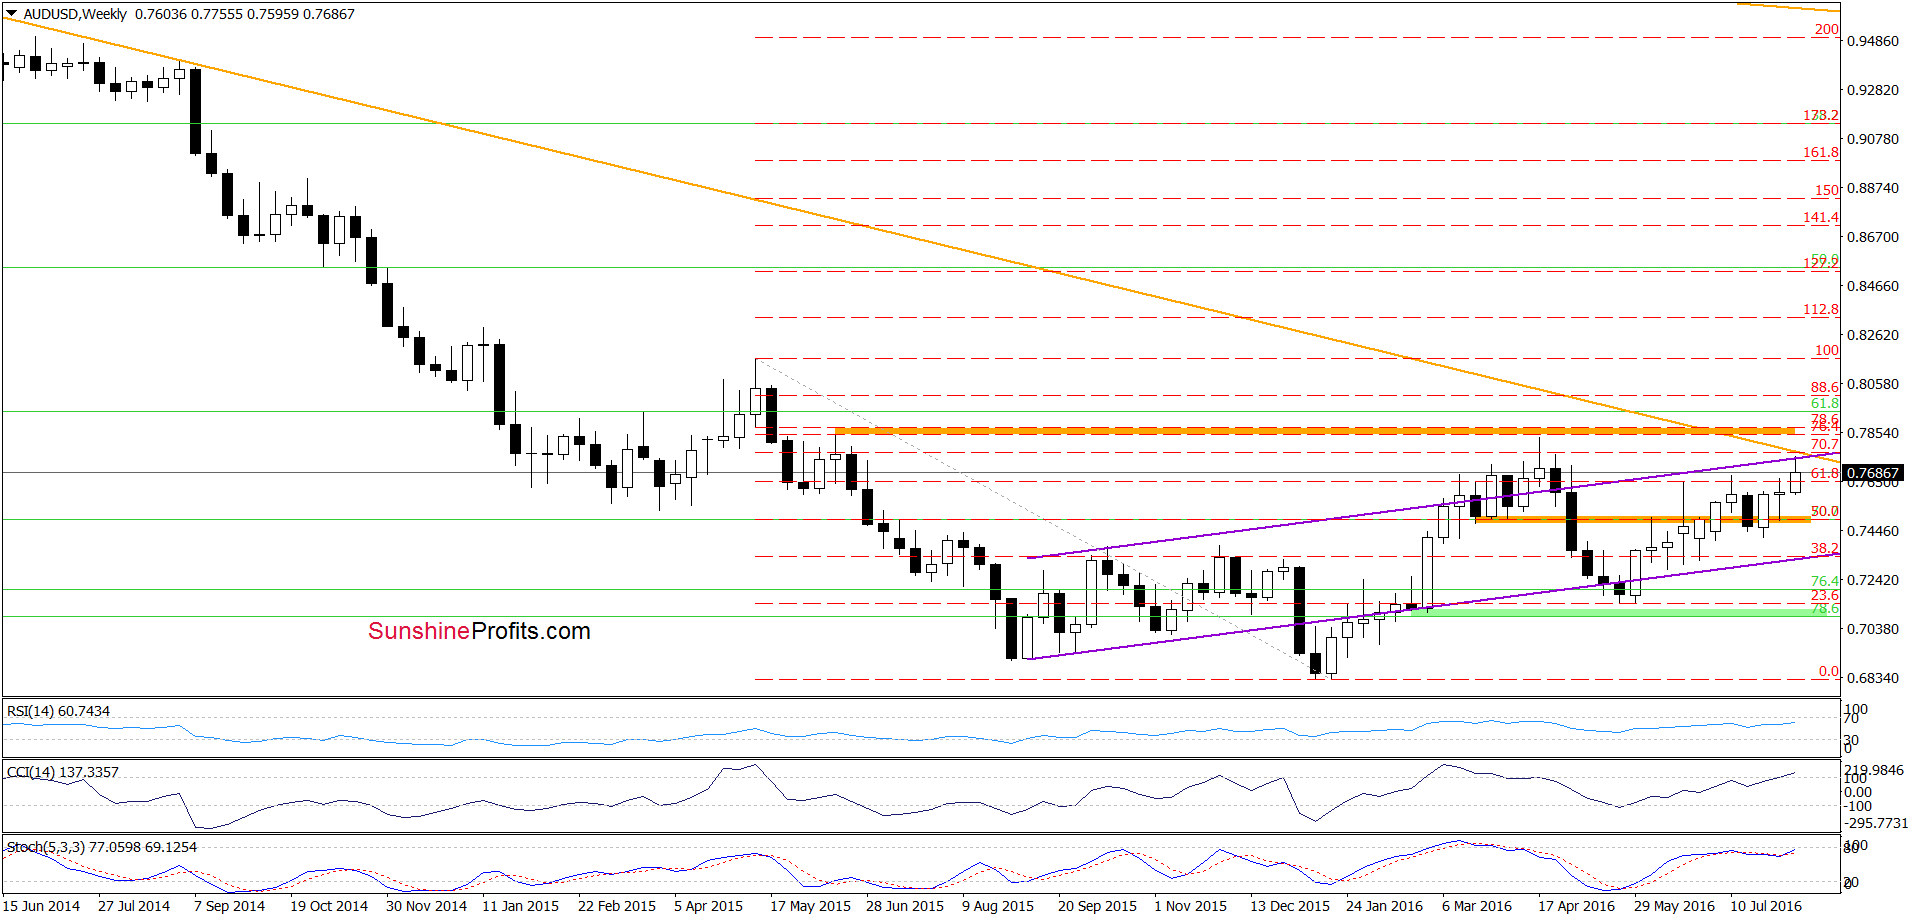
Looking at the weekly chart, we see that AUD/SD extended gains and climbed to the upper border of the purple rising trend channel. With this move, the air also approached the long-term orange resistance line and the late-Apr high, which together may stop further improvement in the coming week.
Are there any other factors that could encourage currency bears to act? Let’s examine the very short-term chart and find out.
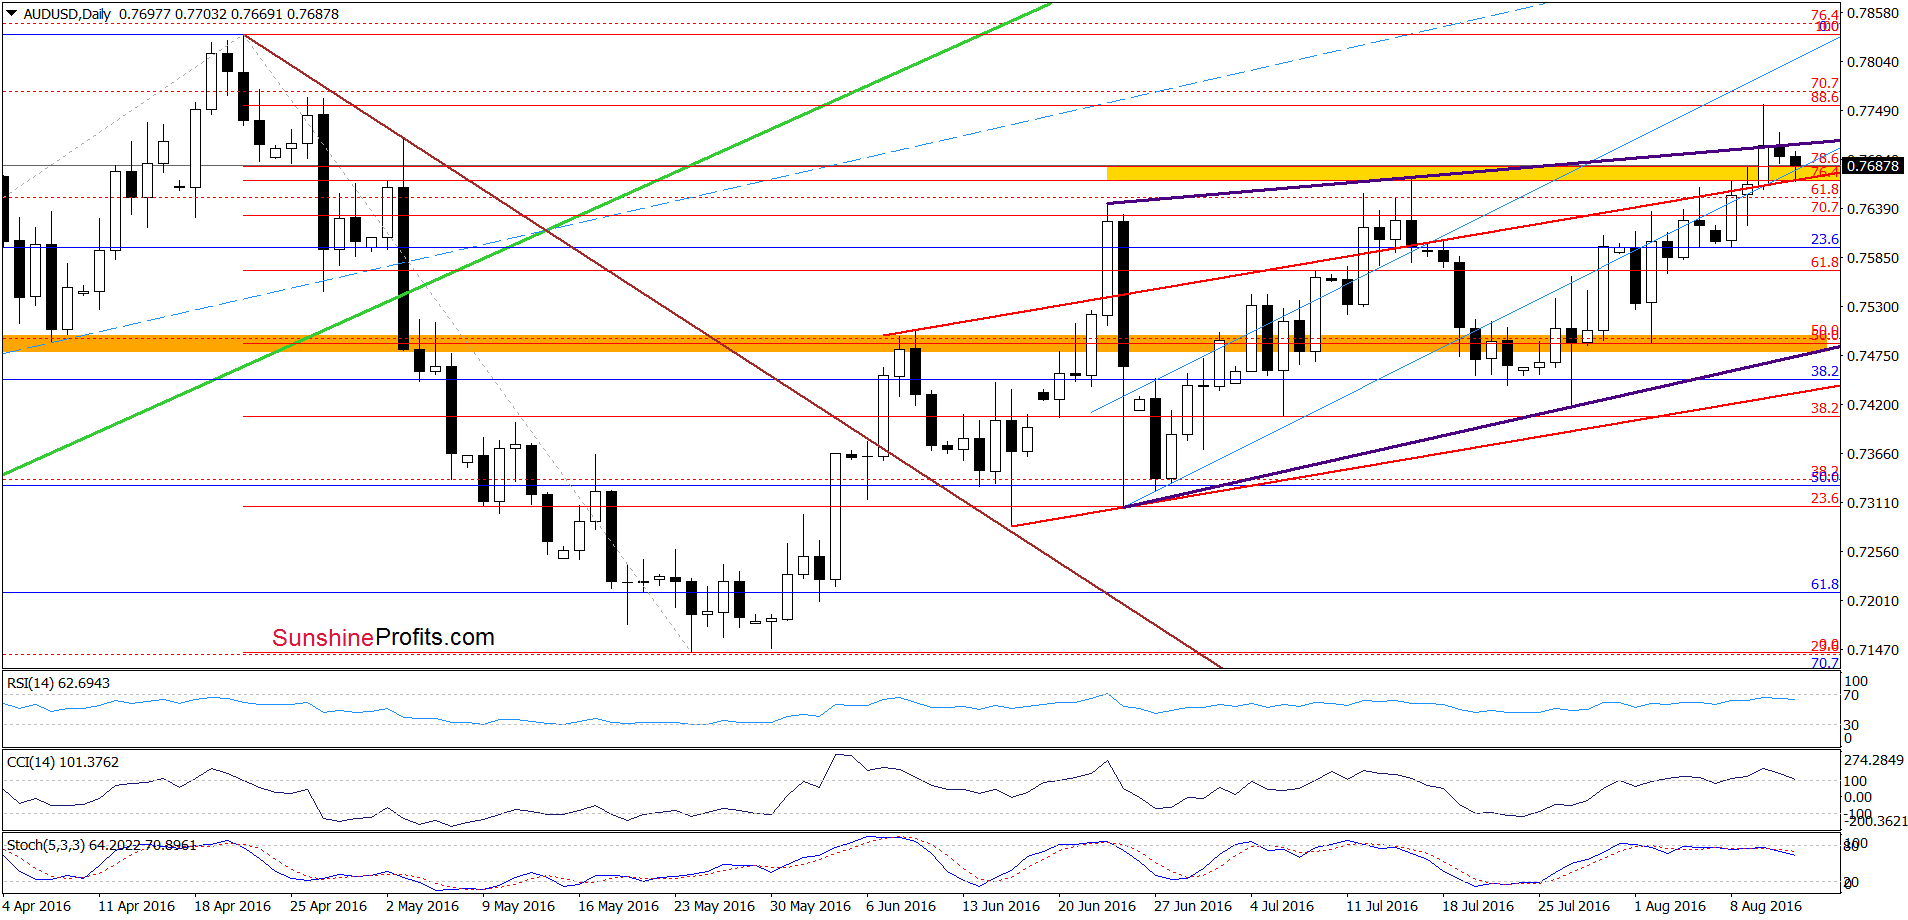
From today’s perspective, we see that although AUD/USD extended gains and broke above the yellow resistance zone on Wednesday, currency bulls didn’t manage to hold gained levels, which resulted in a pullback. Thanks to this drop the exchange rate invalidated earlier breakout above the upper border of the navy blue rising wedge and closed the day under this resistance line. Yesterday, we saw anther unsuccessful attempt to break above this line, which resulted in another daily closure below it. Earlier today, AUD/USD moved little lower once again, however, as long as there won’t be daily close below the Wednesday’s low of 0.7660, another attempt to test the upper border of the navy blue rising wedge can’t be ruled out. Nevertheless, the current position of the indicators suggests that further deterioration is just around the corner.
Very short-term outlook: mixed with bearish bias
Short-term outlook: mixed with bearish bias
MT outlook: mixed
LT outlook: mixed
Trading position (short-term; our opinion): No positions are justified from the risk/reward perspective. However, if we see a daily closure under the Wednesday’s low of 0.7660, we’ll consider opening short positions. We will keep you informed should anything change, or should we see a confirmation/invalidation of the above.
Thank you.
Nadia Simmons
Forex & Oil Trading Strategist
Przemyslaw Radomski, CFA
Founder, Editor-in-chief
Gold & Silver Trading Alerts
Forex Trading Alerts
Oil Investment Updates
Oil Trading Alerts

