

Earlier today, the U.S. dollar declined sharply against its Canadian counterpart as crude oil’s futures bounced off session’s lows and came back to around $43. As a result, USD/CAD dropped under the lower border of the rising wedge once again. Will this time currency bears manage to push the exchange rate lower?
In our opinion the following forex trading positions are justified - summary:
- EUR/USD: none
- GBP/USD: short (a stop-loss at 1.3579; initial downside target at 1.2519)
- USD/JPY: none
- USD/CAD: none
- USD/CHF: short (stop-loss at 0.9895; initial downside target at 0.9651)
- AUD/USD: none
EUR/USD
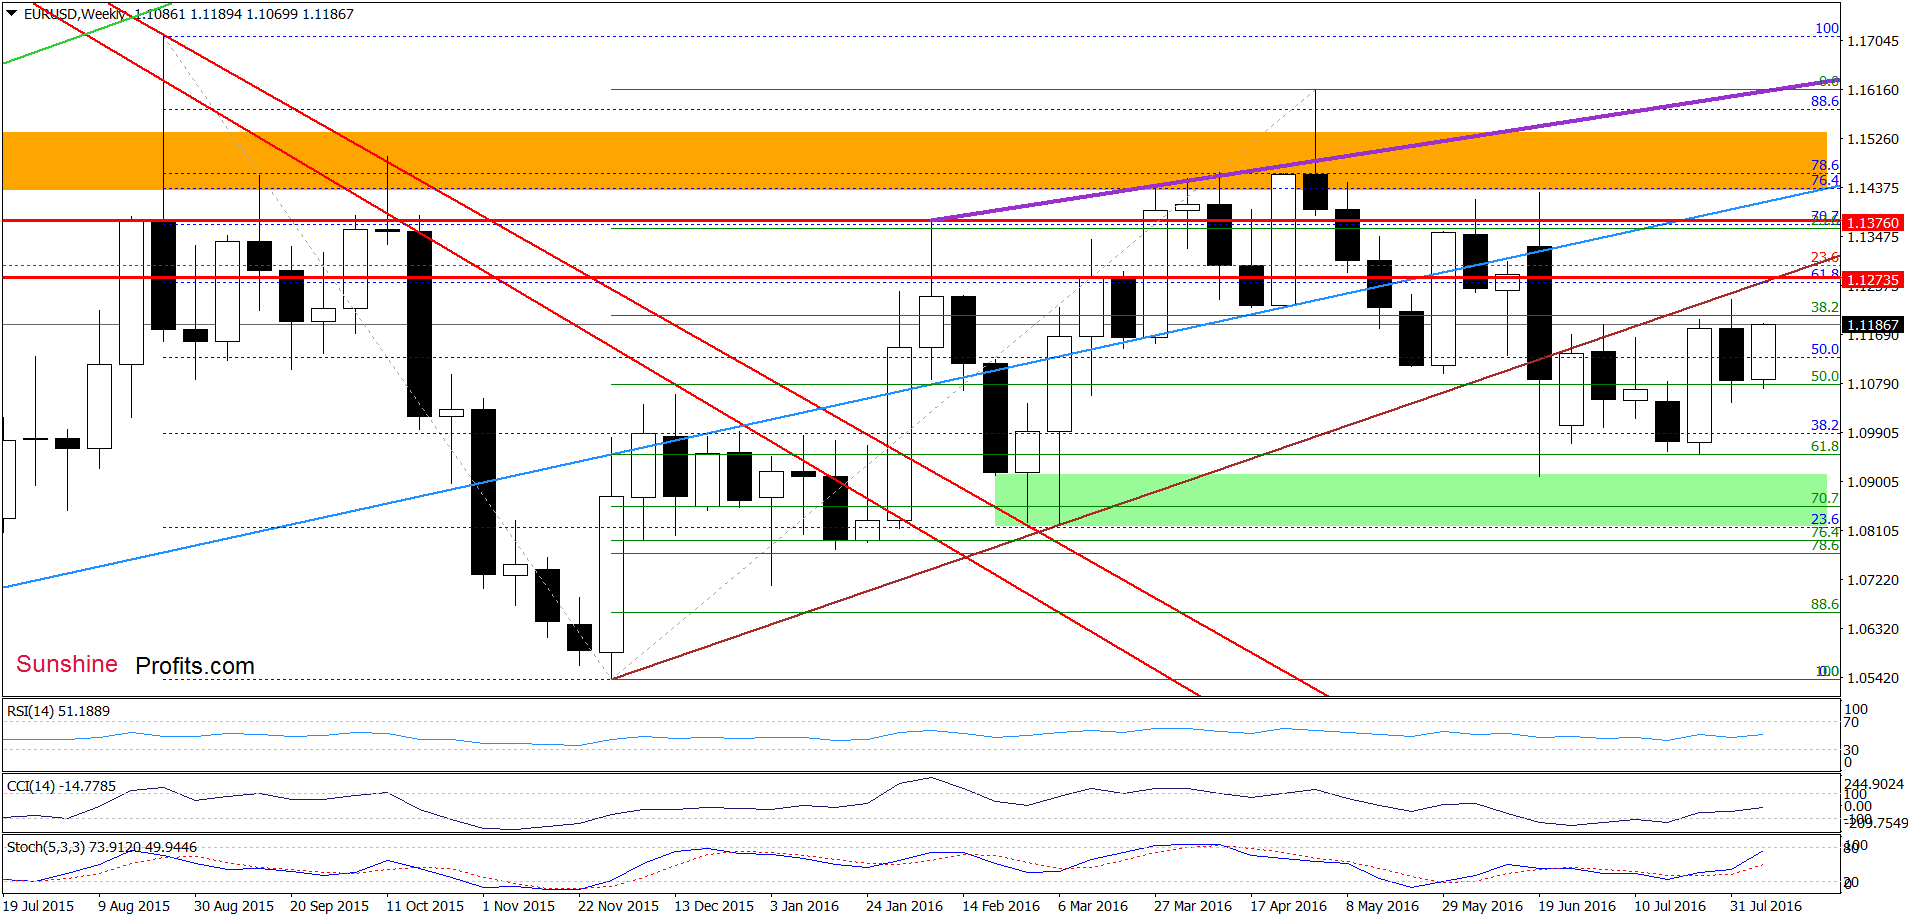
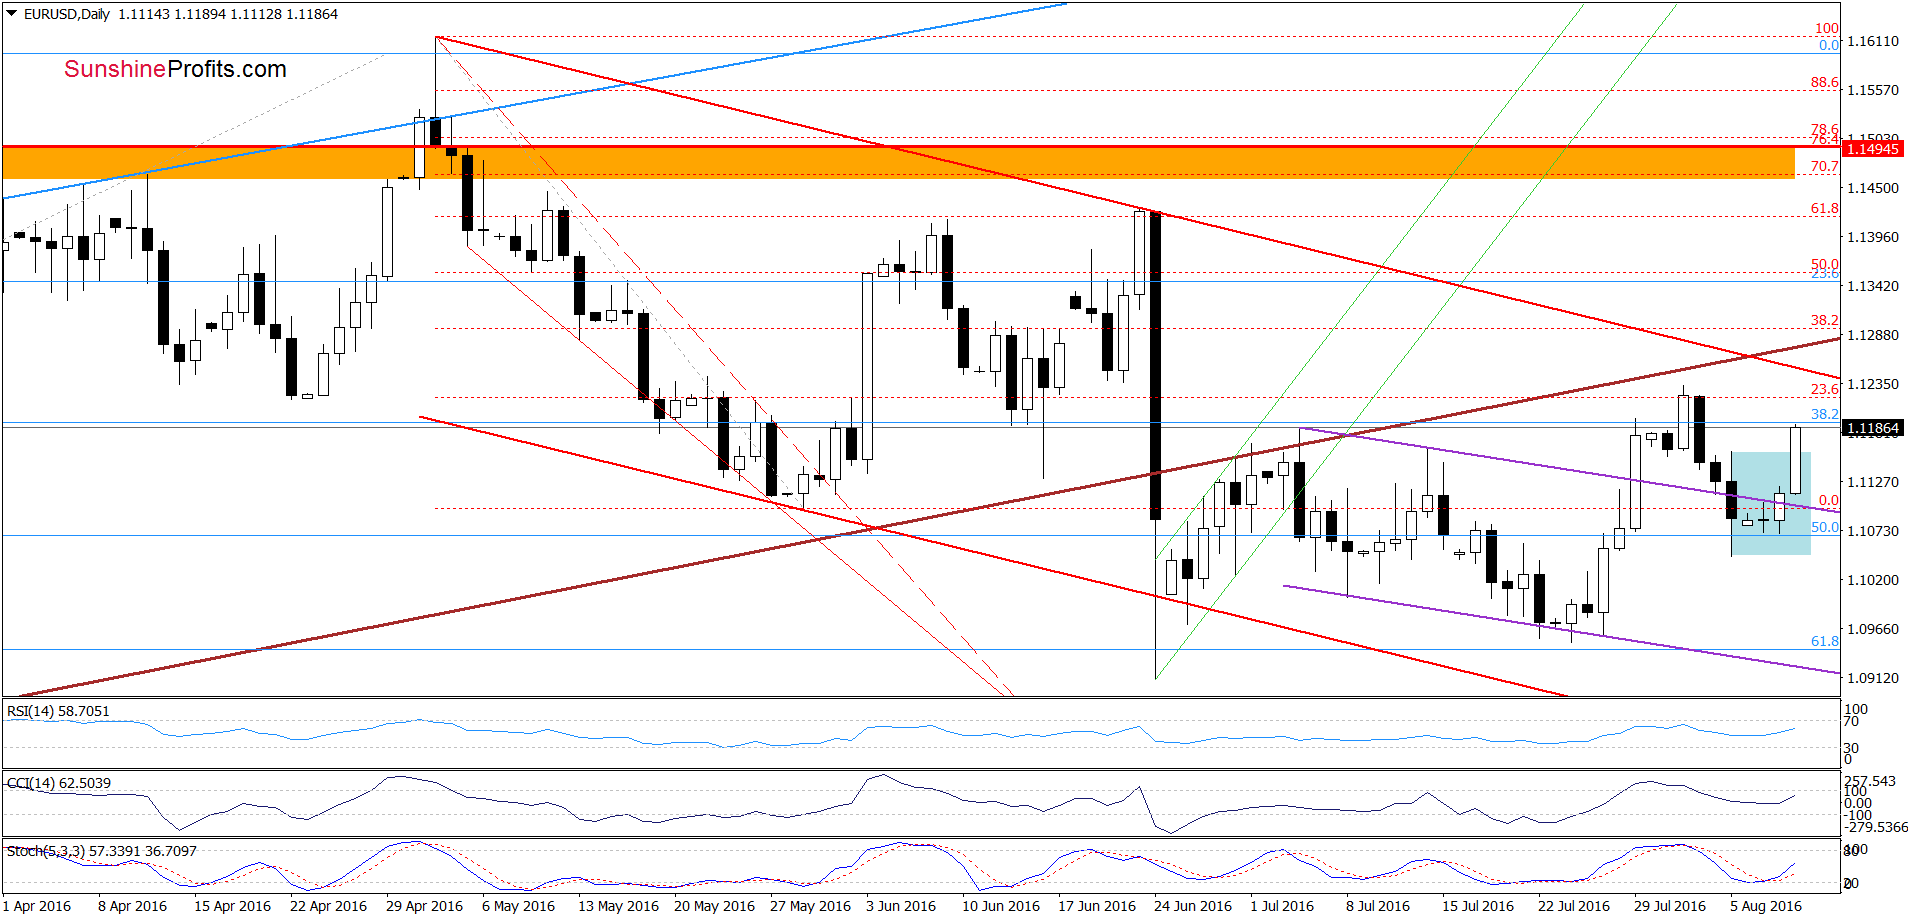
Looking at the daily chart, we see that EUR/USD moved sharply higher earlier today, breaking above the upper line of the blue consolidation. Taking this fact and buy signal generated by the Stochastic Oscillator into account, it seems that the pair will test the upper border of the medium-term red declining trend channel or even the brown resistance line in the coming days. Therefore, closing short positions is justified from the risk/reward perspective.
Very short-term outlook: bullish
Short-term outlook: mixed
MT outlook: mixed
LT outlook: mixed
Trading position (short-term; our opinion): No positions are justified from the risk/reward perspective. We will keep you informed should anything change, or should we see a confirmation/invalidation of the above.
USD/CAD
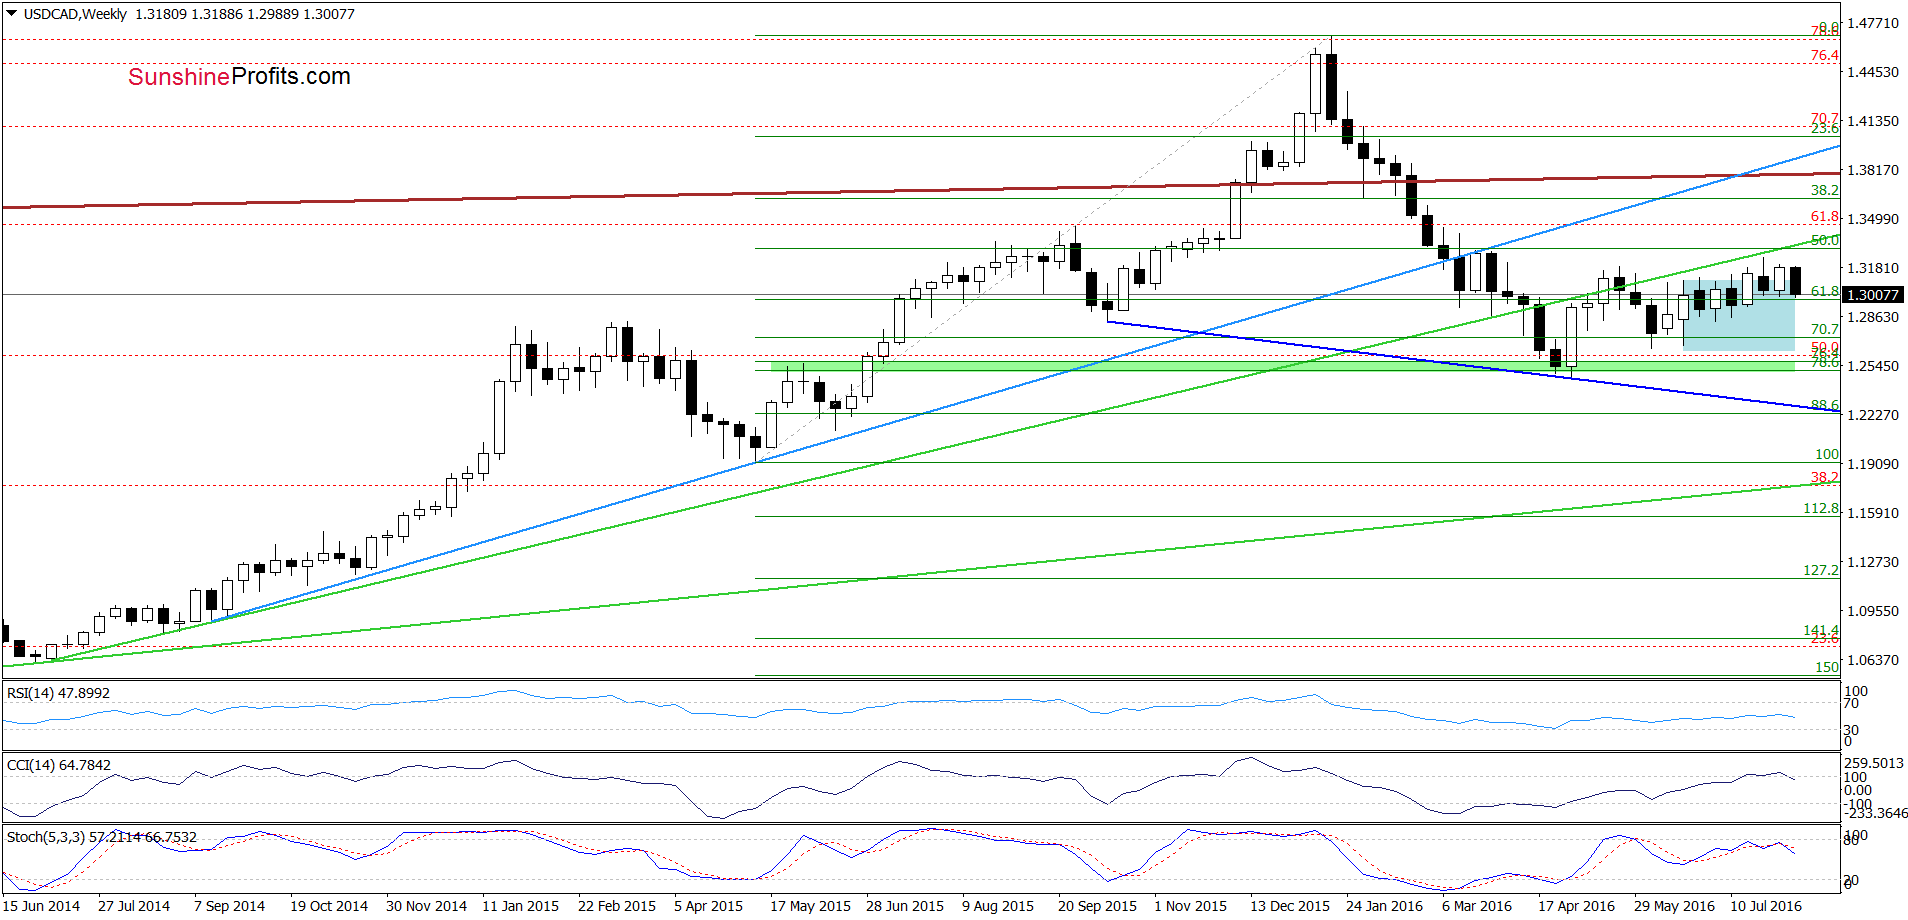
On Monday, we wrote:
(…) currency bulls didn’t give up and managed to push the pair above the upper line of the formation once again. Taking this fact into account, it seems that we may see another attempt to climb to the previously-broken green line, which serves as the nearest medium-term resistance. Nevertheless, the current position of the indicators suggests that the space for gains may be limited and lower values of the exchange rate are just around the corner.
From today’s point of view, we see that the situation developed in line with the above scenario and USD/CAD reversed, triggering a pullback earlier this week. How did this drop affect the very short-term picture? Let’s check.
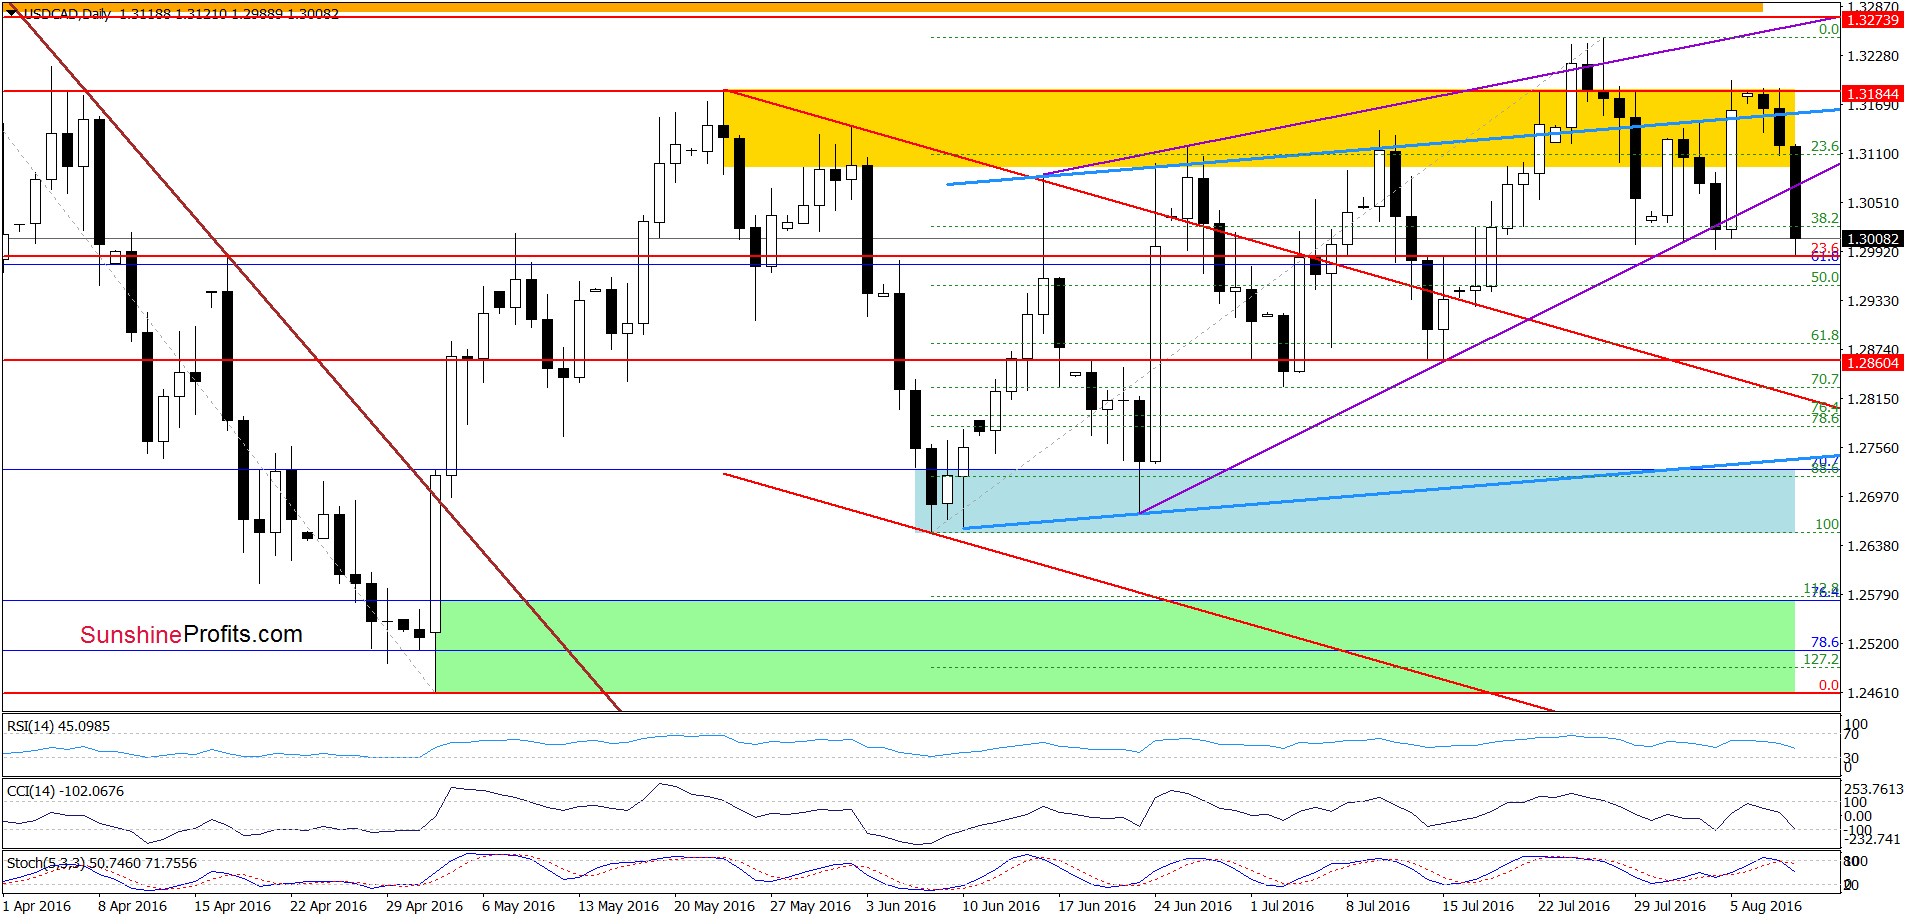
Quoting our Monday’s alert:
(…) the pair broke above the upper line of the blue rising trend channel and reached the upper border of the yellow resistance zone once again. Earlier today, this area encouraged currency bears to act, which resulted in a small pullback. Additionally, the CCI and Stochastic Oscillator climbed to levels, which could trigger sell signals. Taking all the above into account, we think that further deterioration is just around the corner.
On the daily chart, we see that currency bears pushed the pair lower as we had expected. Yesterday, USD/CAD closed the day below the upper blue line, invalidating Friday’s breakout, which triggered a sharp decline earlier today. With this move the exchange rate reached the last week’s lows, which could result in a rebound. Nevertheless, the current position of the indicators (they generated sell signals) suggests that lower values of USD/CAD are still ahead us. If this is the case, and we’ll see a daily closure below Thursday’s low of 1.2995, the next downside target would be around 1.2860, where the mid-Jul lows are.
Very short-term outlook: mixed with bearish bias
Short-term outlook: mixed with bearish bias
MT outlook: mixed
LT outlook: mixed
Trading position (short-term; our opinion): No positions are justified from the risk/reward perspective. We will keep you informed should anything change, or should we see a confirmation/invalidation of the above.
USD/CHF
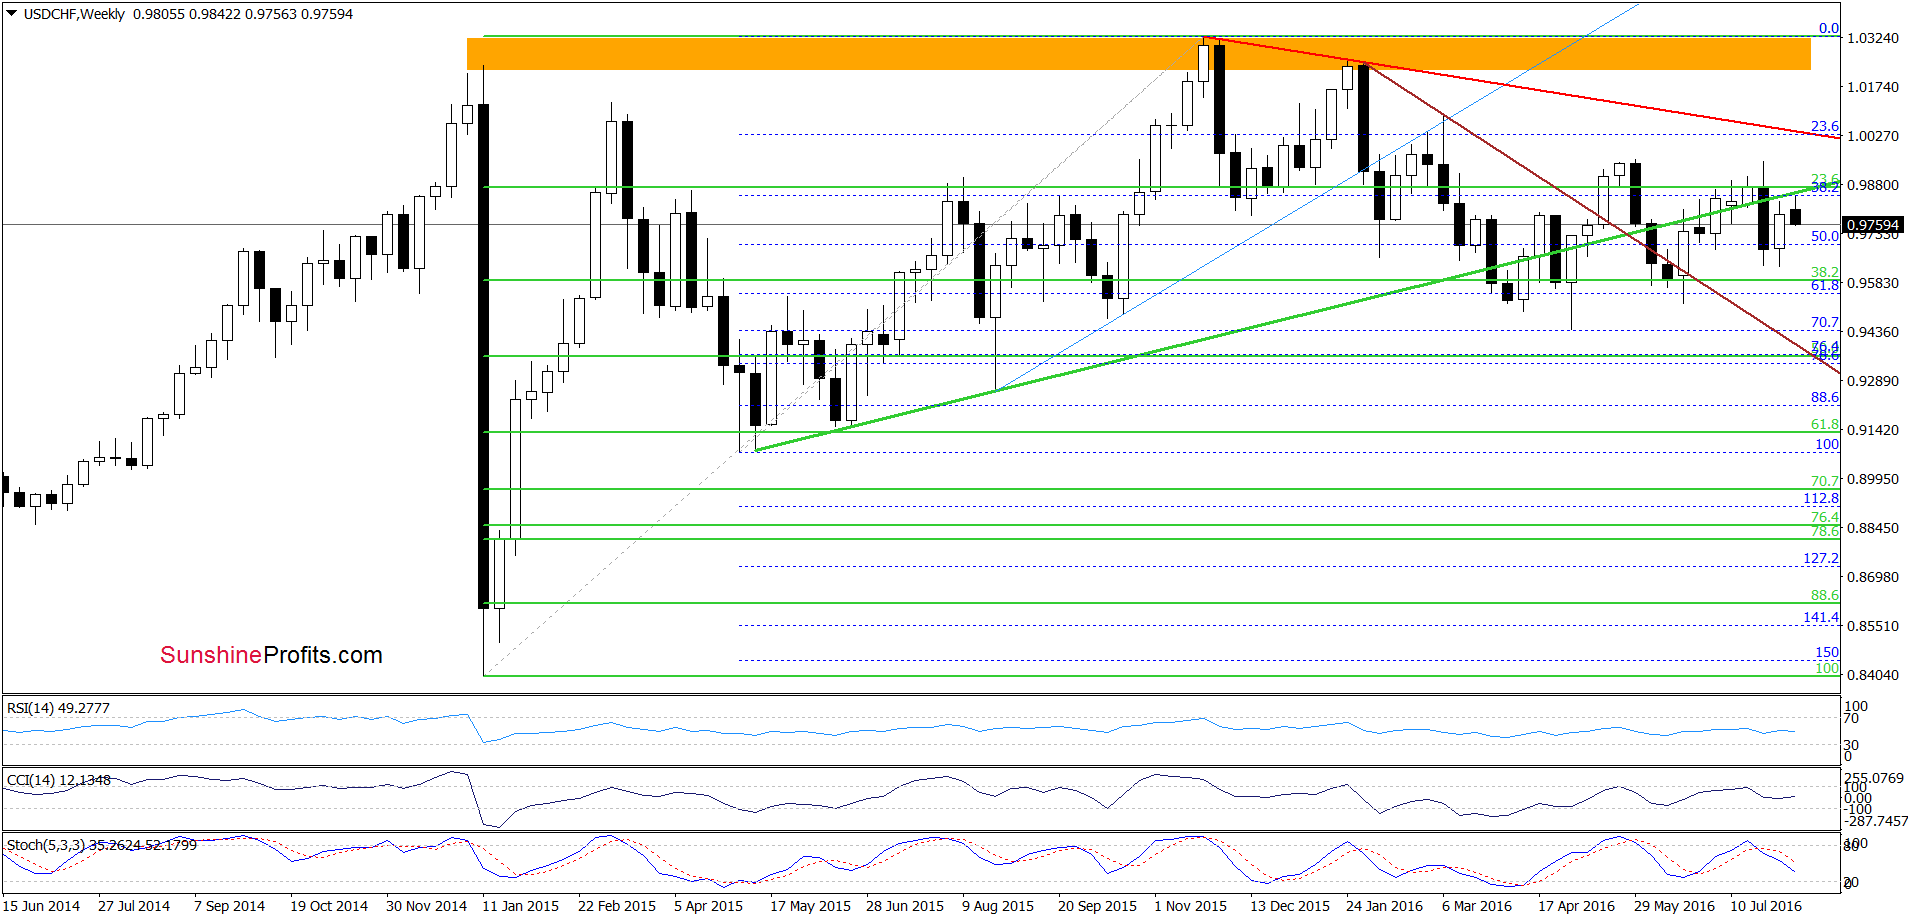
Looking at the weekly chart, we see that the proximity to the green resistance line encouraged currency bears to act, which resulted in a decline earlier this week. What impact did this drop have on the daily chart? Let’s take a closer look and find out.
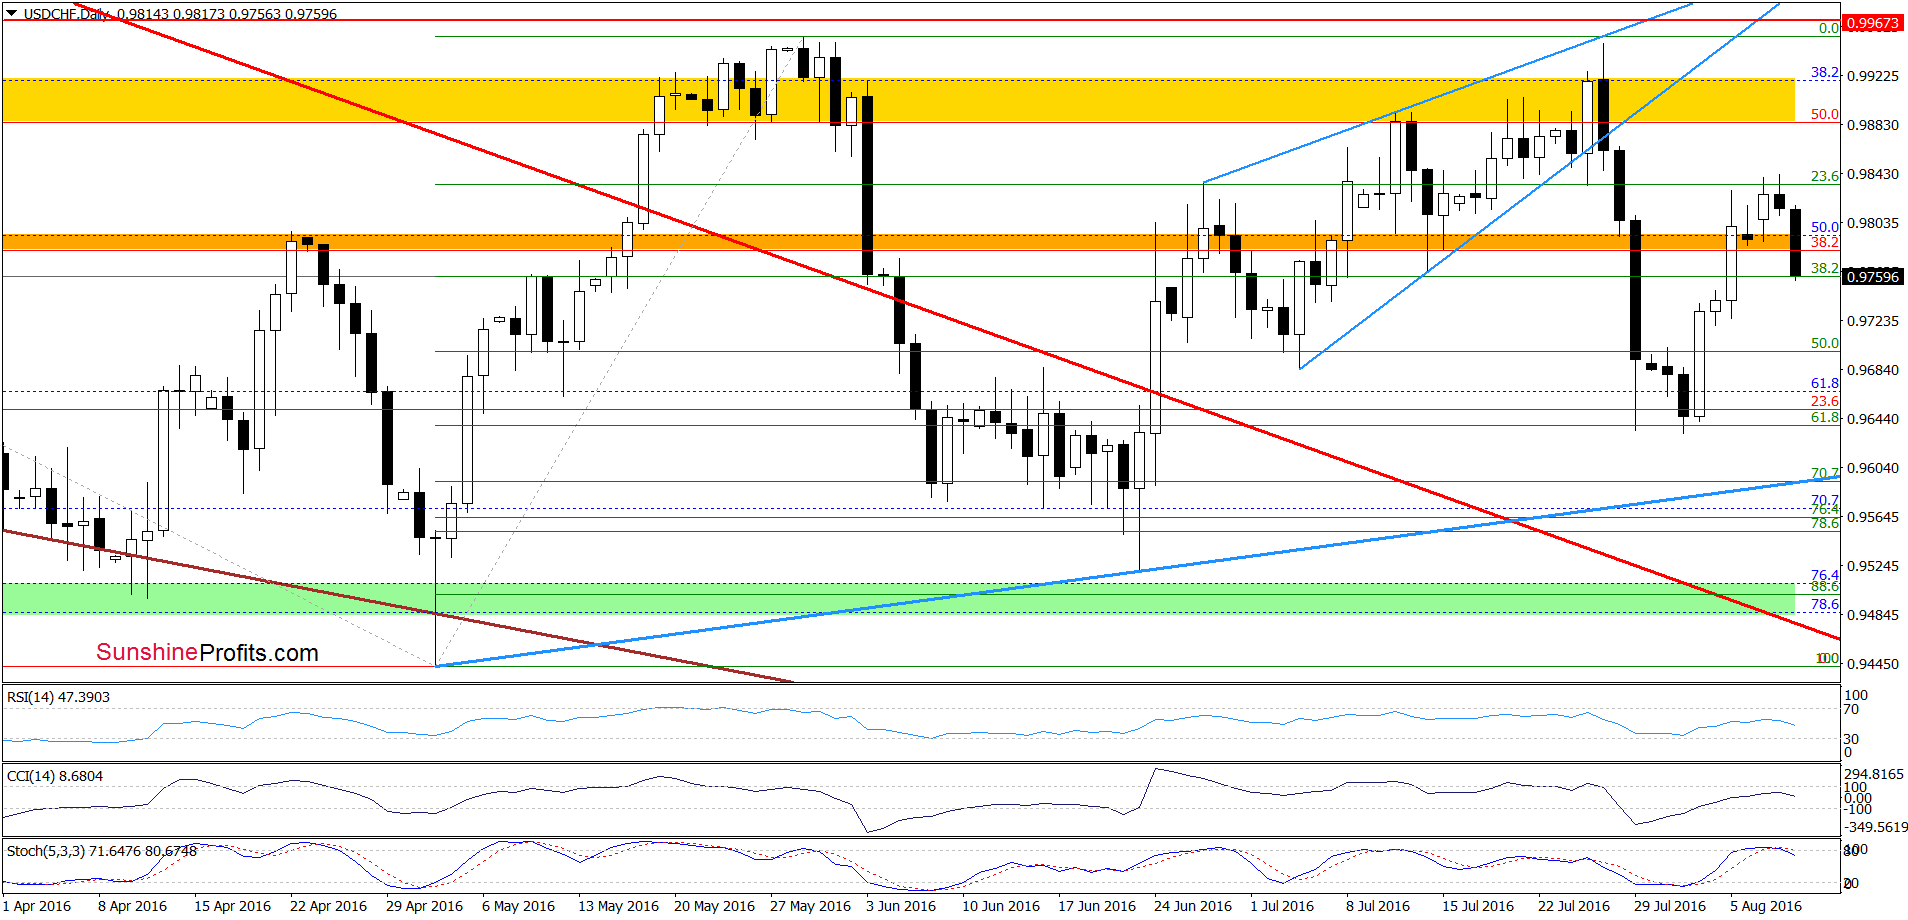
From this perspective, we see that although USD/CHF broke above the orange resistance zone, this improvement was only temporary and currency bears came back to the market, triggering a sharp decline earlier today. As a result, the exchange rate dropped under the above-mentioned area, invalidating earlier breakout. Taking this negative signal into account and combining it with sell signals generated by the indicators (and the medium-term picture), we think that lower values of the exchange rate are just around the corner. If this is the case and the pair moves lower from current levels, we’ll see a re-test of the 61.8% Fibonacci retracement and recent lows in the coming days.
Very short-term outlook: bearish
Short-term outlook: mixed with bearish bias
MT outlook: mixed
LT outlook: mixed
Trading position (short-term; our opinion): Short positions (with a stop loss order at 0.9895 and initial downside target at 0.9651) are justified from the risk/reward perspective at the moment. We will keep you informed should anything change, or should we see a confirmation/invalidation of the above.
Thank you.
Nadia Simmons
Forex & Oil Trading Strategist
Przemyslaw Radomski, CFA
Founder, Editor-in-chief
Gold & Silver Trading Alerts
Forex Trading Alerts
Oil Investment Updates
Oil Trading Alerts

