

In our opinion the following forex trading positions are justified - summary:
- EUR/USD: short (stop-loss at 1.1273; initial downside target at 1.0951)
- GBP/USD: short (a stop-loss at 1.3579; initial downside target at 1.2519)
- USD/JPY: none
- USD/CAD: none
- USD/CHF: none
- AUD/USD: short (stop-loss at 0.7743; initial downside target at 0.7490)
EUR/USD
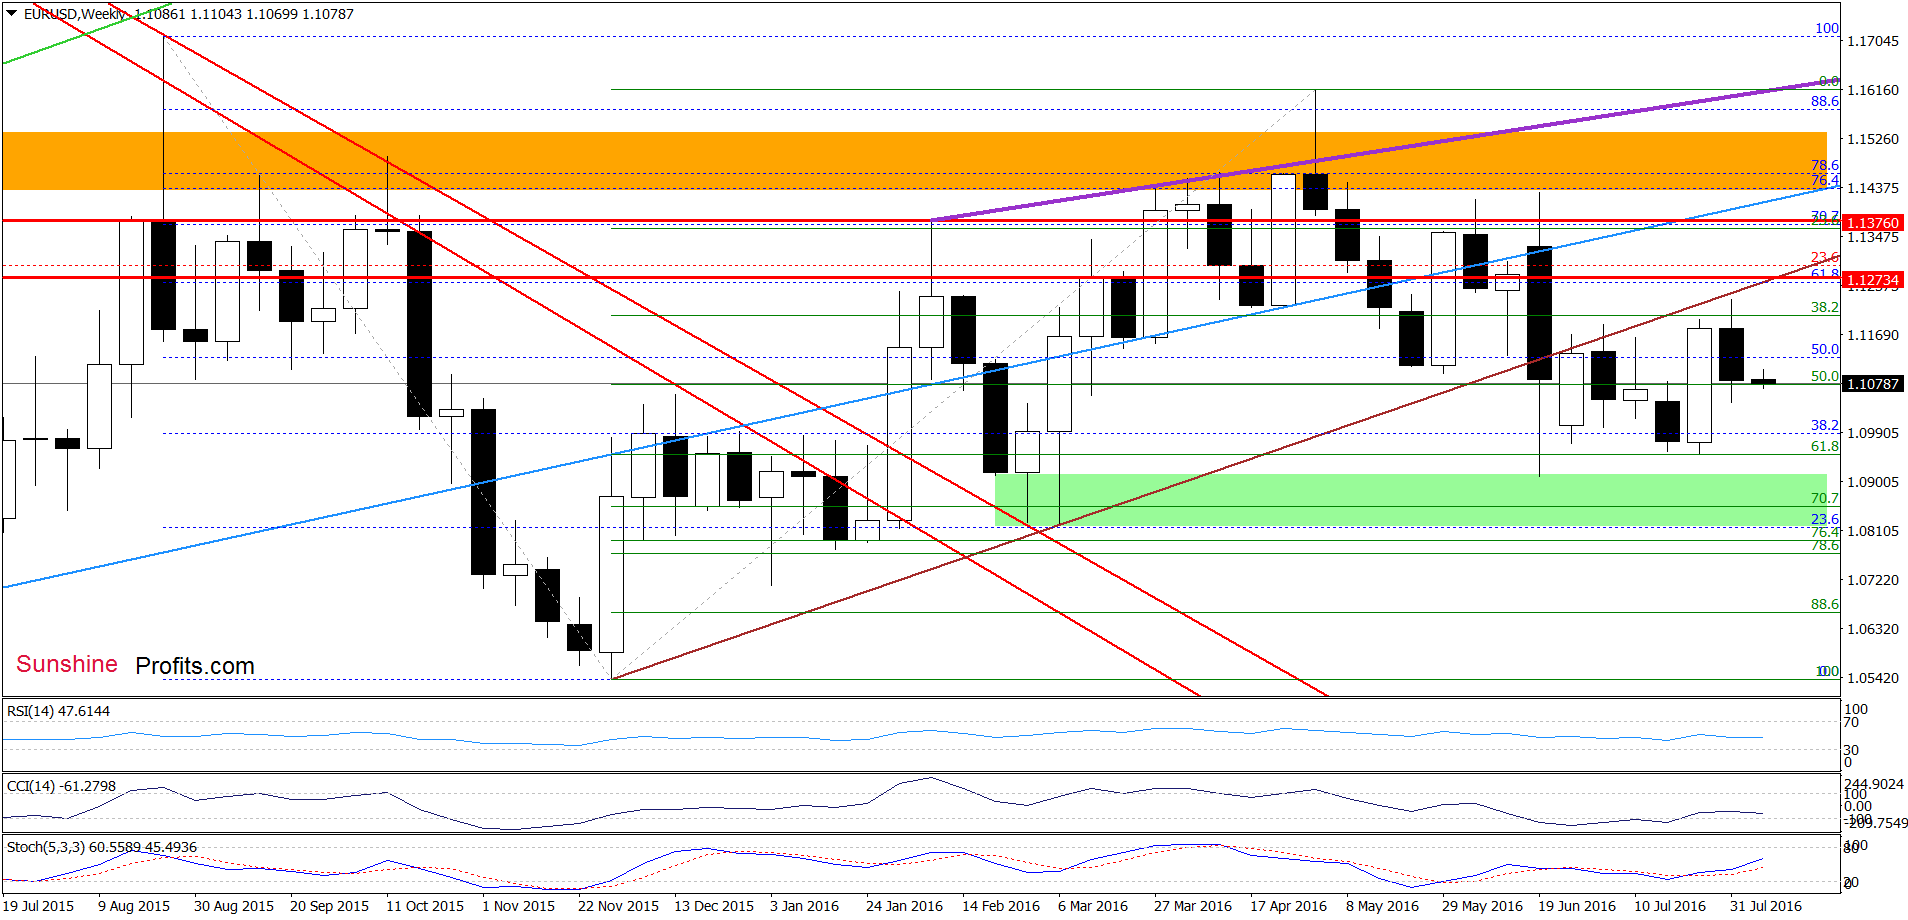
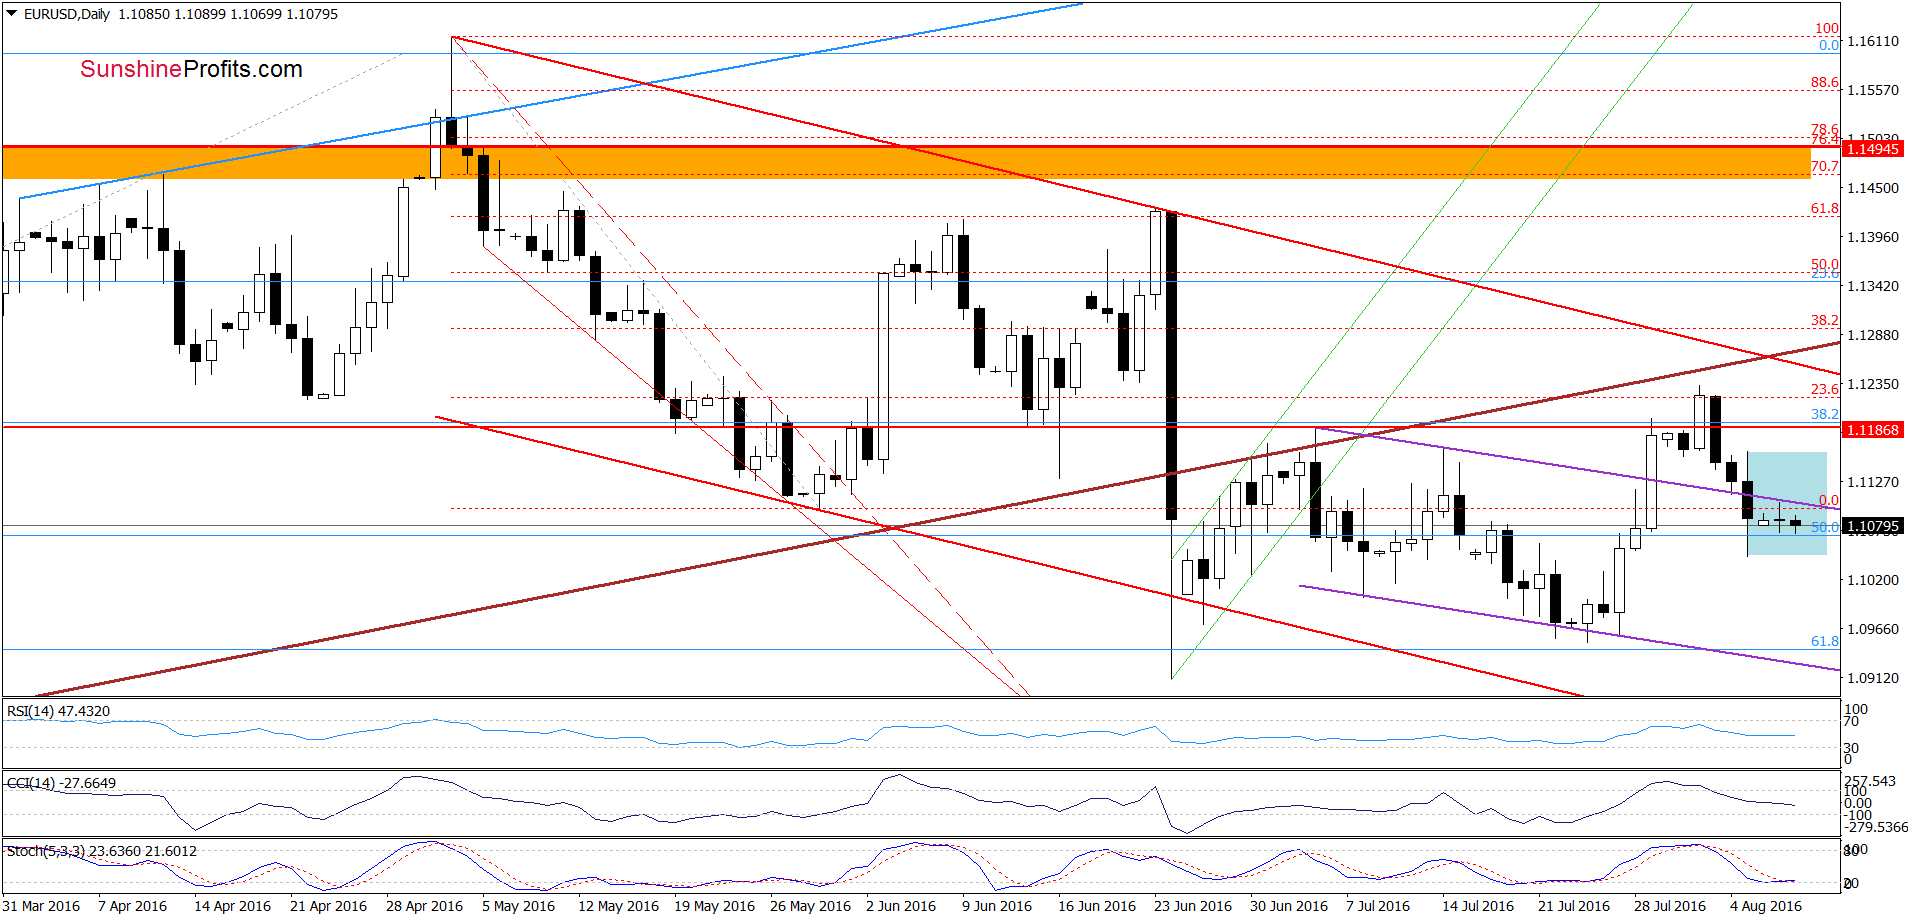
From today’s point of view, we see that the overall situation in the very short term chart hasn’t changed much as EUR/USD is still trading in a blue consolidation under the previously-broken the upper line of the purple declining trend channel. This means that invalidation of earlier breakout and its negative impact on the exchange rate is still in effect, supporting currency bears. Therefore, in our opinion, further deterioration is just around the corner and our downside targets from Friday’s alert remain up-to-date:
(…) if (…) the pair drops under the upper line of the purple declining trend channel, we’ll see not only drop to the previous lows, but also a test of the lower line of the formation in the following days.
Very short-term outlook: bearish
Short-term outlook: bearish
MT outlook: mixed with bearish bias
LT outlook: mixed
Trading position (short-term; our opinion): Short positions (with a stop loss order at 1.1273 and initial downside target at 1.0951) are justified from the risk/reward perspective. We will keep you informed should anything change, or should we see a confirmation/invalidation of the above.
GBP/USD
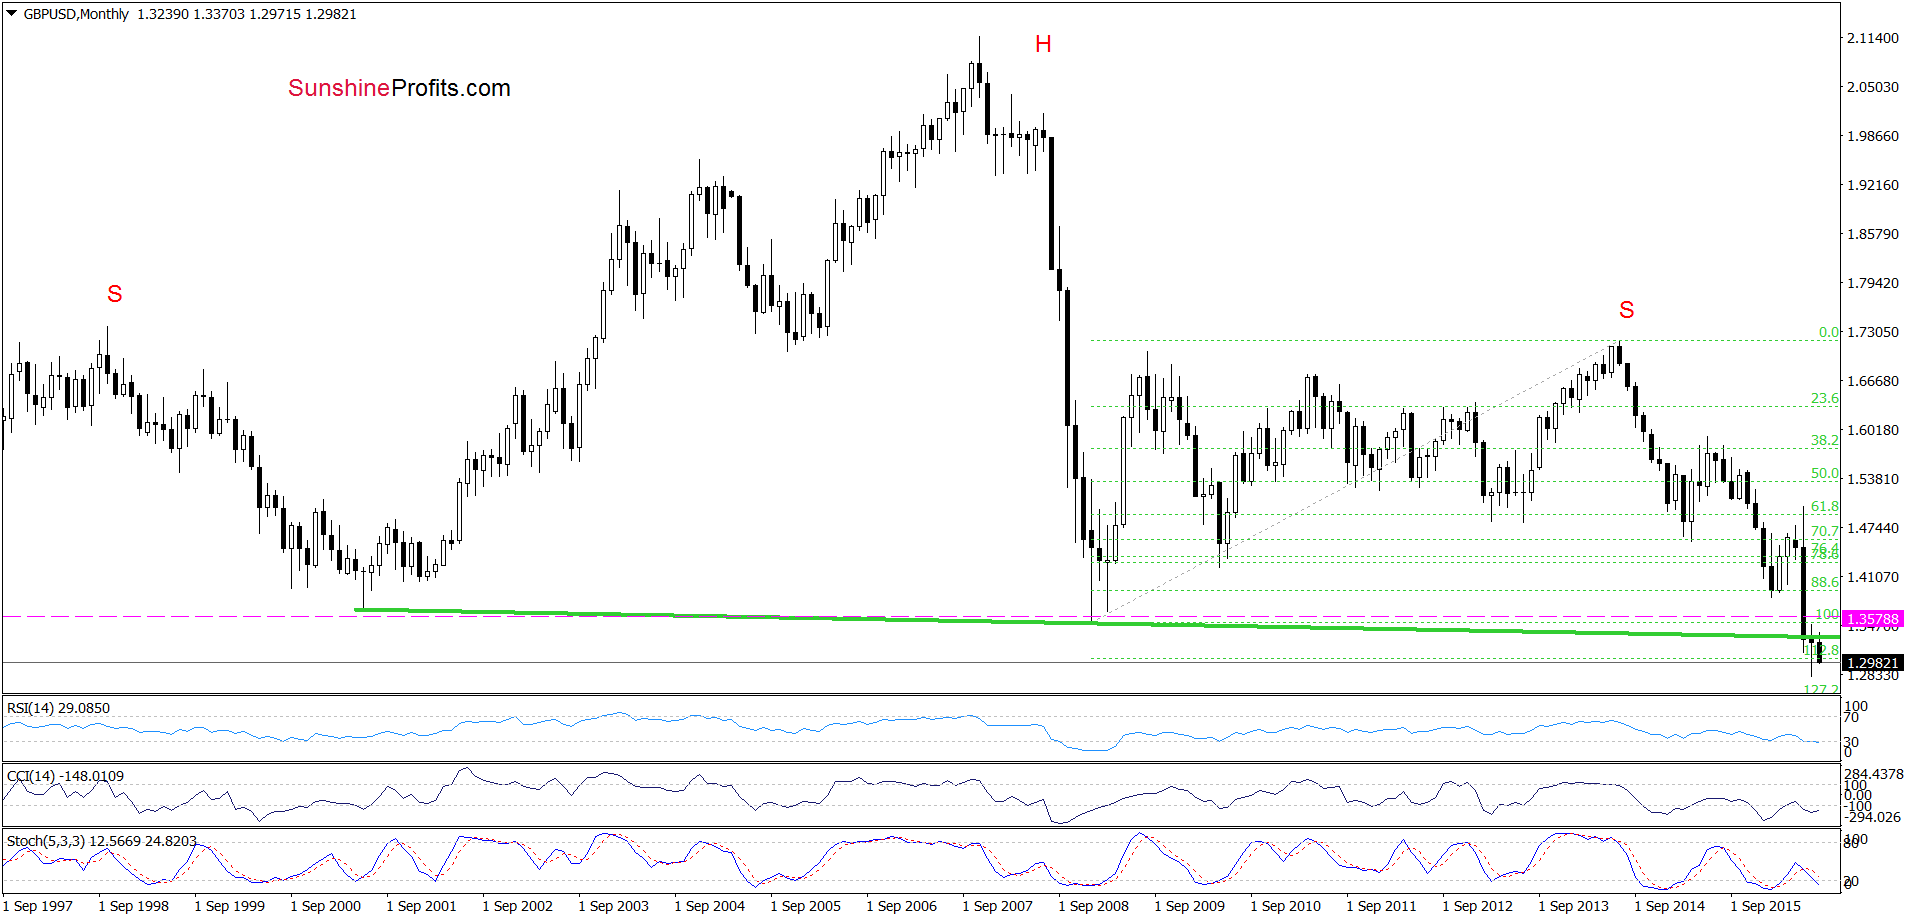
Looking at the above charts from the long- and medium-term perspective, we see that GBP/USD extended losses (although it is still trading in the blue consolidation) under the lower border of the red declining trend channel and the neck line of the head and shoulders formation, which is a negative signal that suggests further deterioration.
How low could the exchange rate go in the coming days? Let’s examine the very short-term chart and find out.
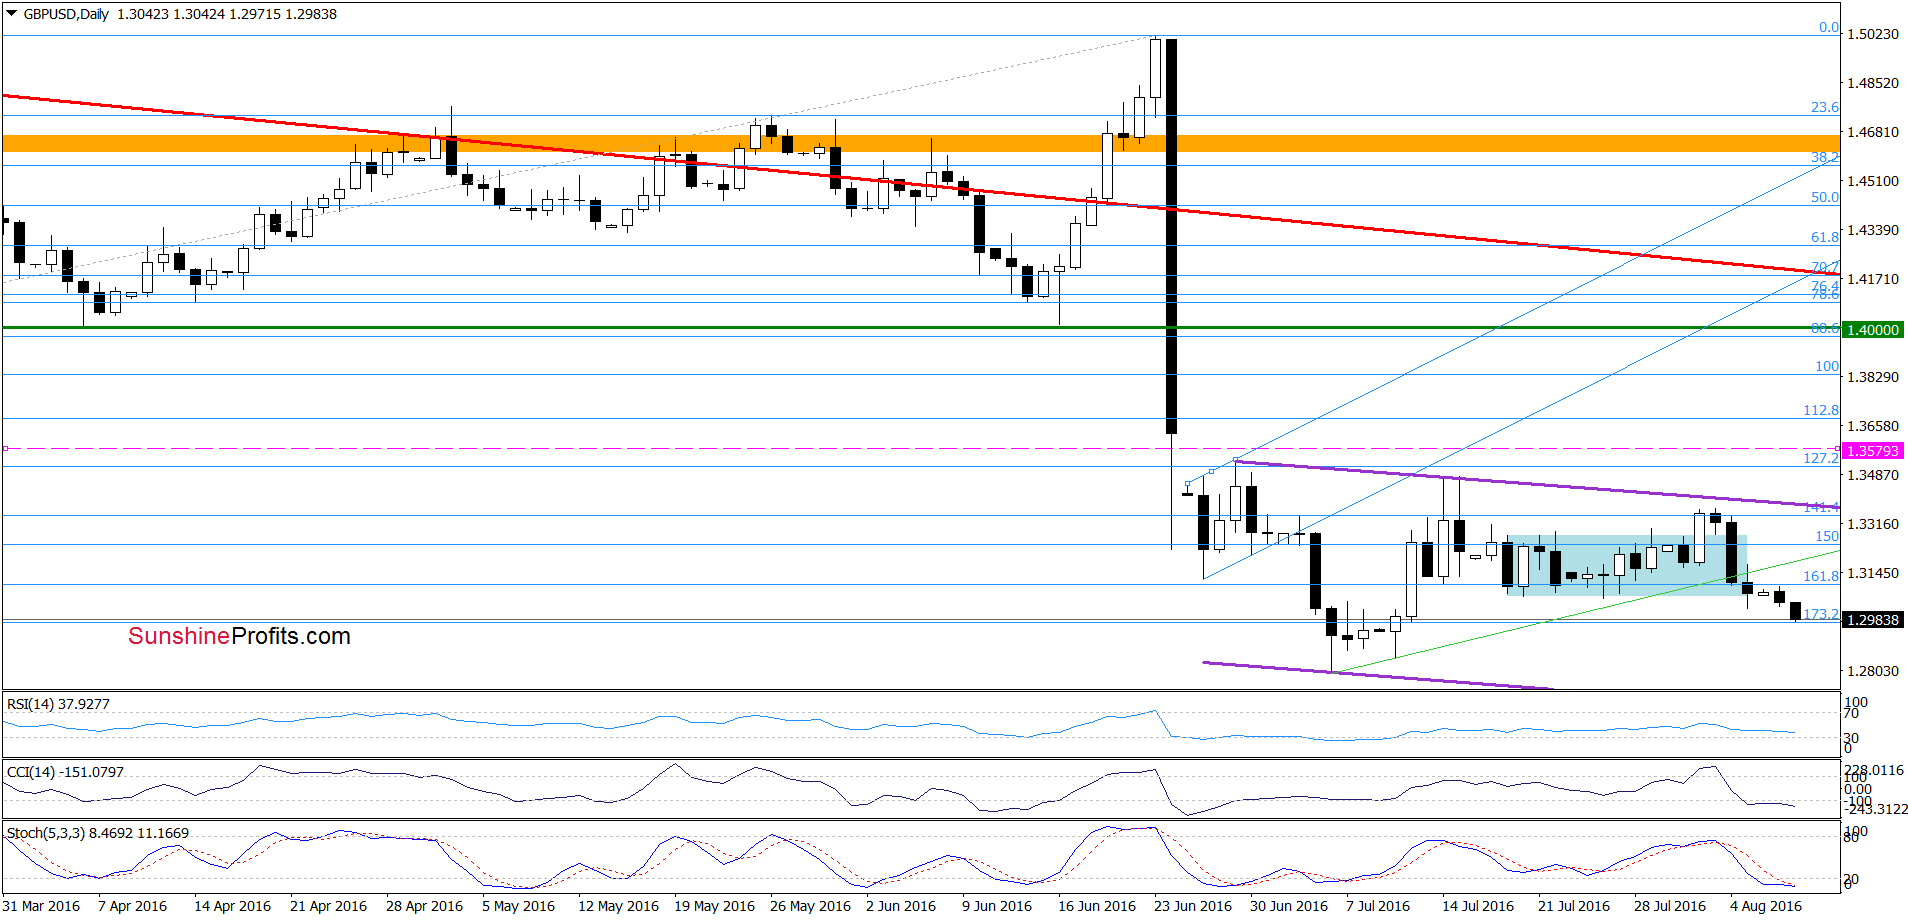
Yesterday, we wrote the following:
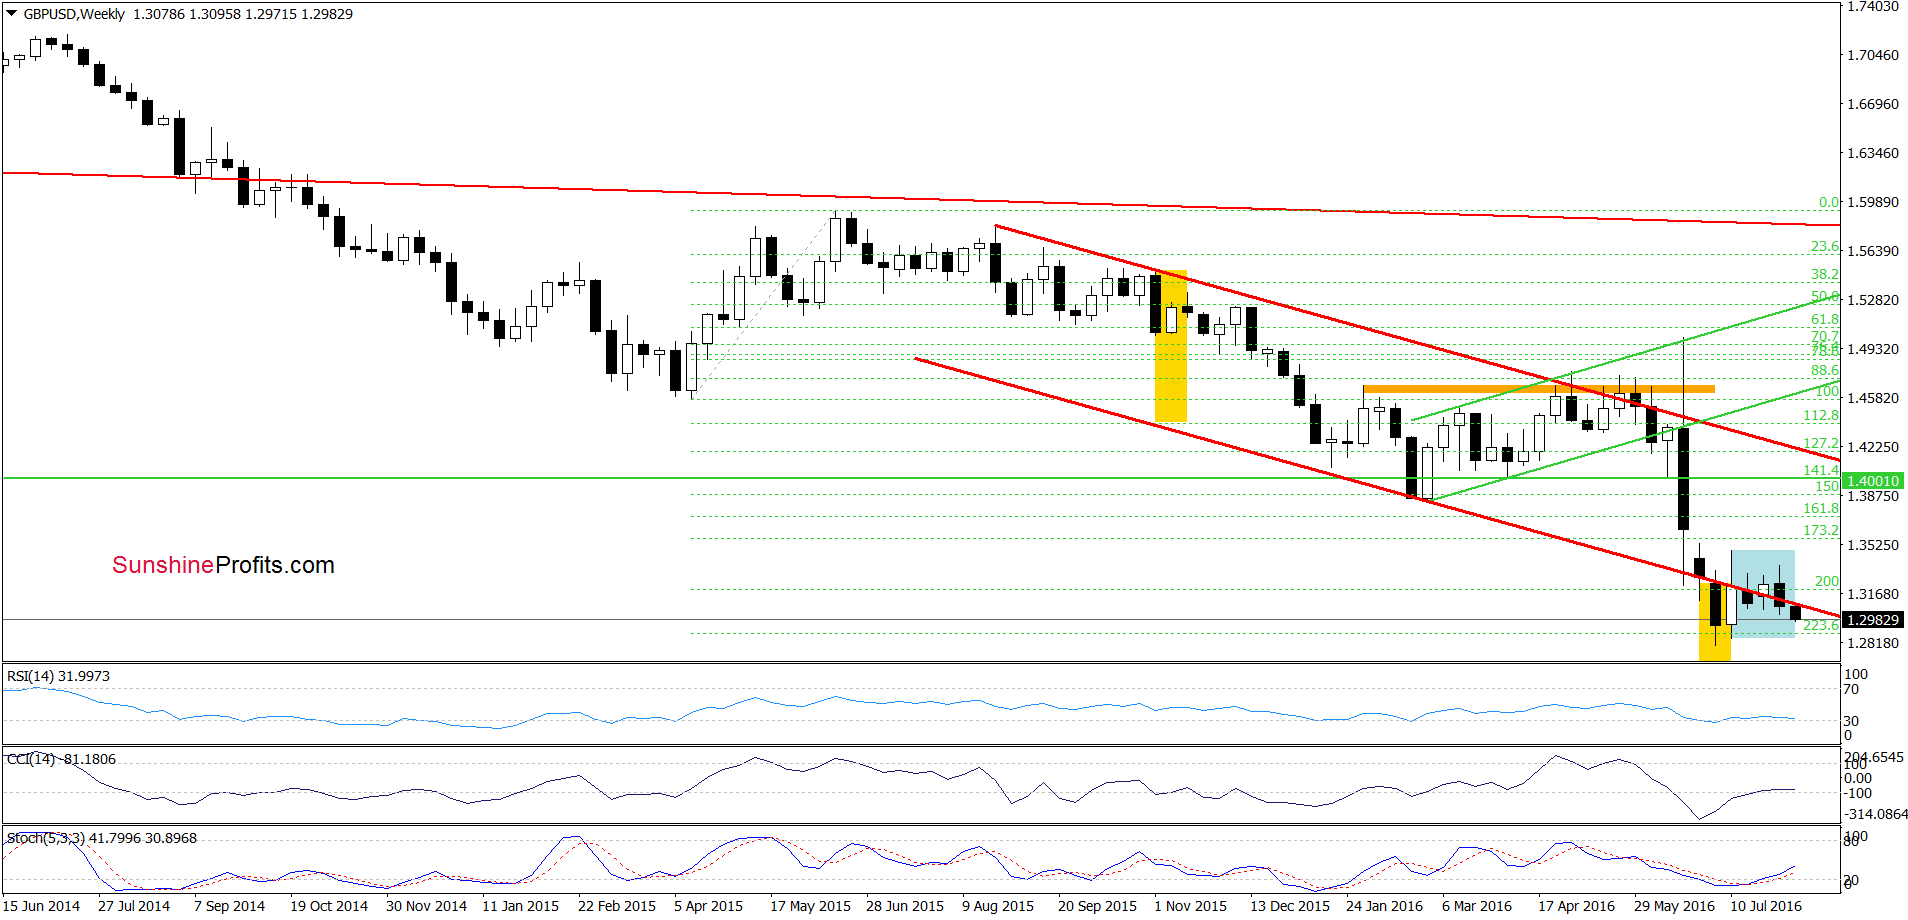
(…) GBP/USD declined not only below the green support line, but also reached the lower border of the blue consolidation. Although the exchange rate may rebound from here in the coming day(s), we believe that negative image that emerges from the long- and medium-term perspective will trigger another move to the downside in near future. If this is the case, and GBP/USD declines from current levels, we’ll see (at least) a test of the Jul lows.
As you see on the daily chart, currency bears pushed GBP/USD lower earlier today (in line with our yesterdays assumptions), which resulted in a visibly decrease below the lower border of the blue consolidation. Taking this fact into account and combining it with the long- and medium-term pictures, we believe that our yesterday’s target will be in play in the coming day(s).
Very short-term outlook: bearish
Short-term outlook: bearish
MT outlook: bearish
LT outlook: bearish
Trading position (short-term; our opinion): Short positions (with a stop-loss at 1.3579 and the initial downside target at 1.2519) are justified from the risk/reward perspective at the moment. We will keep you informed should anything change, or should we see a confirmation/invalidation of the above.
AUD/USD
Quoting our previous alert:
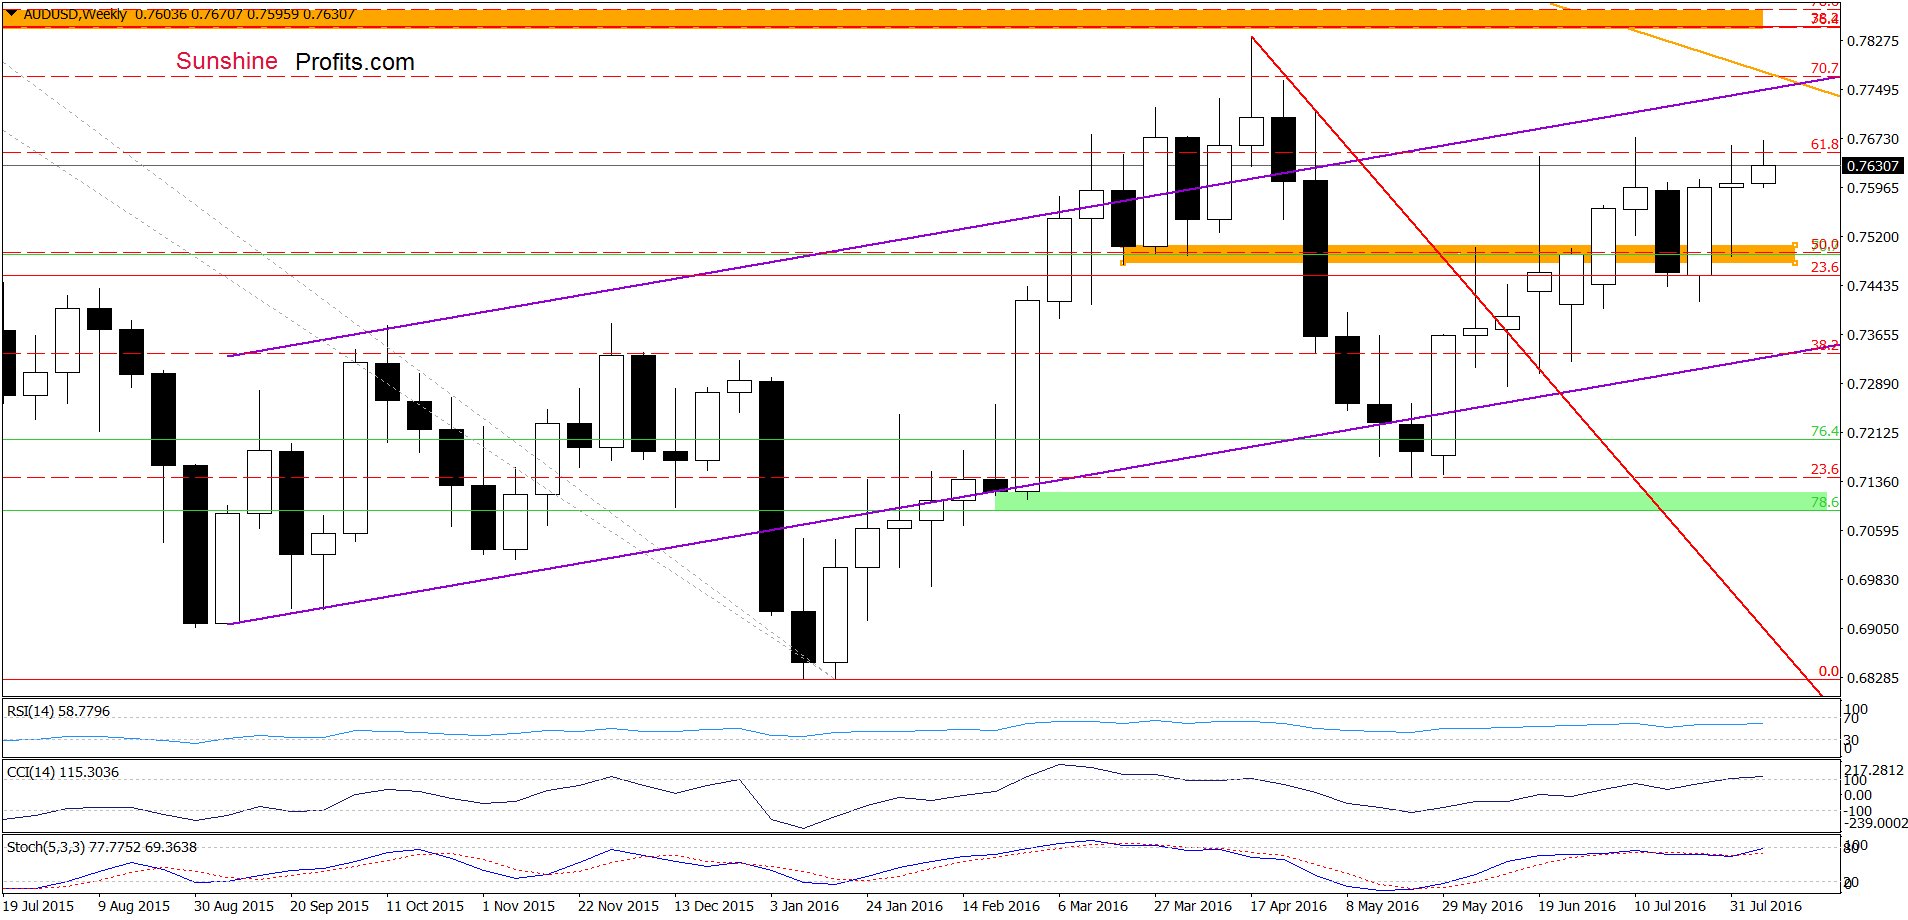
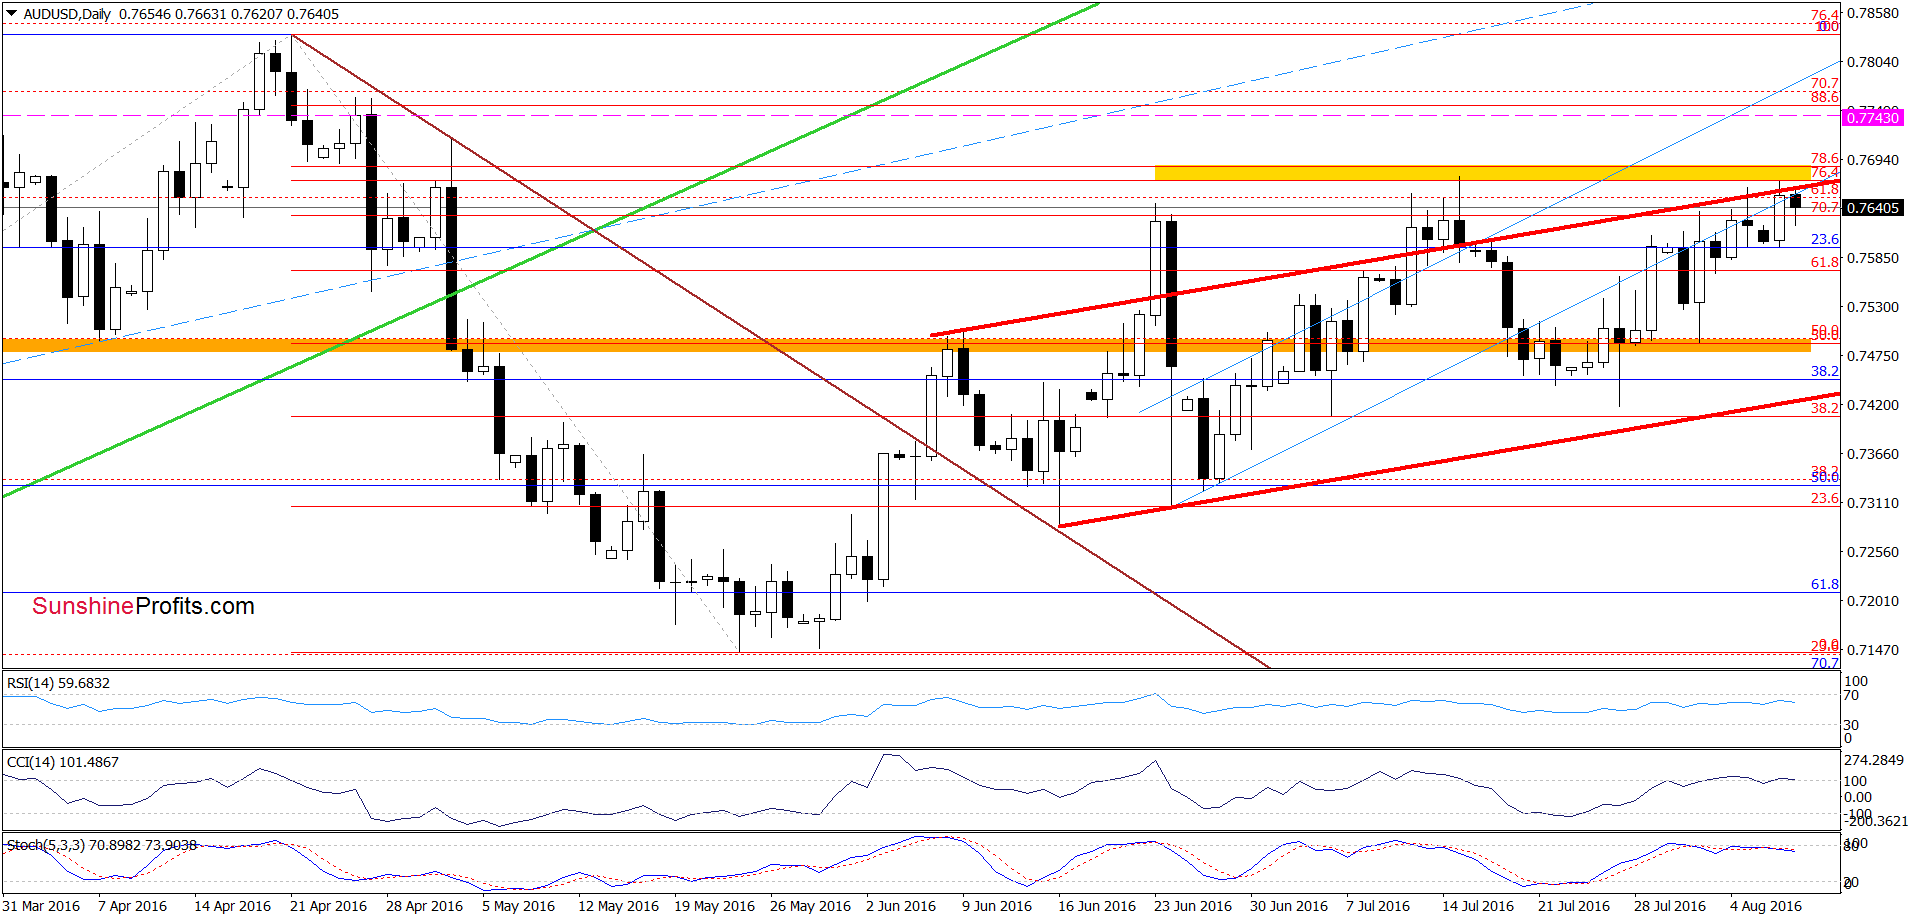
(…) the upper border of the red rising trend channel in combination with the 70.7% Fibonacci retracement stopped currency bulls on Friday, triggering a pullback. Despite this drop, AUD/USD rebounded earlier today, which may be a verification of the breakdown. Additionally, the current position of daily and weekly indicators suggests that lower values of the exchange rate are just around the corner. Therefore, if currency bulls fail to push AUD/USD above the yellow resistance zone, we’ll see reversal and declines in the coming week. In this case, the initial downside target would be the orange zone once again, which serves as the nearest support at the moment.
From today’s perspective, we see that the situation developed in line with the above scenario and AUD/USD reversed and declined earlier today after unsuccessful attempt to break above the yellow resistance zone. As you see on the daily chart, this solid resistance area stopped currency bulls in mid-Jul and also in the previous week, which suggests that history will repeat itself once again and we’ll see lower values of AUD/USD and re-test of the orange zone in the coming days.
Very short-term outlook: bearish
Short-term outlook: mixed with bearish bias
MT outlook: mixed
LT outlook: mixed
Trading position (short-term; our opinion): Short positions (with a stop-loss at 0.7743 and the initial downside target at 0.7490) are justified from the risk/reward perspective. We will keep you informed should anything change, or should we see a confirmation/invalidation of the above.
Thank you.
Nadia Simmons
Forex & Oil Trading Strategist
Przemyslaw Radomski, CFA
Founder, Editor-in-chief
Gold & Silver Trading Alerts
Forex Trading Alerts
Oil Investment Updates
Oil Trading Alerts

