

Earlier today, the U.S. dollar moved sharply higher against the yen after reports from Japanese media suggested that Prime Minister Shinzo Abe and his government will elaborate a fiscal stimulus package bigger than expected. Thanks to these circumstances, USD/JPY bounced off yesterday’s lows and climbed above 105. Will this increase be sustainable and we’ll see higher values of the exchange rate in the coming days?
In our opinion the following forex trading positions are justified - summary:
- EUR/USD: short (a stop-loss at 1.1236; initial downside target at 1.0708)
- GBP/USD: short (a stop-loss at 1.3579; initial downside target at 1.2519)
- USD/JPY: none
- USD/CAD: none
- USD/CHF: none
- AUD/USD: none
EUR/USD
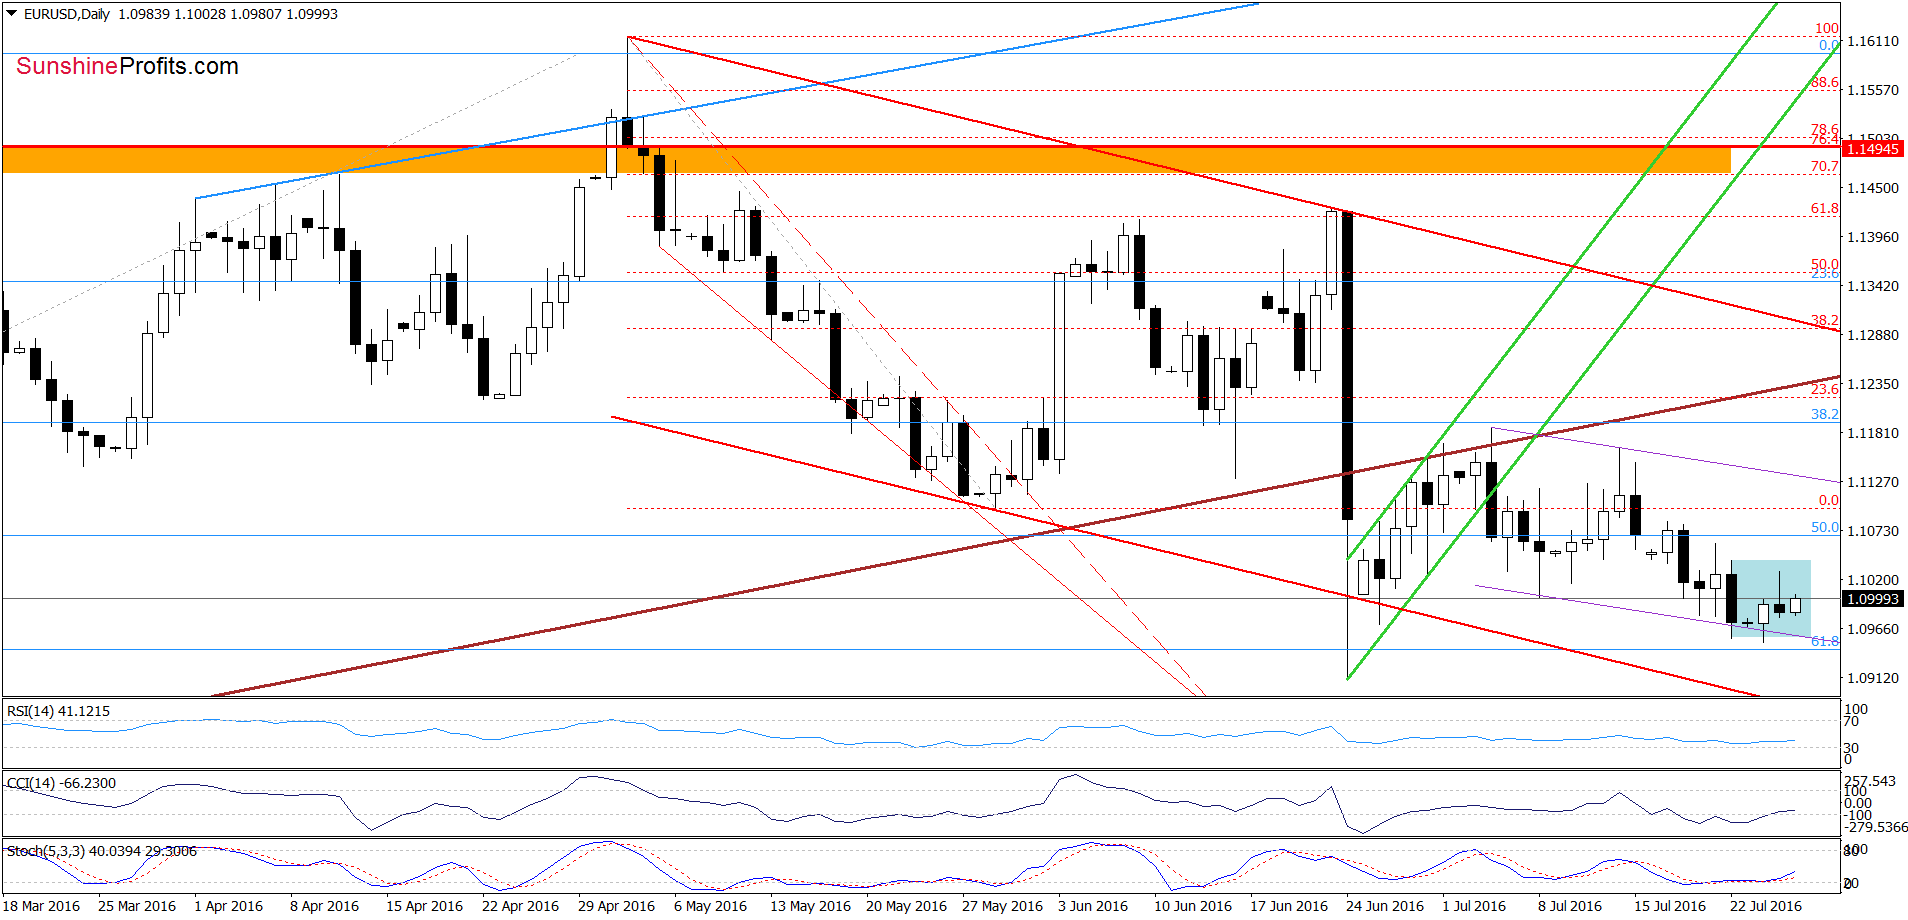
On the daily chart, we see that the situation in the very short term hasn’t changed much in recent days as EUR/USD is consolidating slightly above the lower border of the purple declining trend channel. Therefore, what we wrote about the medium- and long-term perspective yesterday remains up-to-date:
(…) the pair is still trading in a narrow range between the green support zone (created by the late Feb and early Mar lows and reinforced by the 70.7% Fibonacci retracement) and the previously-broken brown rising resistance line, which means that (…) another bigger move will be more likely if we see a breakdown under the green zone or invalidation of the breakdown under the brown line. Until this time short-lived moves in both directions should not surprise us.
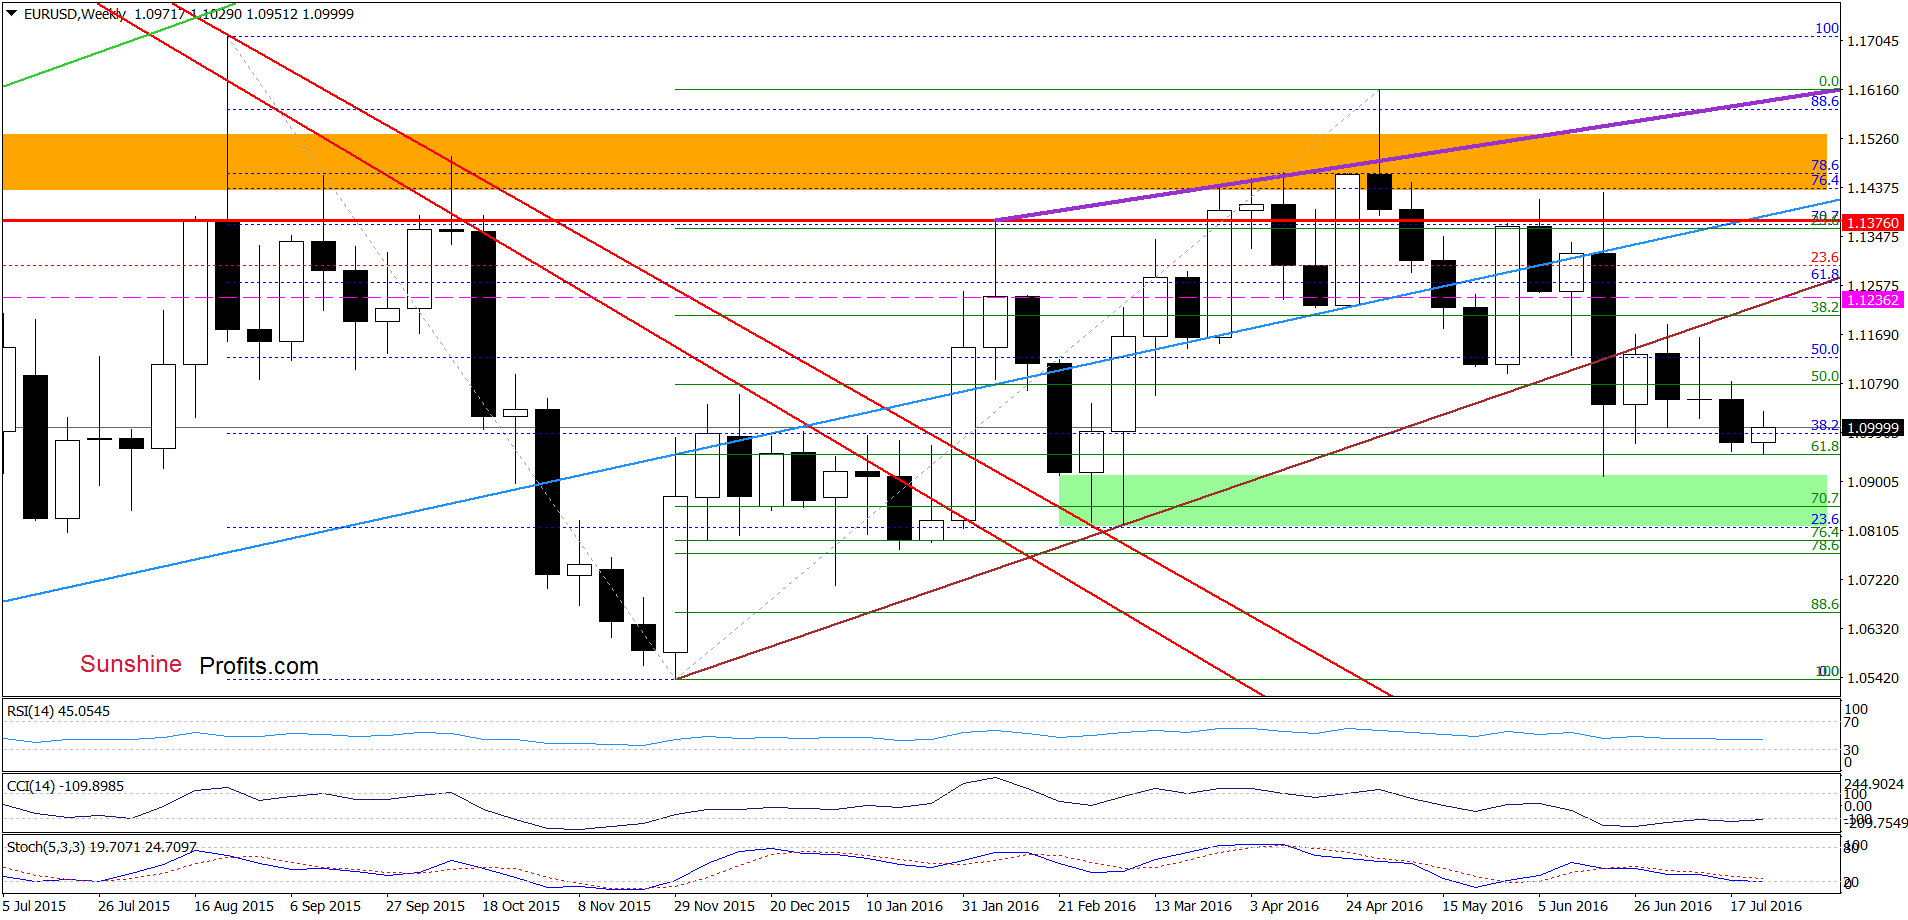
Nevertheless, the long-term picture below suggests that further declines are just a matter of time.
(…) sell signals generated by the indicators remain in place, supporting further deterioration and a re-test of the strength of the long-term green support line (currently around 1.0708) in the coming week(s).
Very short-term outlook: bearish
Short-term outlook: bearish
MT outlook: mixed with bearish bias
LT outlook: mixed
Trading position (short-term; our opinion): Short positions with a stop-loss order at 1.1236 and initial downside target at 1.0708 are justified from the risk/reward perspective. We will keep you informed should anything change, or should we see a confirmation/invalidation of the above.
USD/JPY
On Friday, we wrote the following:
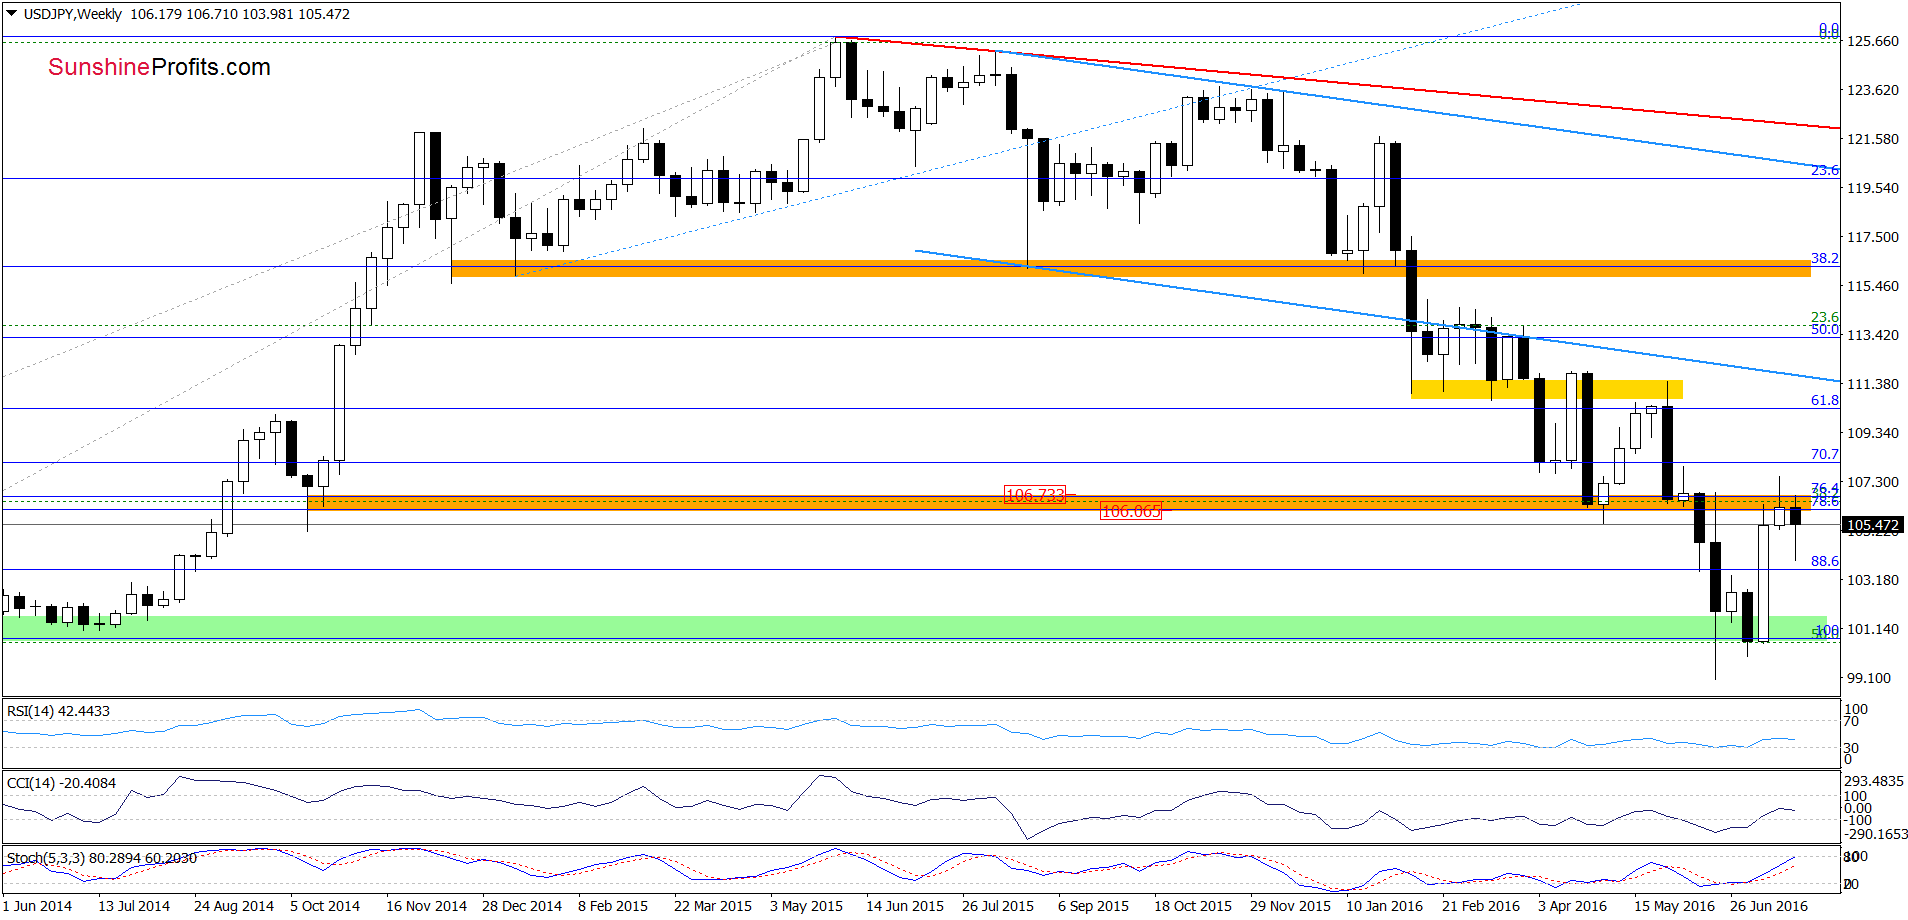
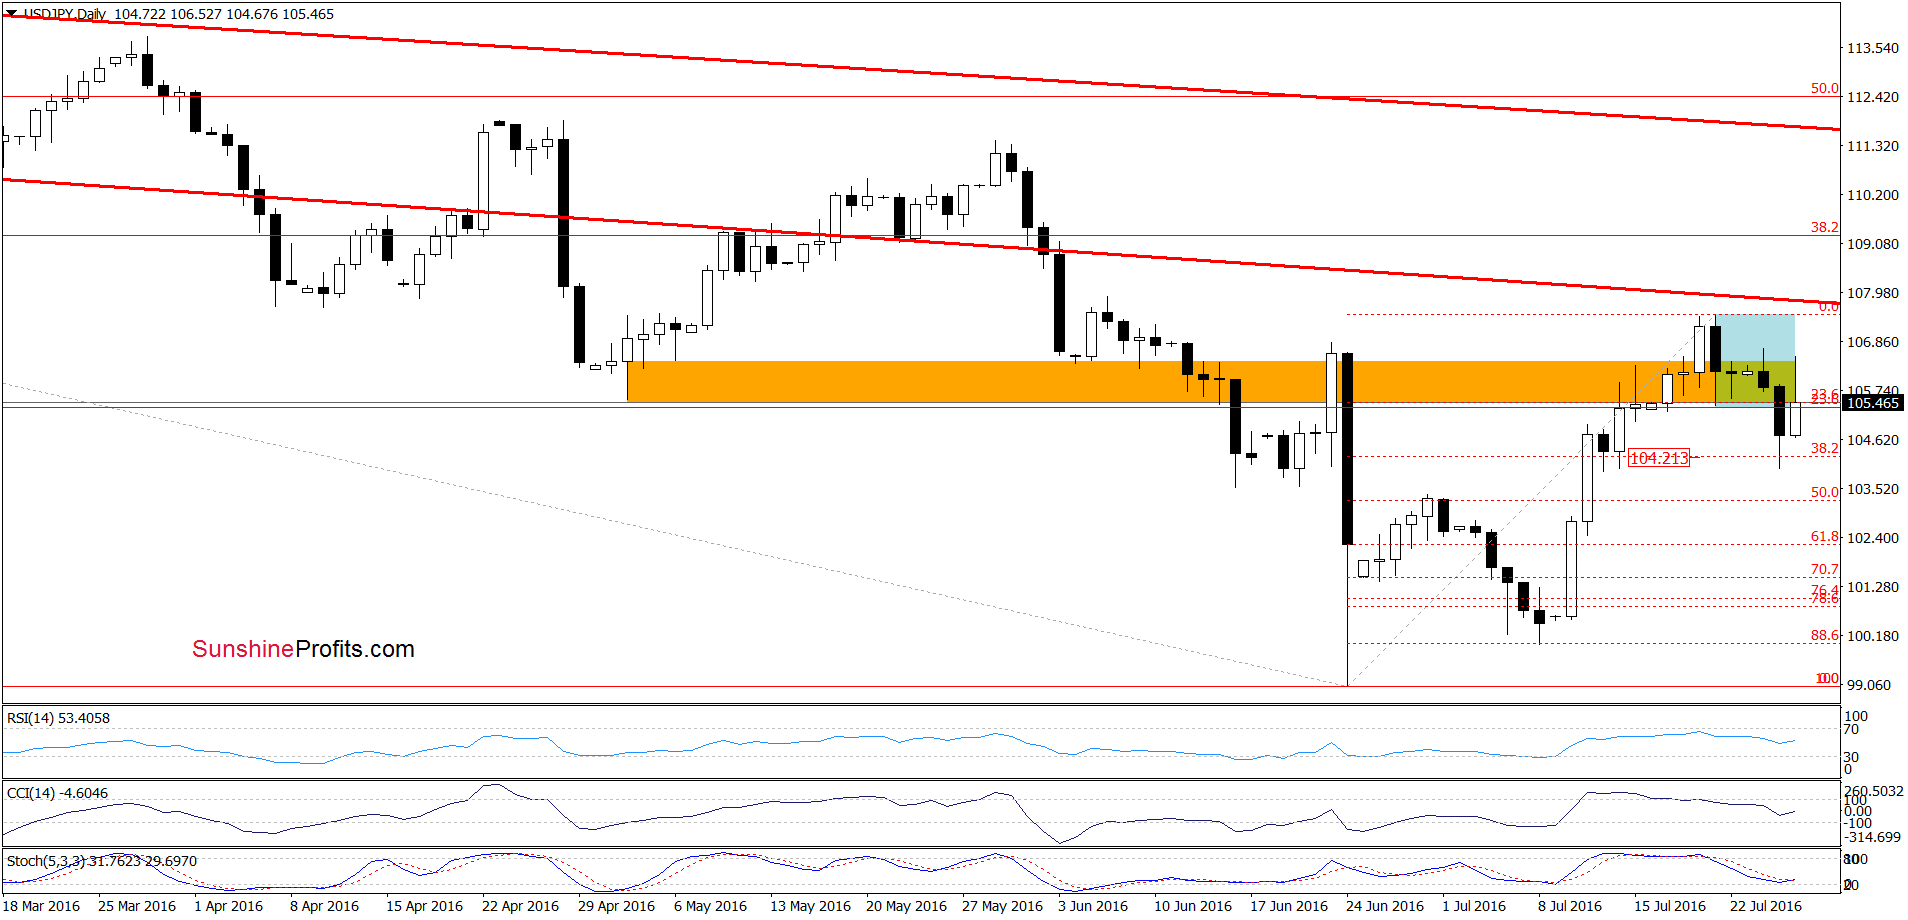
(…) Although the pair may rebound from here, the current position of the daily indicators suggests that further deterioration is just around the corner. However, in our opinion, such price action will be more likely and reliable if USD/JPY closes (…) session (…) under the orange zone. In this case, we’ll see further deterioration and the initial downside target would be around 104.2, where the 38.2% Fibonacci retracement (based on the Jun-Jul upward move) and mid- Jul lows are.
From today’s point of view, we see that the situation developed in line with the above scenario and USD/JPY reached our downside target. As you see, the 38.2% Fibonacci retracement encouraged currency bulls to act, which resulted in a rebound earlier today. Although this is a positive signal, we think that as long as there won’t be a daily closure above the orange resistance zone (invalidation of the breakdown below this area) all upswings may be nothing more than a verification of earlier breakdown (in this case, the pair will decline from current levels and USD/JPY will likely test yesterday’s low in the coming days). Nevertheless, please keep in mind that the current position of the Stochastic Oscillator (which is very close to generating a buy signal) suggests that another upswing may be just around the corner.
Very short-term outlook: mixed
Short-term outlook: mixed
MT outlook: mixed
LT outlook: mixed
Trading position (short-term; our opinion): No positions are justified from the risk/reward perspective at the moment. We will keep you informed should anything change, or should we see a confirmation/invalidation of the above.
AUD/USD
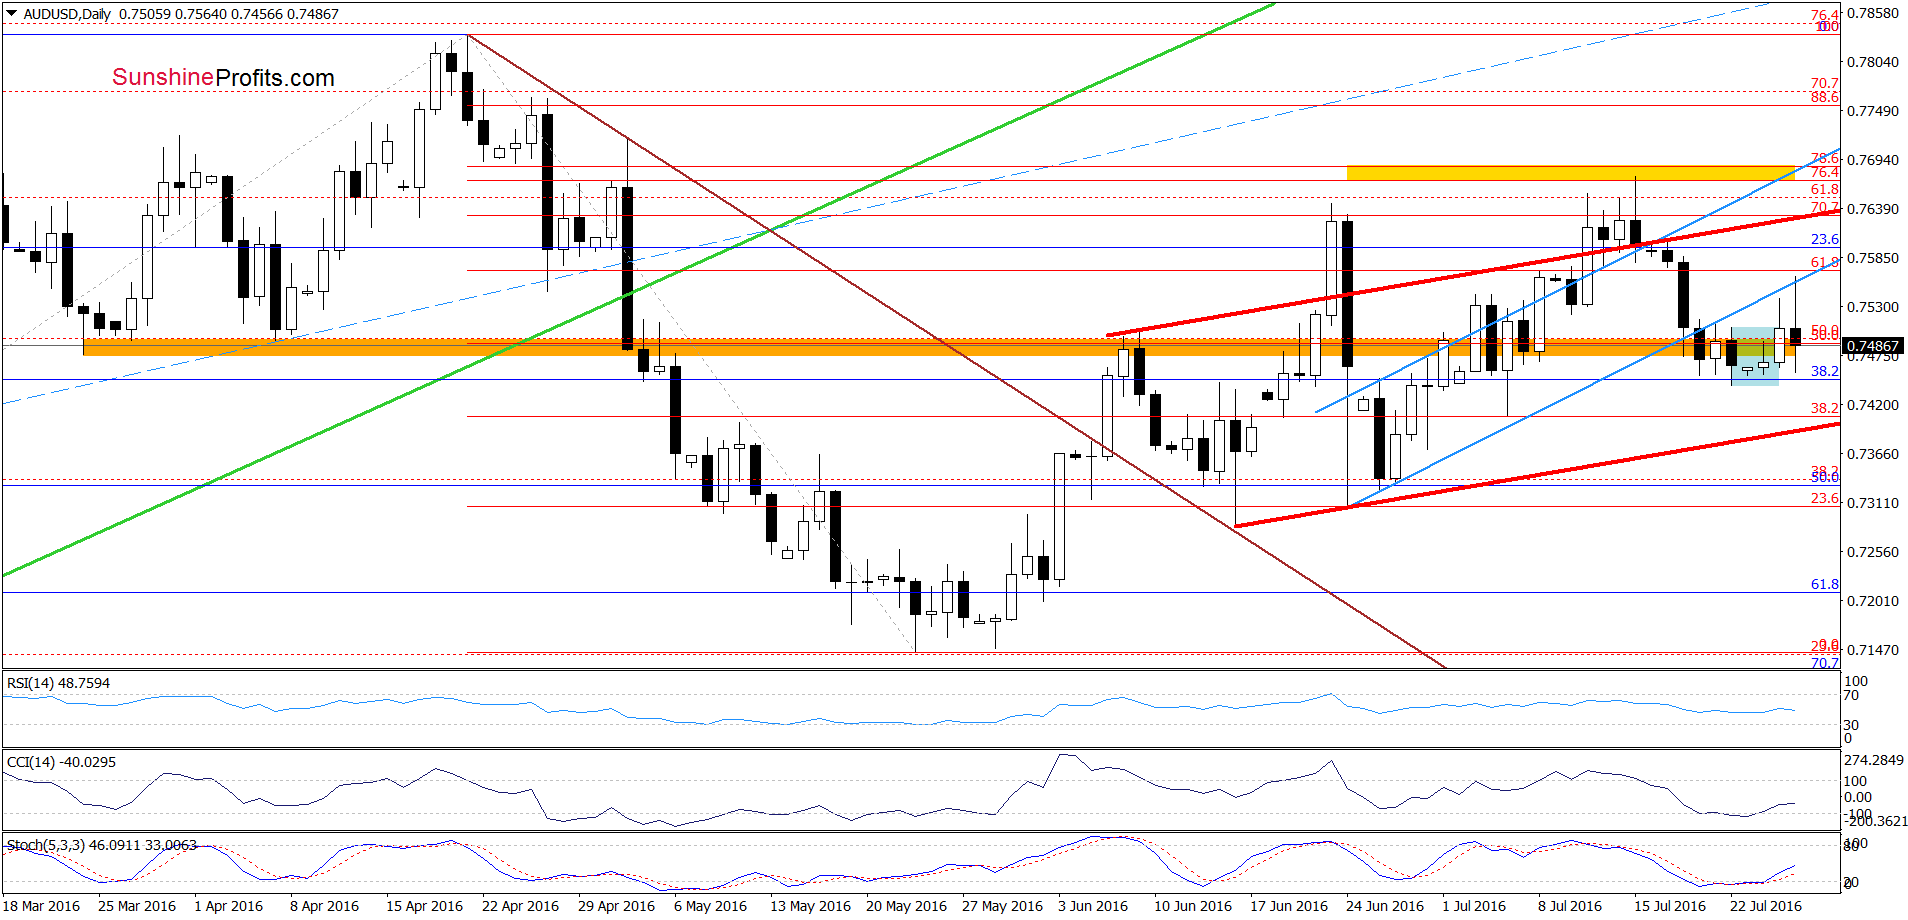
Looking at the daily chart, we see that although AUD/USD broke above the upper border of the blue consolidation, the previously-broken lower border of the blue rising trend channel stopped currency bulls, triggering a pullback earlier today. Such price action looks like a verification of a breakdown under the blue line and suggests a test f the recent lows in the coming day(s). If this support is broken, we, may see a drop to around 0.7393, where the red support line (based on the Jun lows) currently is.
Very short-term outlook: mixed with bearish bias
Short-term outlook: mixed
MT outlook: mixed
LT outlook: mixed
Trading position (short-term; our opinion): No positions are justified from the risk/reward perspective. We will keep you informed should anything change, or should we see a confirmation/invalidation of the above.
Thank you.
Nadia Simmons
Forex & Oil Trading Strategist
Przemyslaw Radomski, CFA
Founder, Editor-in-chief
Gold & Silver Trading Alerts
Forex Trading Alerts
Oil Investment Updates
Oil Trading Alerts

