

Yesterday, the greenback moved sharply higher against its Canadian counterpart as the price of crude oil slipped to the lowest level since late Apr, weighing on the Canadian currency. Thanks to these circumstances, USD/CAD broke above important resistance zone and closed the day above it. Will we see further rally in the coming days?
In our opinion the following forex trading positions are justified - summary:
- EUR/USD: short (a stop-loss at 1.1236; initial downside target at 1.0708)
- GBP/USD: short (a stop-loss at 1.3579; initial downside target at 1.2519)
- USD/JPY: none
- USD/CAD: none
- USD/CHF: none
- AUD/USD: none
EUR/USD
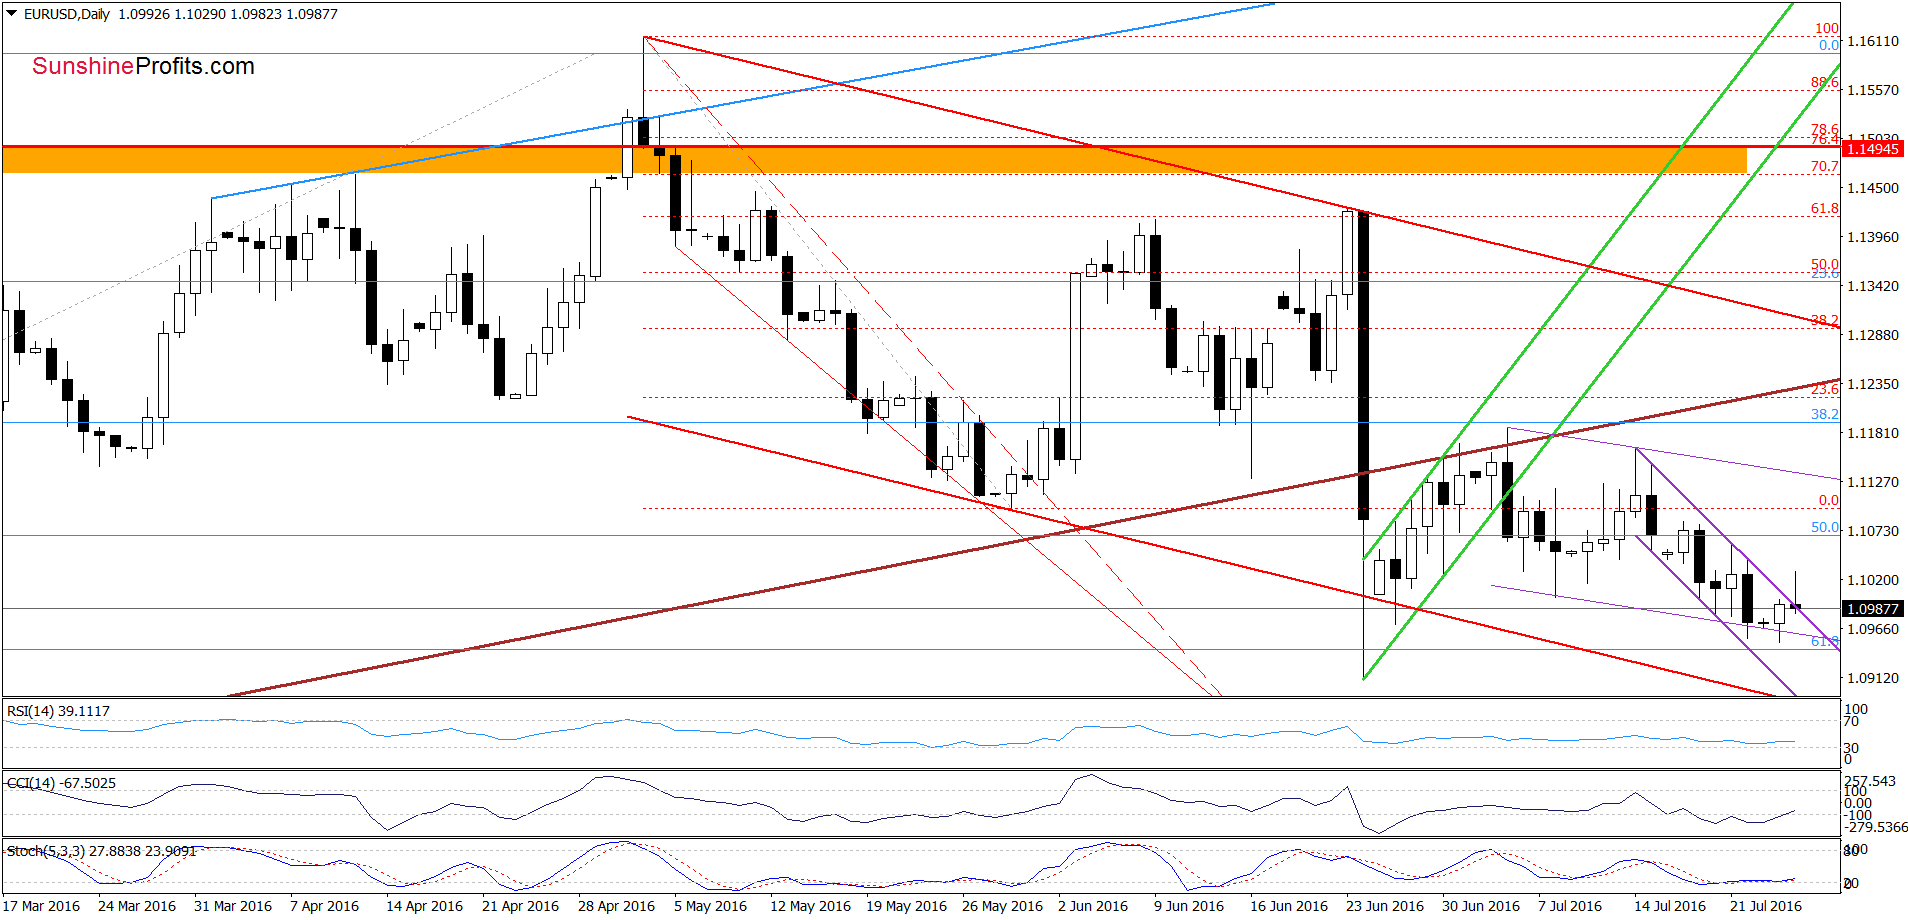
Looking at the daily chart, we see that although EUR/USD broke above the upper border of the purple declining trend channel earlier today, this improvement was temporary and the exchange rate reversed and declined, invalidating earlier breakout. This is a negative signal, which suggests further deterioration. However, this scenario will be more reliable if we see a daily closure under the upper line of the formation.
Having said the above, let’s check whether anything changed on the medium-term picture or not.
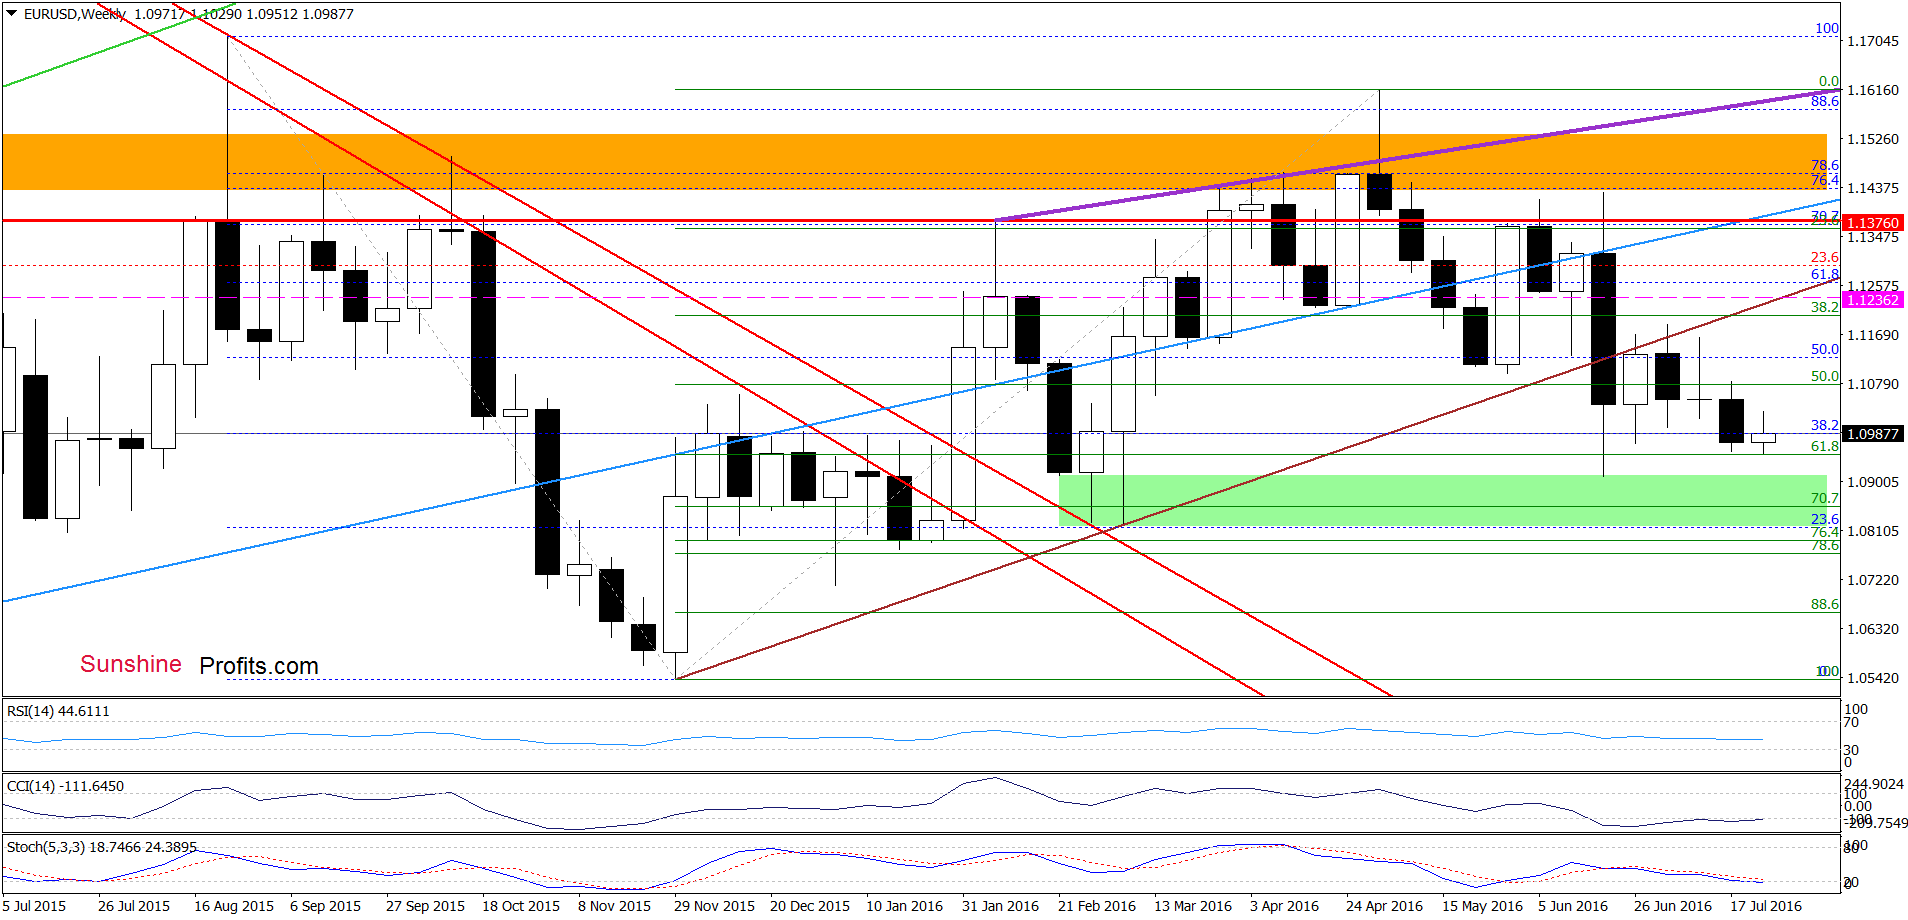
From this perspective, we see that the pair is still trading in a narrow range between the green support zone (created by the late Feb and early Mar lows and reinforced by the 70.7% Fibonacci retracement) and the previously-broken brown rising resistance line, which means that what we wrote yesterday is up-to-date:
(…) we think that another bigger move will be more likely if we see a breakdown under the green zone or invalidation of the breakdown under the brown line. Until this time short-lived moves in both directions should not surprise us.
Nevertheless, the long-term picture below suggests that further declines are just a matter of time. Why?
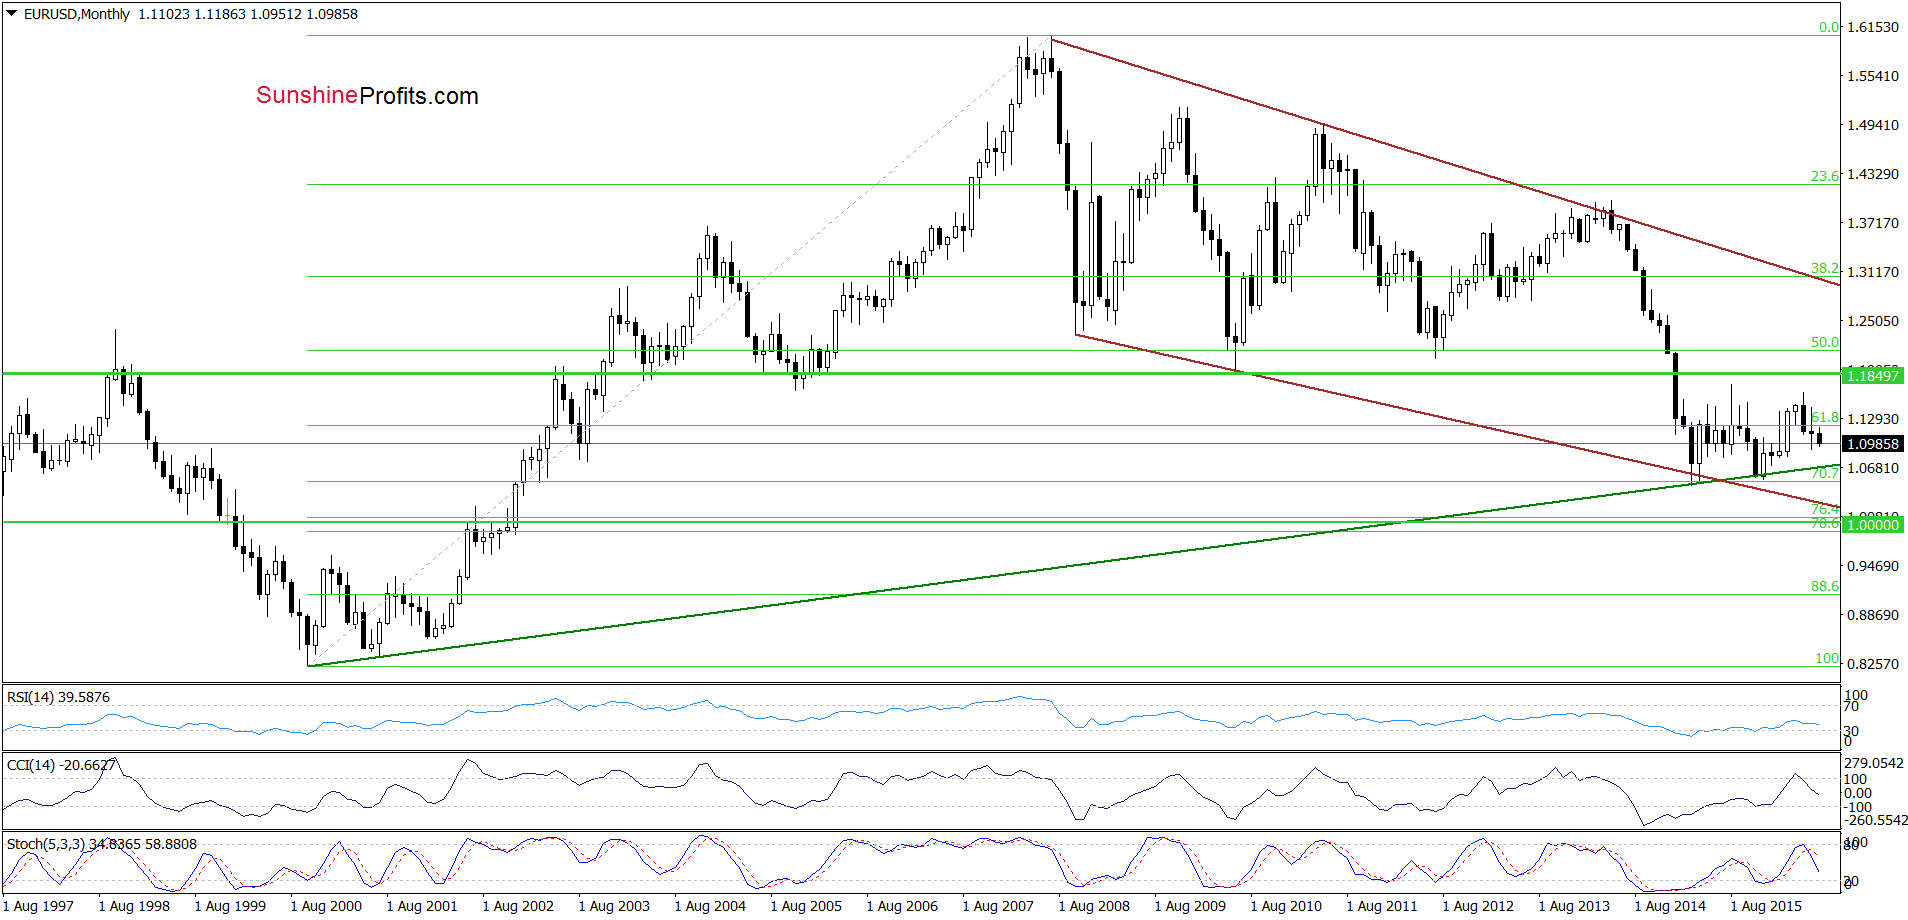
Because sell signals generated by the indicators remain in place, supporting further deterioration and a re-test of the strength of the long-term green support line (currently around 1.0708) in the coming week(s).
Very short-term outlook: bearish
Short-term outlook: bearish
MT outlook: mixed with bearish bias
LT outlook: mixed
Trading position (short-term; our opinion): Short positions with a stop-loss order at 1.1236 and initial downside target at 1.0708 are justified from the risk/reward perspective. We will keep you informed should anything change, or should we see a confirmation/invalidation of the above.
USD/CAD
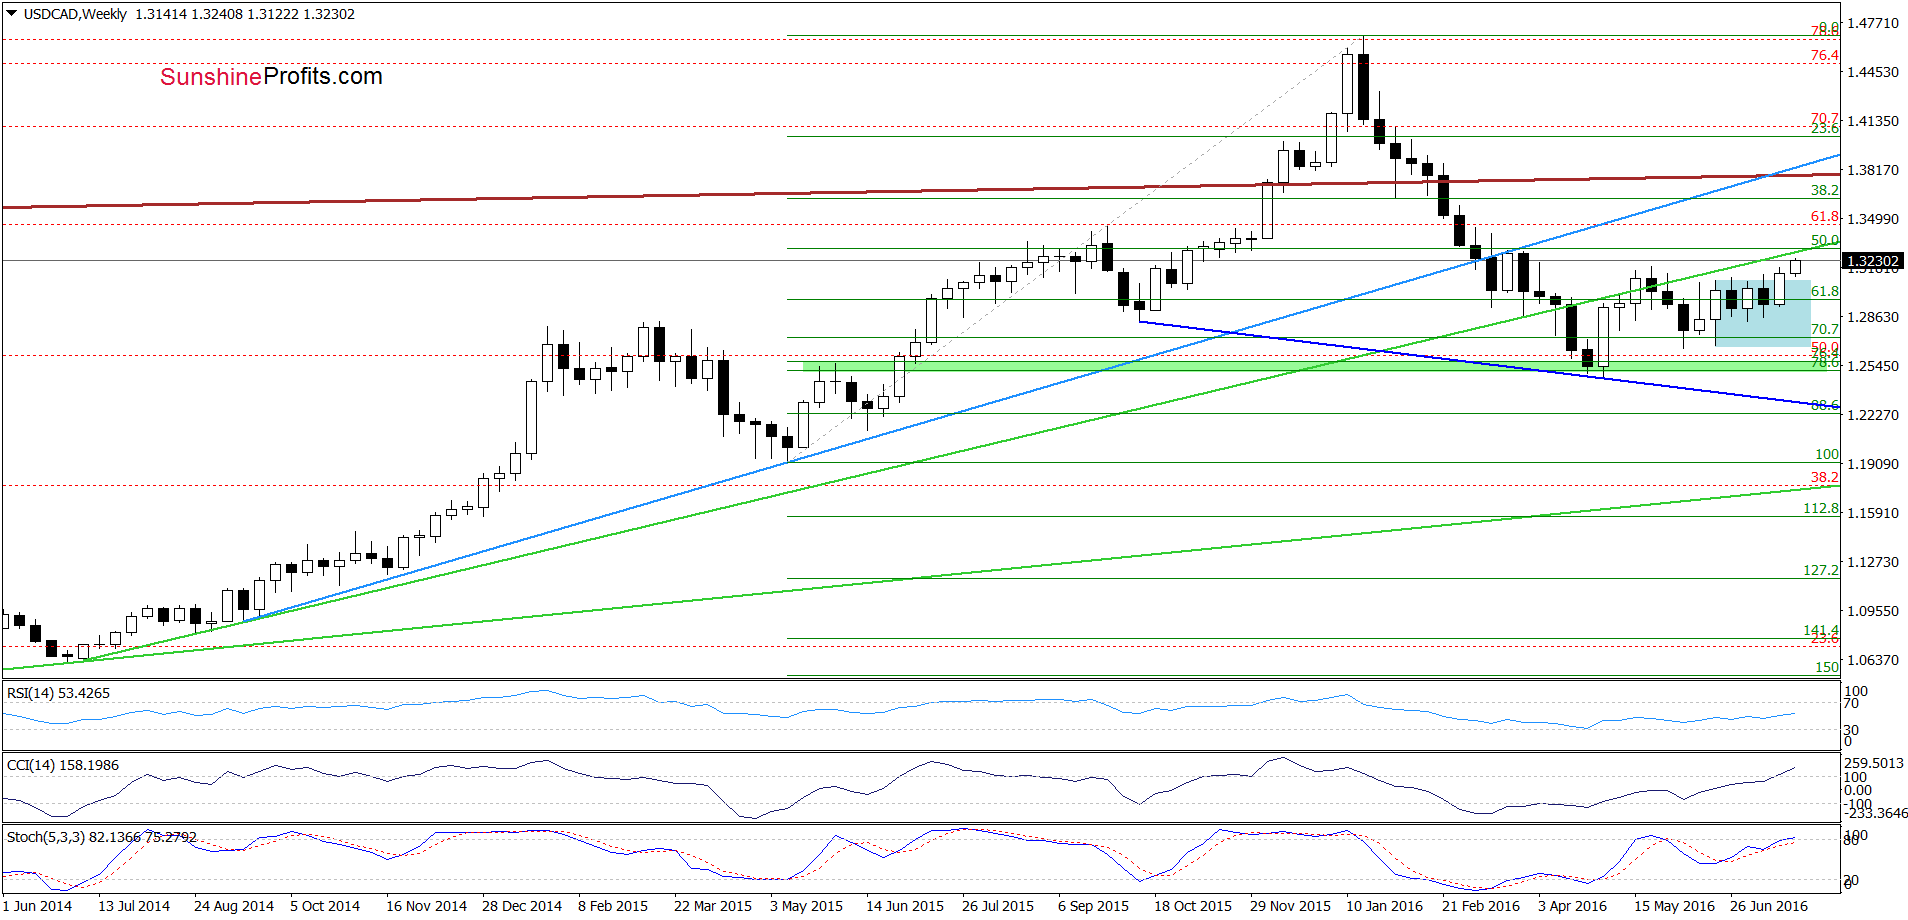
On the medium-term chart, we see that USD/CAD broke above the upper border of the consolidation, which is a positive signal that suggests further improvement and a test of the previously-broken green line (currently around 1.3272) in the coming week.
Are there any negative factors that could hinder the realization of the above scenario? Let’s examine the daily chart and find out.
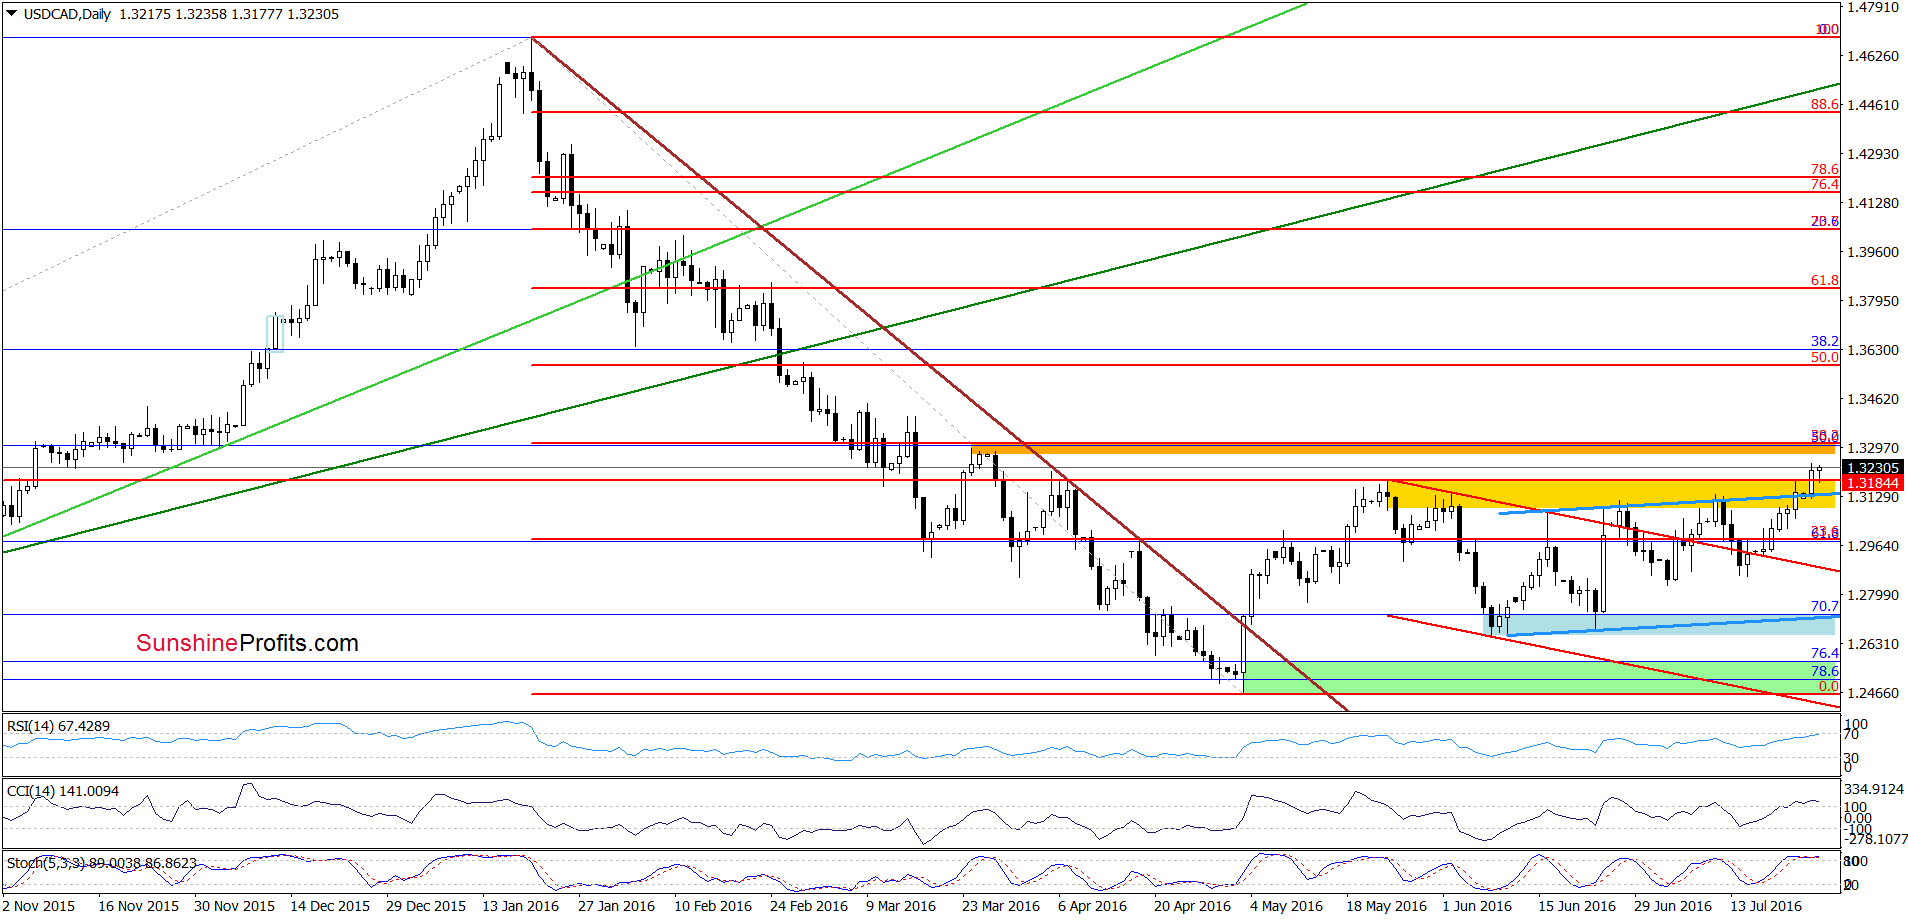
Looking at the daily chart, we see that USD/CAD finally broke above the yellow resistance zone and the upper border of the blue rising trend channel, which encouraged currency bulls to act. As a result, the exchange rate closed yesterday’s session above these resistances, which suggests further improvement and a climb to the orange resistance zone (created by the late Mar highs and the 38.2% Fibonacci retracement based on the entire Jan-May decline) in the coming days (around 1.3283-1.3315). Nevertheless, please keep in mind that the current position of the indicators suggests that the space for gains may be limited and reversal in the coming days can’t be ruled out – especially when we factor in the current picture of crude oil (if you would like to know more about the commodity we encourage you to read our yesterday’s Oil Trading Alert).
Very short-term outlook: mixed with bullish bias
Short-term outlook: mixed
MT outlook: mixed
LT outlook: mixed
Trading position (short-term; our opinion): No positions are justified from the risk/reward perspective. We will keep you informed should anything change, or should we see a confirmation/invalidation of the above.
USD/CHF
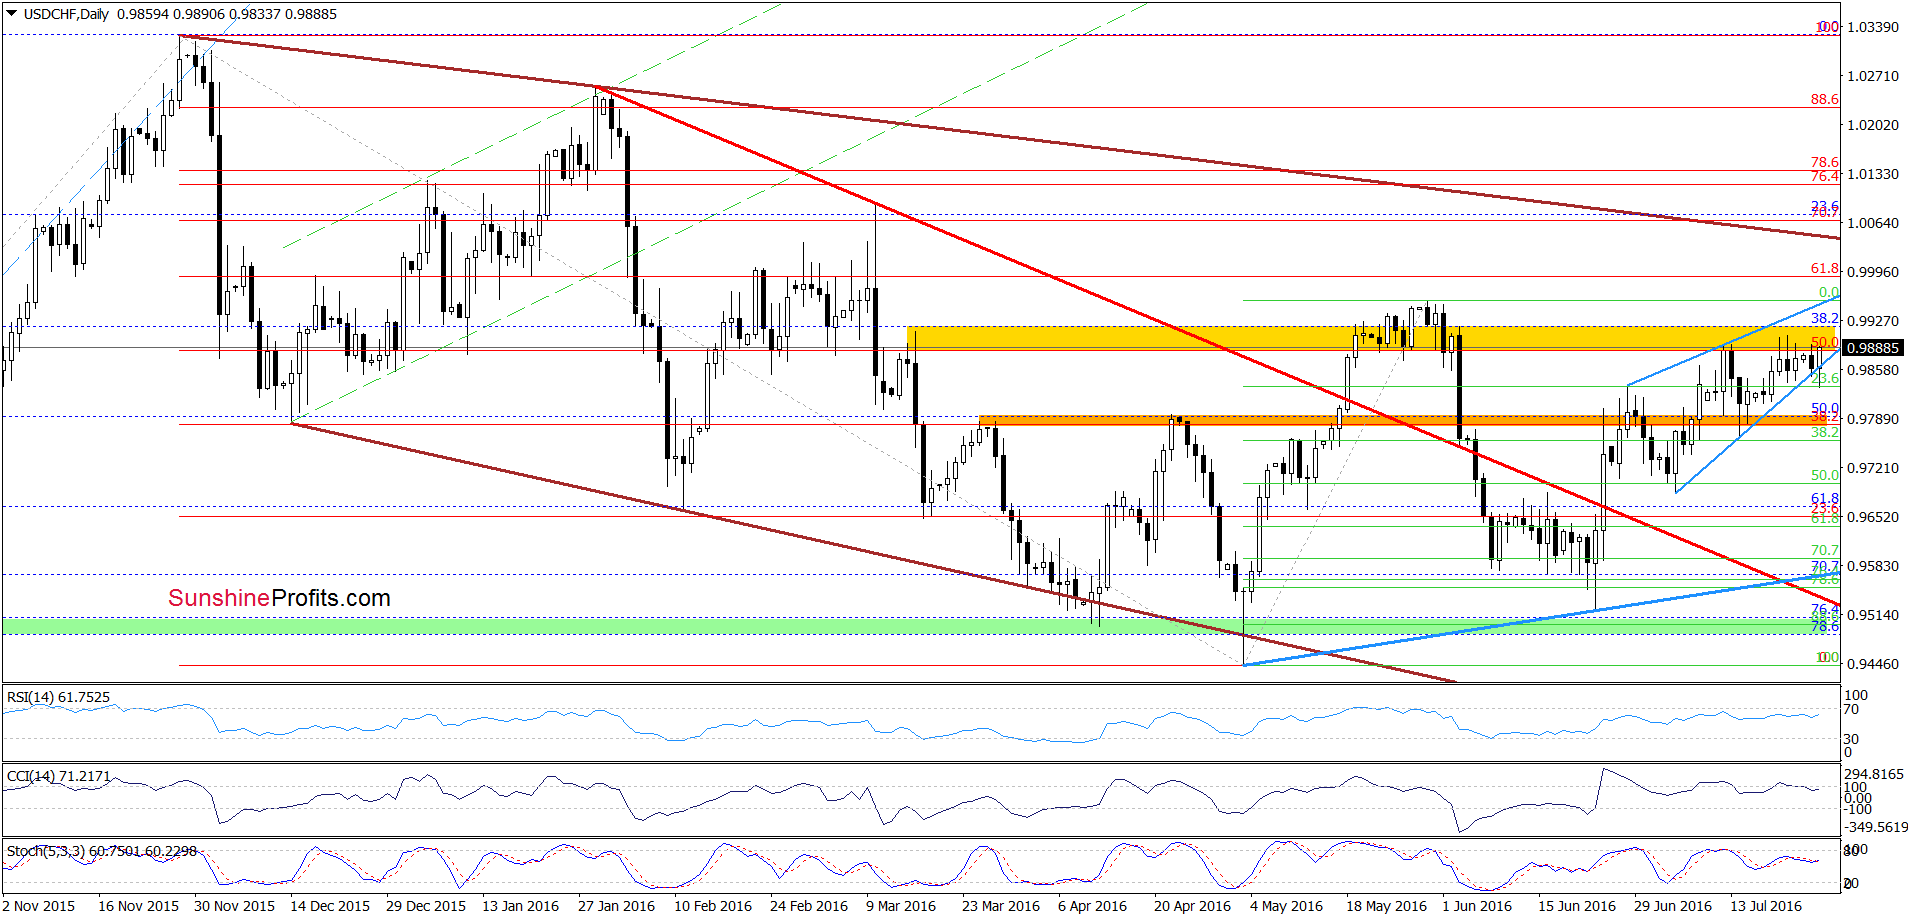
Looking at the daily chart, we see that although USD/CHF slipped under the lower border of the blue rising wedge, currency bulls managed to stop their opponents and push the exchange rate higher. As a result, the pair came back to the yellow resistance area once again. Taking these facts into account and combining them with a buy signal generated by the Stochastic Oscillator, it seems to us that currency bulls will try to push the exchange rate higher in the coming days. If this is the case, and the pair increases from here, we may see a test of the May and Jun highs. At this point it is also worth noting that in this area is also the upper border of the blue rising wedge, which could encourage currency bears to trigger a reversal and decline.
Very short-term outlook: mixed with bullish bias
Short-term outlook: mixed with bullish bias
MT outlook: mixed
LT outlook: mixed
Trading position (short-term; our opinion): No positions are justified from the risk/reward perspective. We will keep you informed should anything change, or should we see a confirmation/invalidation of the above.
Thank you.
Nadia Simmons
Forex & Oil Trading Strategist
Przemyslaw Radomski, CFA
Founder, Editor-in-chief
Gold & Silver Trading Alerts
Forex Trading Alerts
Oil Investment Updates
Oil Trading Alerts

