

Earlier today, the British pound extended losses against the U.S. dollar after remarks by the Bank of England. In this environment, GBP/USD hit a fresh multi-year low and declined under key support lines. What does it mean for the exchange rate?
In our opinion the following forex trading positions are justified - summary:
- EUR/USD: none
- GBP/USD: short (a stop-loss at 1.3579; initial downside target at 1.2519)
- USD/JPY: none
- USD/CAD: none
- USD/CHF: none
- AUD/USD: none
EUR/USD
On Friday, we wrote the following:
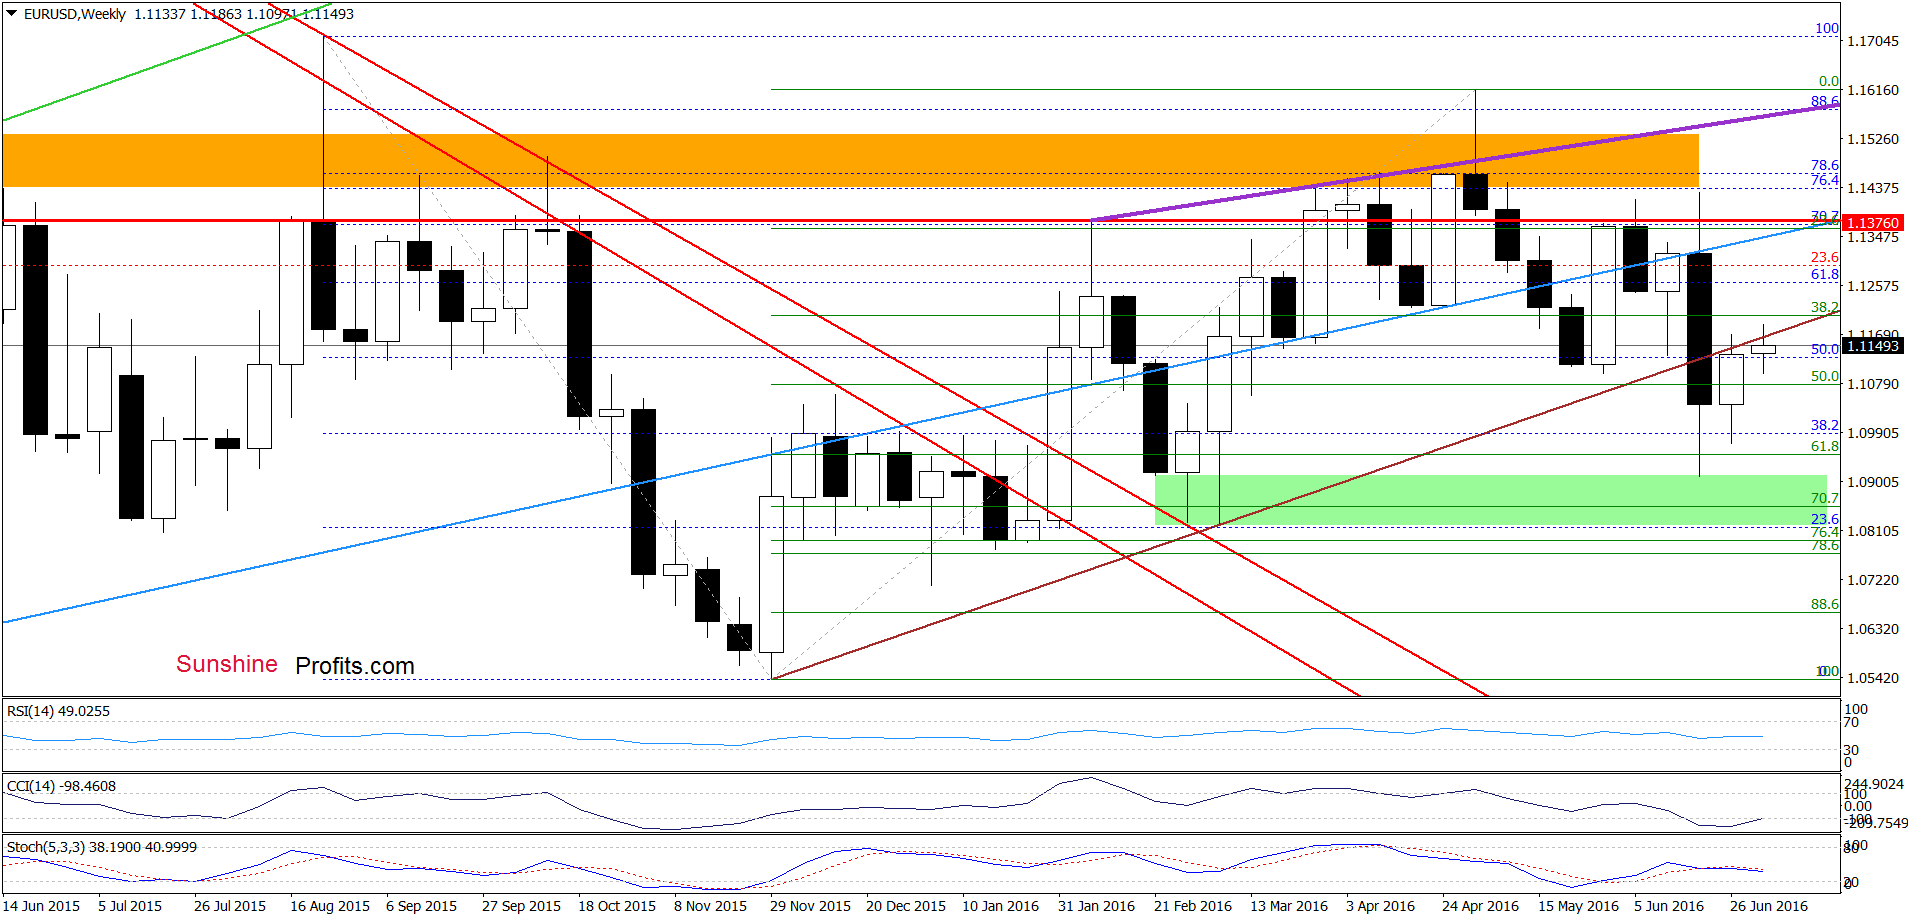
(…) EUR/USD rebounded, closing yesterday’s session inside the trend channel. In this way, the pair invalidated earlier small breakdown, which is a positive signal that suggests further improvement – especially when we factor in buy signals generated by the indicators. Nevertheless, we still believe that as long as there won’t be breakout above the long-term brown resistance line another bigger upward move is not likely to be seen.
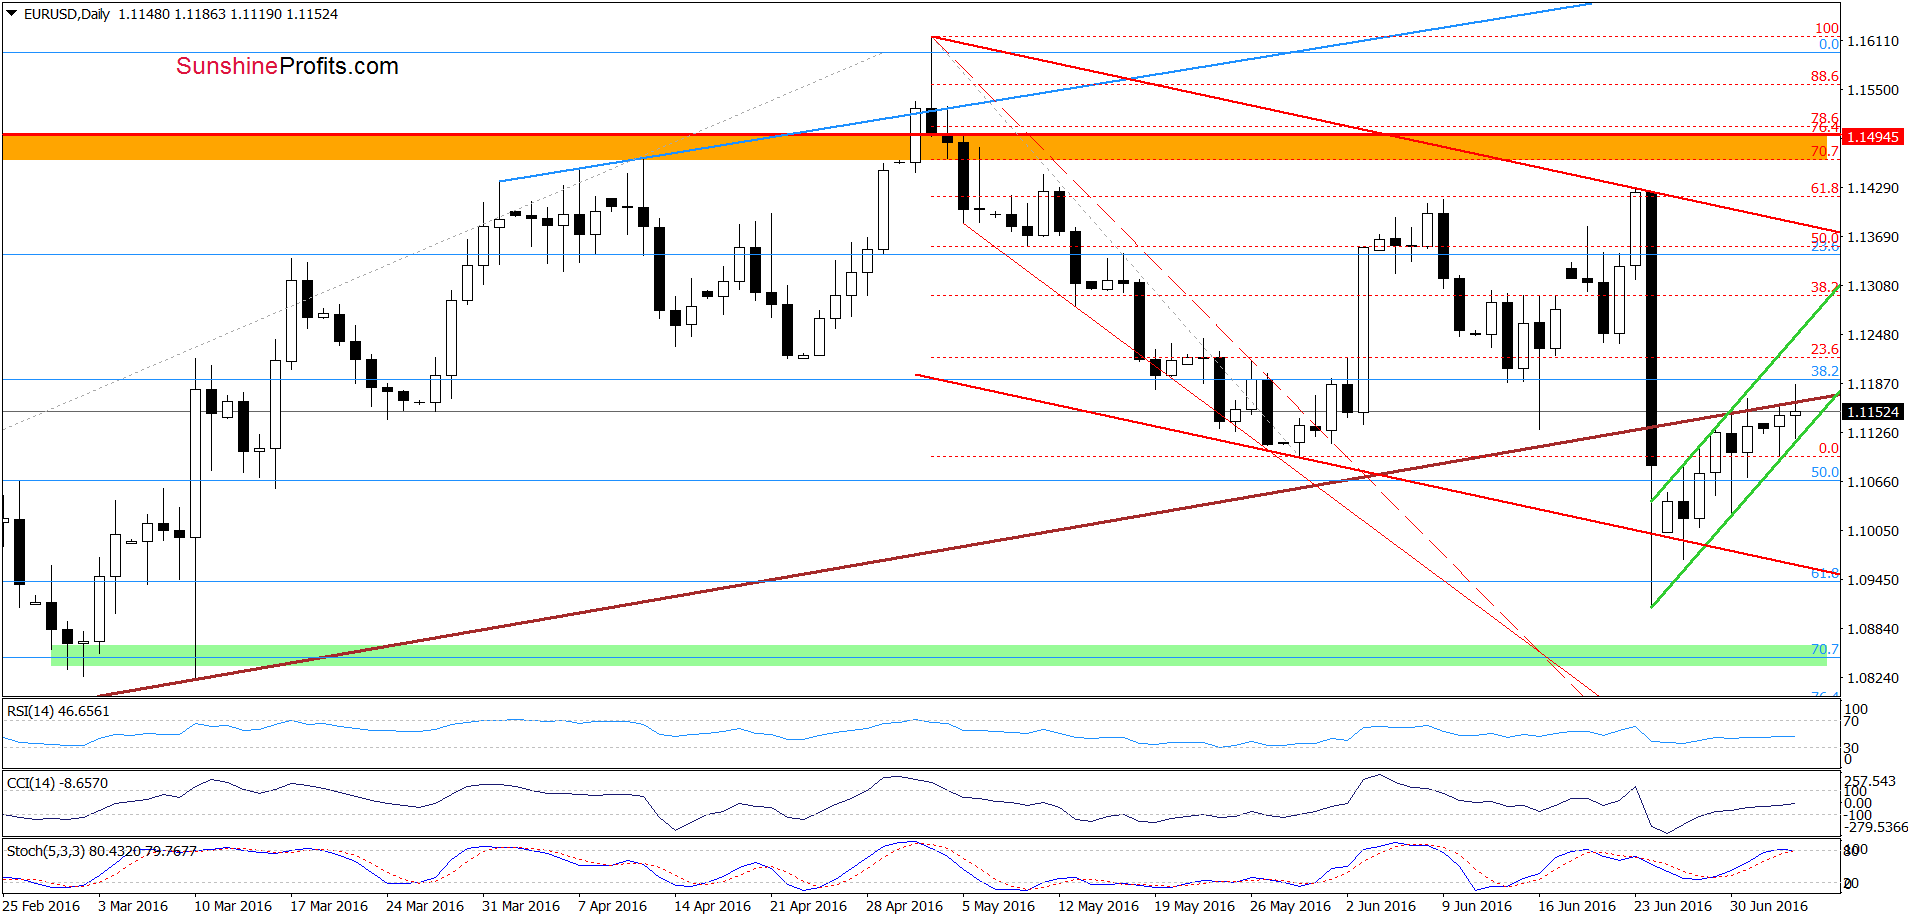
On the daily chart, we see that the situation developed in line with the above scenario and the pair moved higher earlier today. Nevertheless, although EUR/USD increased and climbed above the long-term brown line, currency bulls didn’t manage to hold gained levels, which resulted in a drop below this important line. In this way, the exchange rate invalidated earlier small breakout once again, which is a negative signal that suggests further deterioration and a re-test of the strength of the lower border of the green rising trend channel in the coming day(s).
Additionally, the risk of a bearish flag formation is still in play – especially when we take into account another unsuccessful attempt to break above the long-term brown line and the current position of the Stochastic Oscillator, which is very close to generating a sell signal. Taking these facts into account, we should keep in mind the quote from our Wednesday’s alert:
(…) on the other hand, we can treat the current upward move as a correction preceding the next downward move in the bearish flag formation. In this case, if EUR/USD closes one of the following sessions under the lower border of the green rising trend channel, we may see not only test of the recent low and the 61.8% Fibonacci retracement, but also decline even to around 1.0633, where the size of the move will correspond to the length of the first downward move (please note that at 1.0660 is also the 88.6% Fibonacci retracement based on the entire Dec-May upward move, which may pause declines).
Taking all the above into account, we believe that waiting at the sidelines for a confirmation or invalidation of the above is the best decision at the moment. However, if we receive more clear signals, we’ll consider opening short positions.
Very short-term outlook: mixed with bearish bias
Short-term outlook: mixed
MT outlook: mixed
LT outlook: mixed
Trading position (short-term; our opinion): No positions are justified from the risk/reward perspective. We will keep you informed should anything change, or should we see a confirmation/invalidation of the above.
GBP/USD
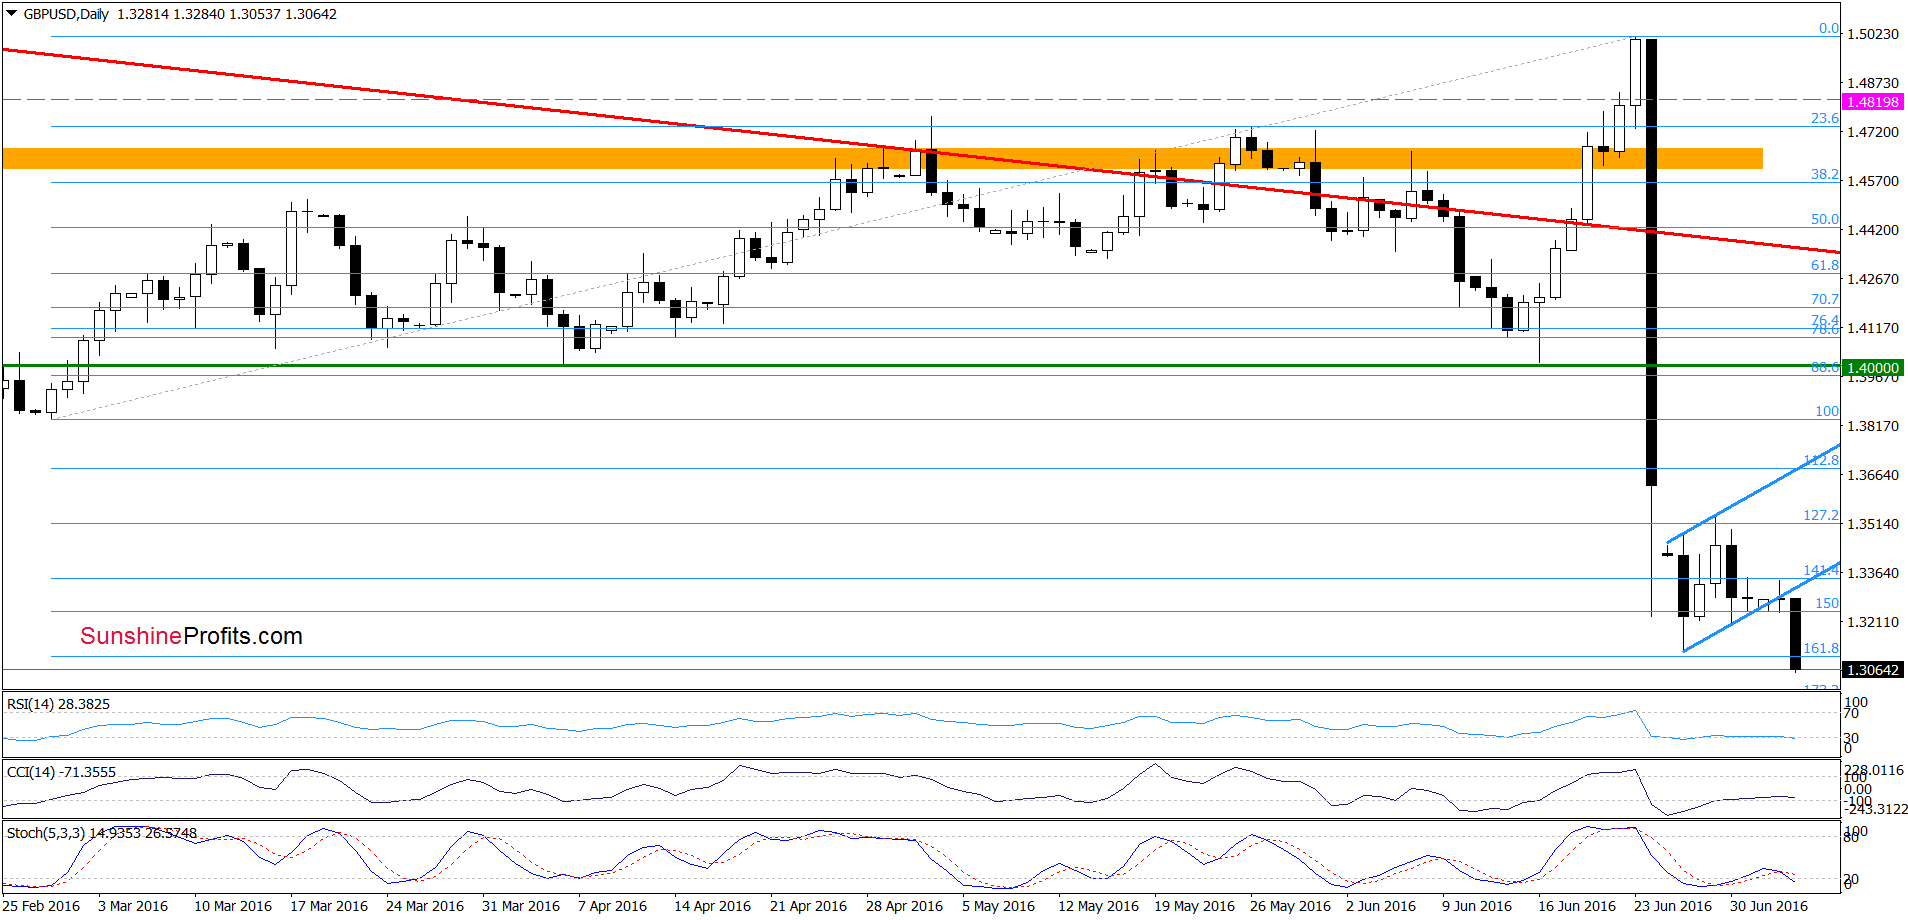
The first thing that catches the eye on the daily chart is breakdown under the lower border of the blue rising trend channel, which is a strong bearish signal – especially when we factor in the fact that the recent upward move could be just a break before further declines in a bearish flag formation.
How did this move affect the weekly chart? Let’s check.
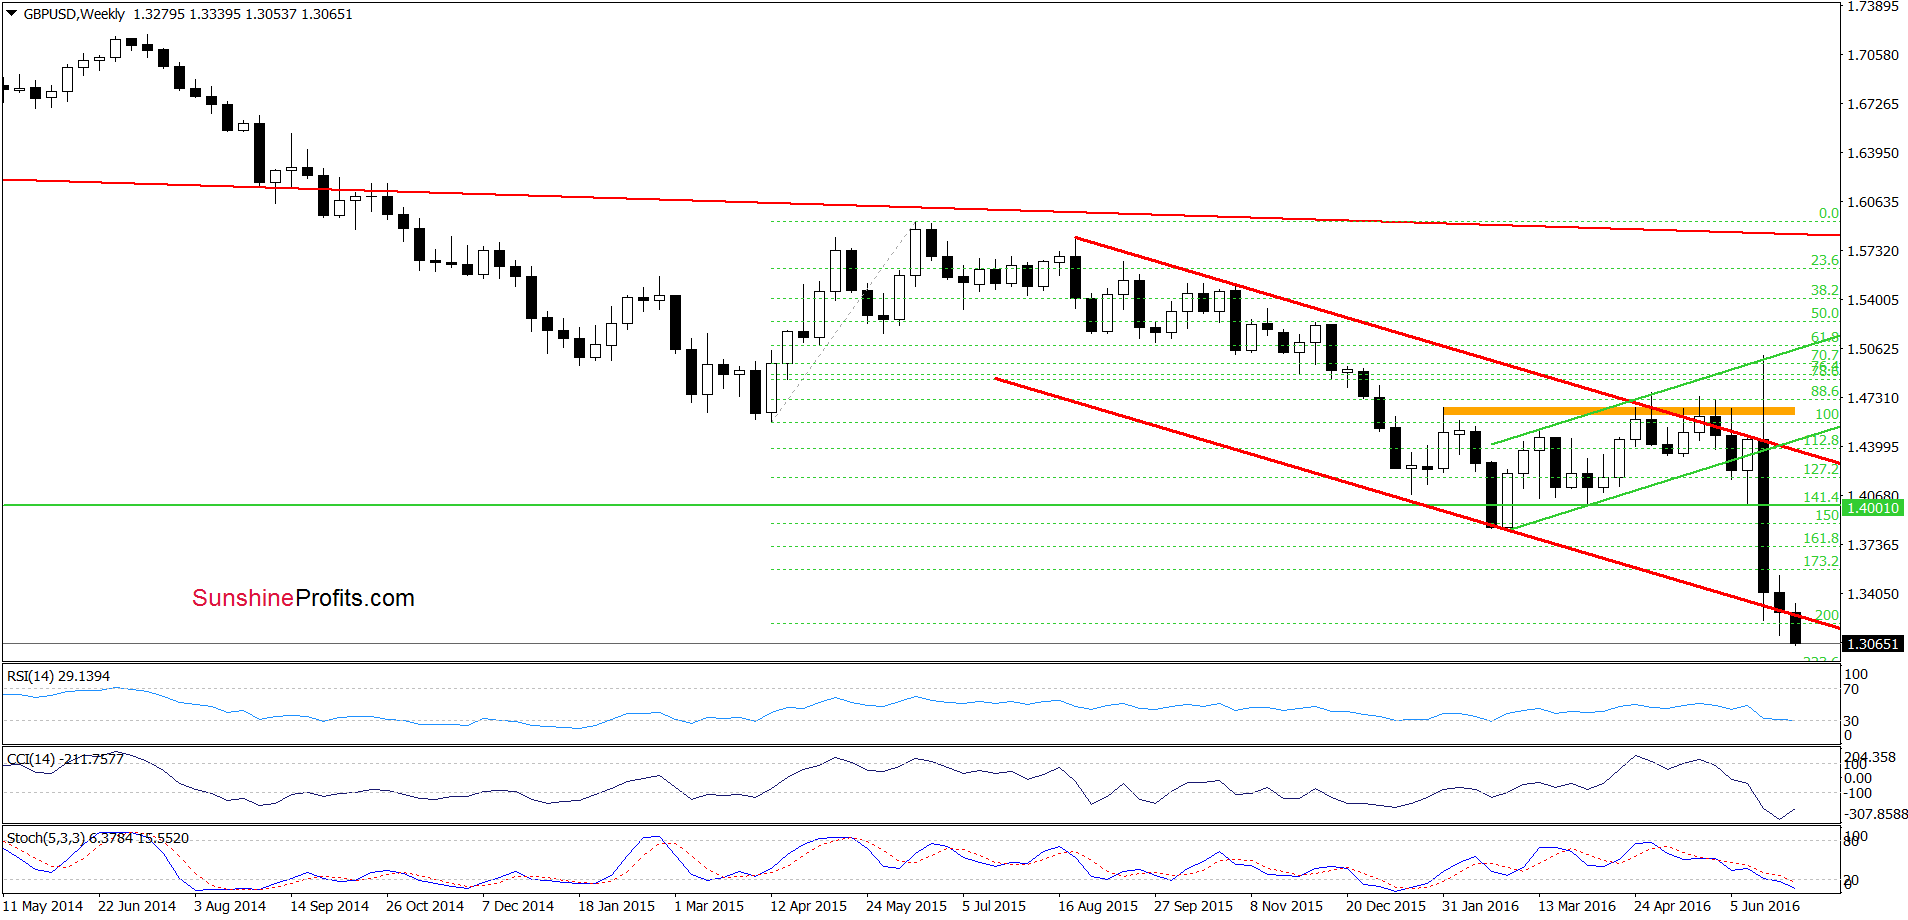
From the weekly perspective, we see that the situation deteriorated significantly as GBP/USD dropped under the lower border of the red declining trend channel and hit a fresh multi-year low. This is a strong bearish signal, which suggests further deterioration and a drop even to around 1.2161, where the size of the downward move will correspond to the height of the formation.
Are there any other negative factors that could encourage currency bears to act? Let’s examine the monthly chart and find out.
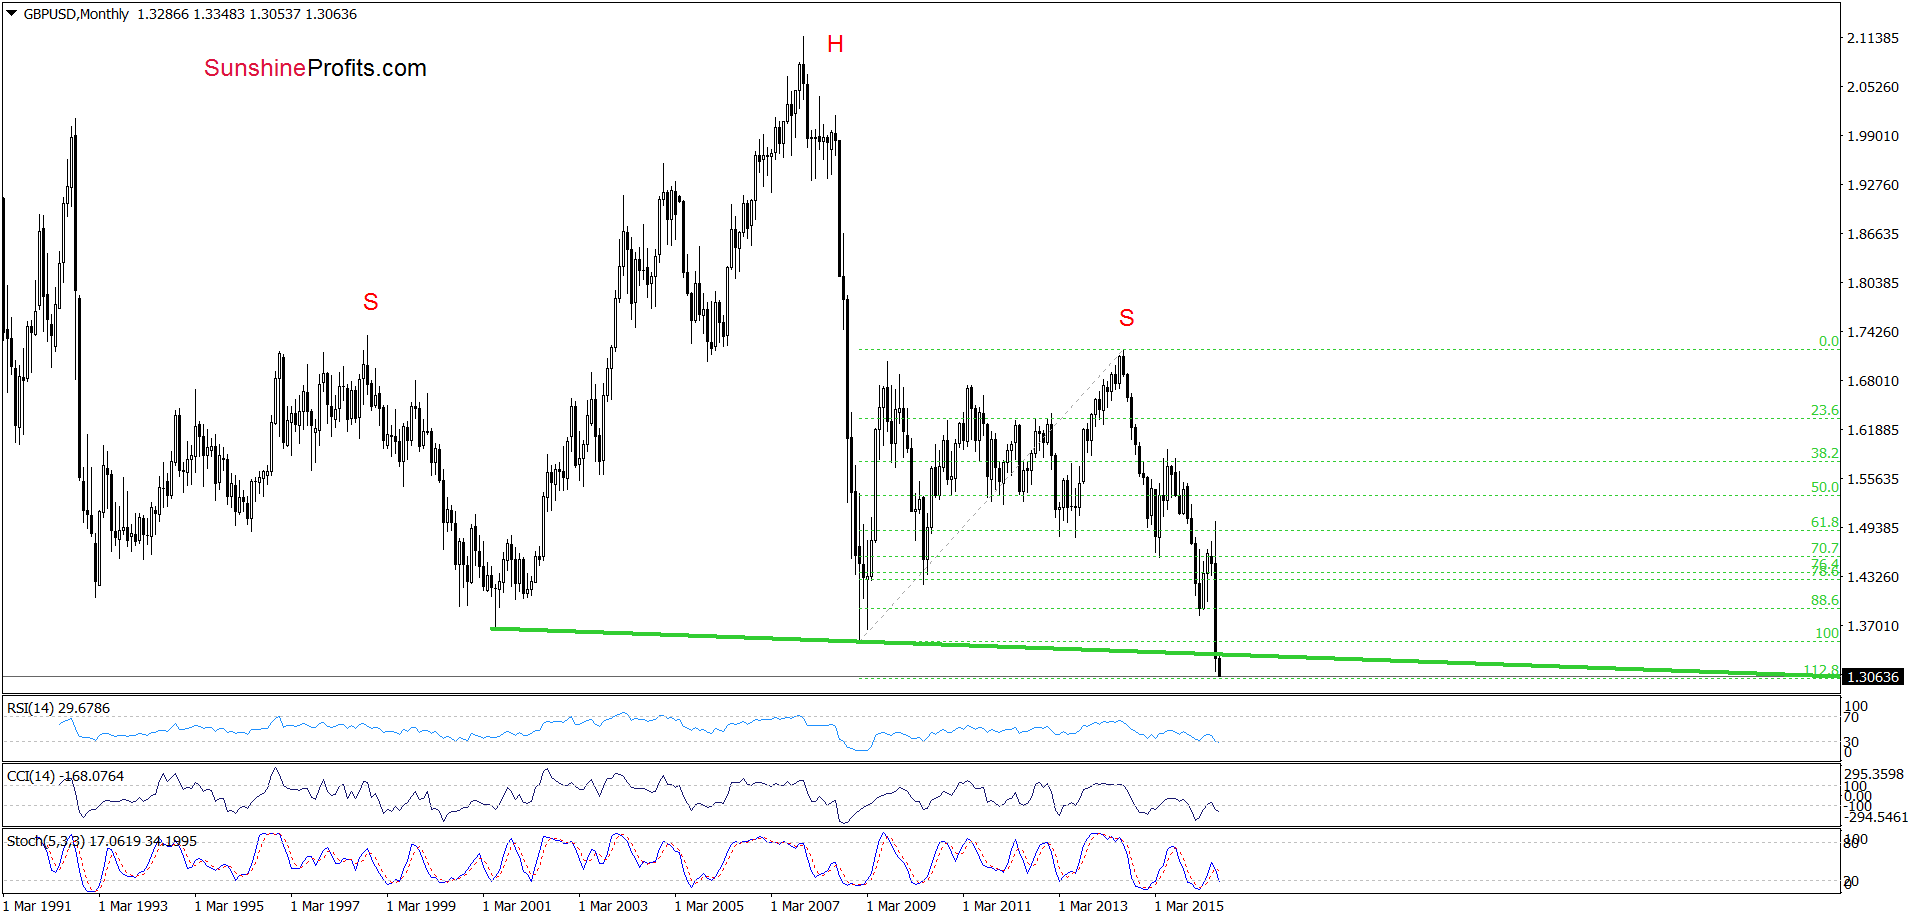
On the long-term chart, we see that although GBP/USD rebounded slightly after June’s decline, the neck line of the head and shoulders formation encouraged currency bears to act and resulted in another drop. This is another solid bearish factor, which suggests further declines and justifies the opening short positions.
Very short-term outlook: bearish
Short-term outlook: bearish
MT outlook: bearish
LT outlook: bearish
Trading position (short-term; our opinion): Short positions with a stop-loss at 1.3579 and the initial downside target at 1.2519 are justified from the risk/reward perspective at the moment. We will keep you informed should anything change, or should we see a confirmation/invalidation of the above.
AUD/USD
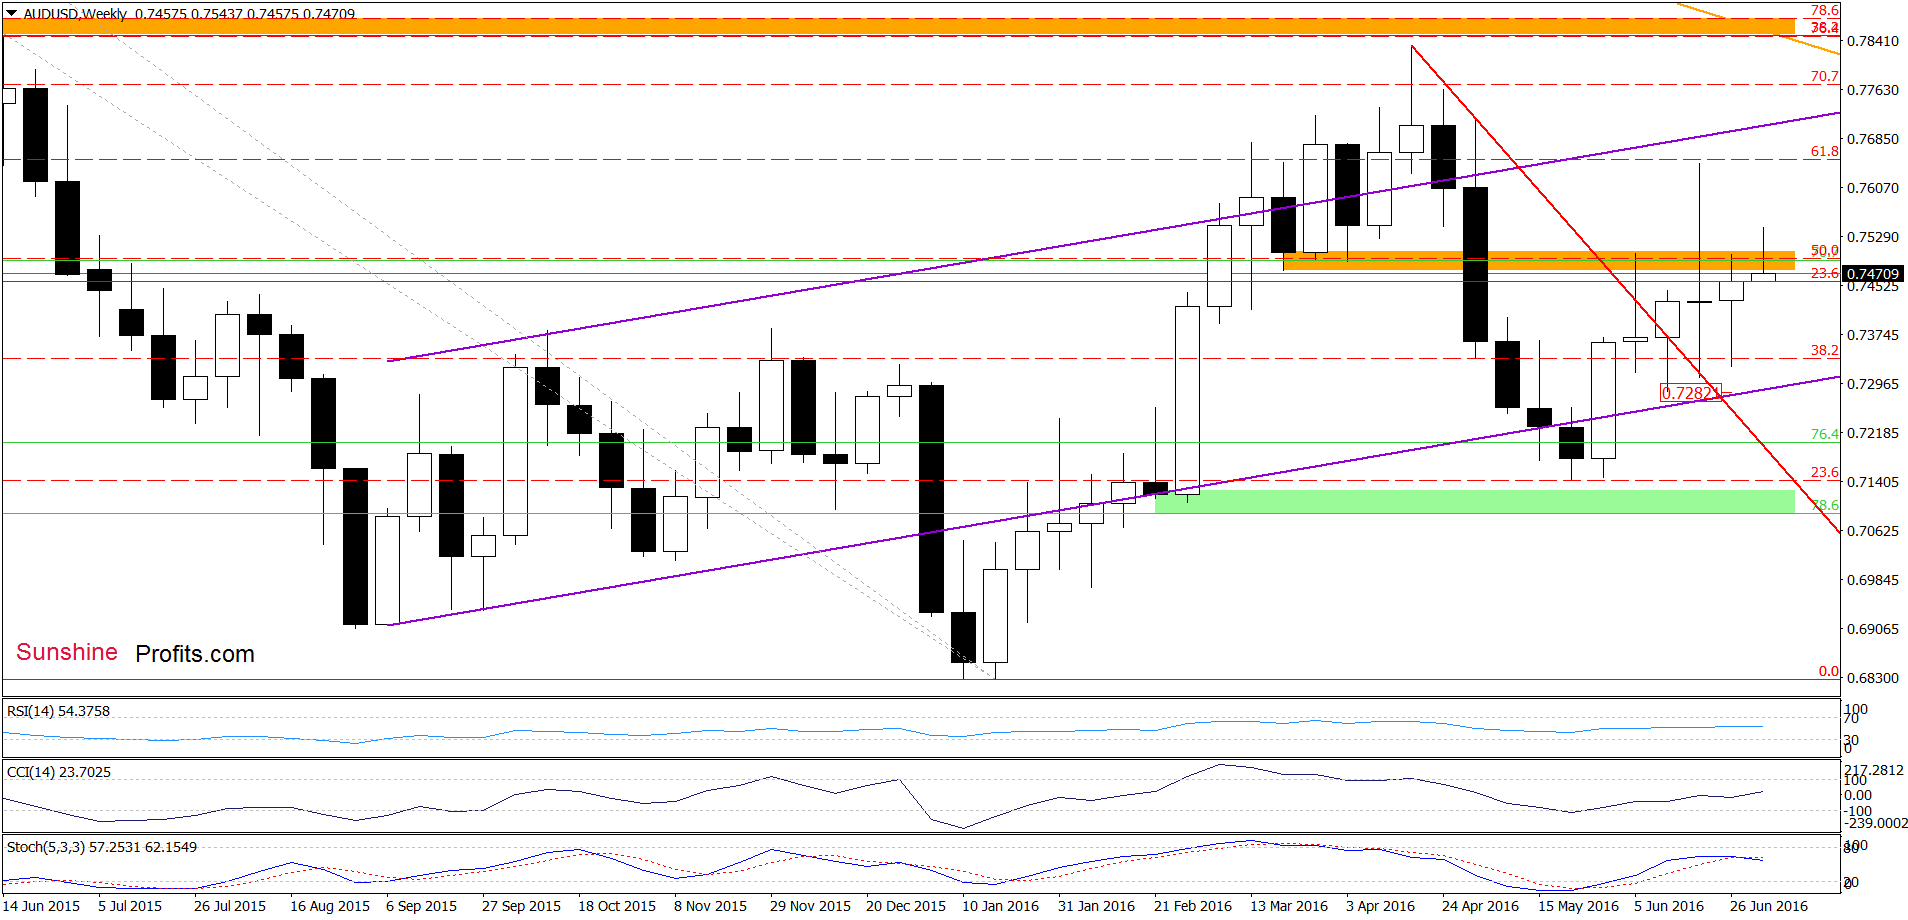
On the weekly chart, we see that although AUD/USD moved higher and climbed above the orange resistance zone, this improvement was temporary and the pair declined below it, invalidating earlier small breakout once again.
How did this drop affect the very short-term picture? Let’s check.
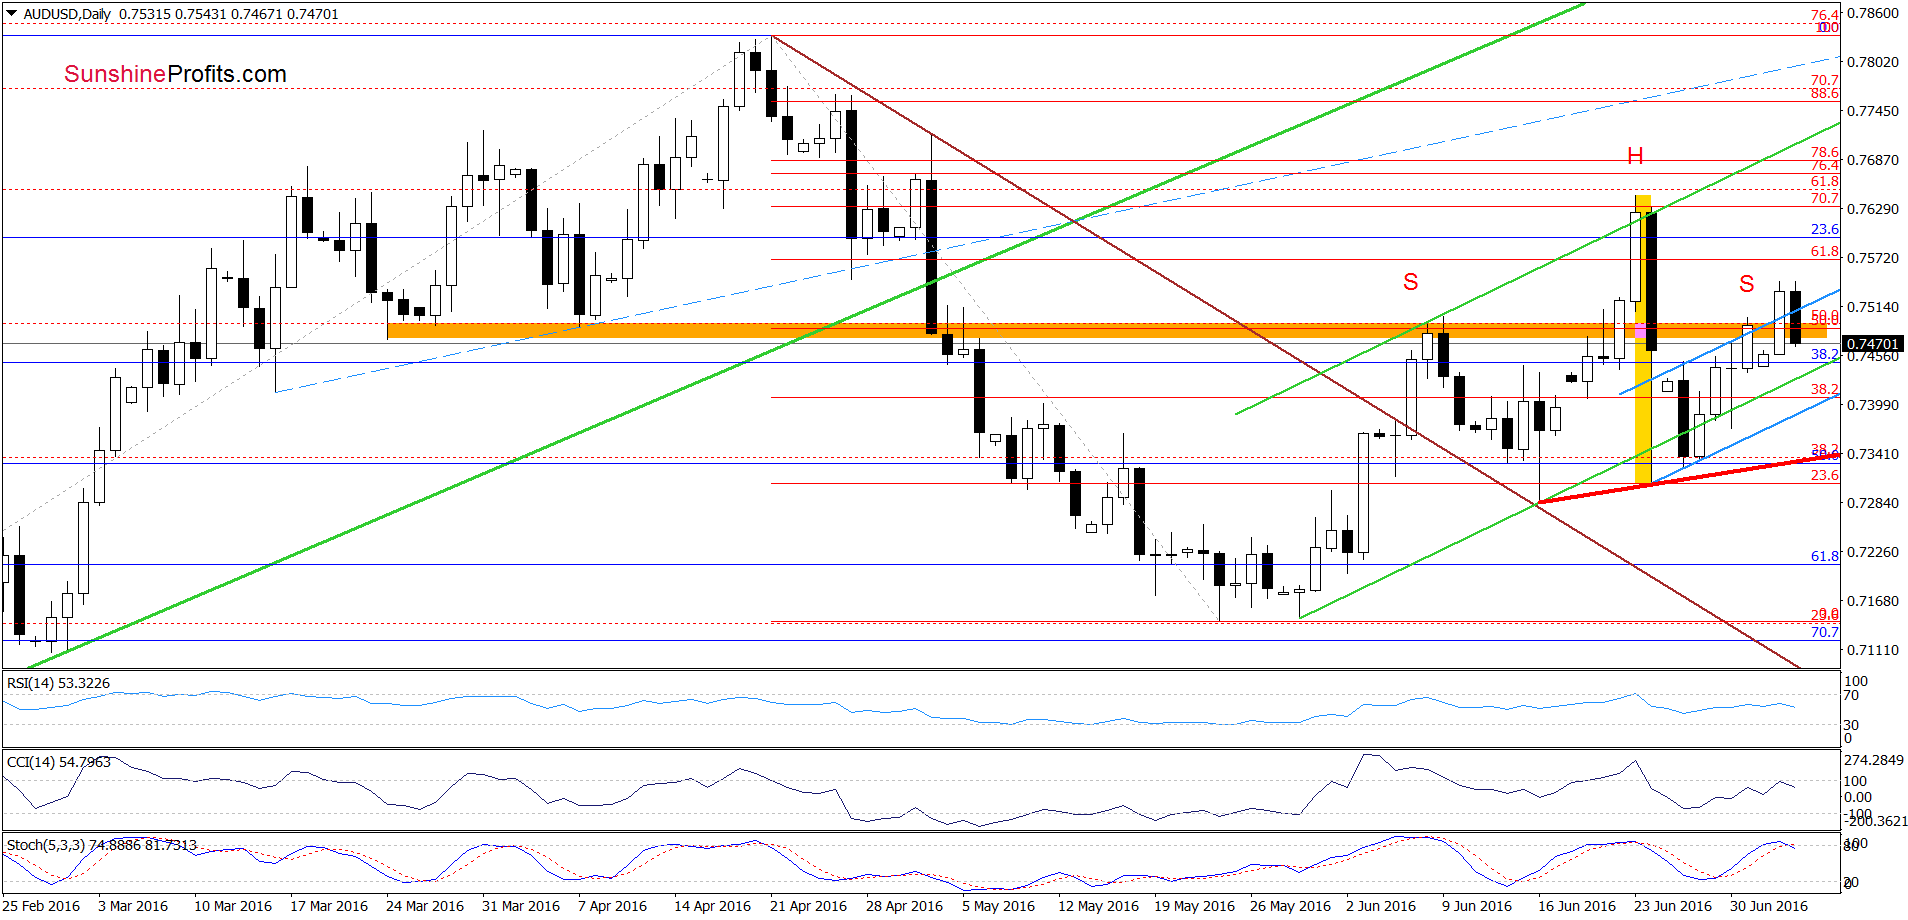
Looking at the daily chart, we see that buy signals generated by the indicators in combination with invalidation of the breakdown below the green support line based on the previous lows encouraged currency bulls to act, which resulted in a climb above the upper border of the blue rising trend channel and the orange resistance zone. Despite this improvement, AUD/USD reversed and declined, invalidating Friday’s breakouts. Taking this negative event into account and combining it with a sell signal generated by the Stochastic Oscillator, we think that further deterioration is just around the corner.
If this is the case, and the exchange rate declines from here, it would be a negative signal, which will trigger another attempt to move lower and a re-test of the green support line or even a drop to the lower border of the blue rising trend channel. At this point it is worth noting that if this support doesn’t stop currency bears we’ll likely see a decline to the red rising support line, which may be a neck line of a potential head and shoulders formation (marked on the daily chart).
Finishing today’s commentary on this currency pair we would like to draw your attention to another bearish factor – a potential flag formation (similarly to what we saw in the case of the two above-mentioned currency pairs). What does it mean for AUD/USD? If the exchange rate declines from current levels and drops under the lower border of the blue rising trend channel, we may see acceleration of declines and not only a re-test of the last Friday’s low, but also a drop to even to around 0.7209, where the size of the move will correspond to the Jun 24 decline.
Very short-term outlook: bearish
Short-term outlook: mixed with bearish bias
MT outlook: mixed
LT outlook: mixed
Trading position (short-term; our opinion): No positions are justified from the risk/reward perspective. We will keep you informed should anything change, or should we see a confirmation/invalidation of the above.
Thank you.
Nadia Simmons
Forex & Oil Trading Strategist
Przemyslaw Radomski, CFA
Founder, Editor-in-chief
Gold & Silver Trading Alerts
Forex Trading Alerts
Oil Investment Updates
Oil Trading Alerts

