

Earlier today, official data showed that U.K. manufacturing purchasing managers’ index rose to 52.1 in Jun, beating analysts’ expectations and increasing to the highest level since Jan. Thanks to these bullish numbers, GBP/USD moved slightly higher against the greenback. Is this lack of a stronger reaction suggest that the worst is not behind the pound?
In our opinion the following forex trading positions are justified - summary:
EUR/USD
Quoting our previous alert:
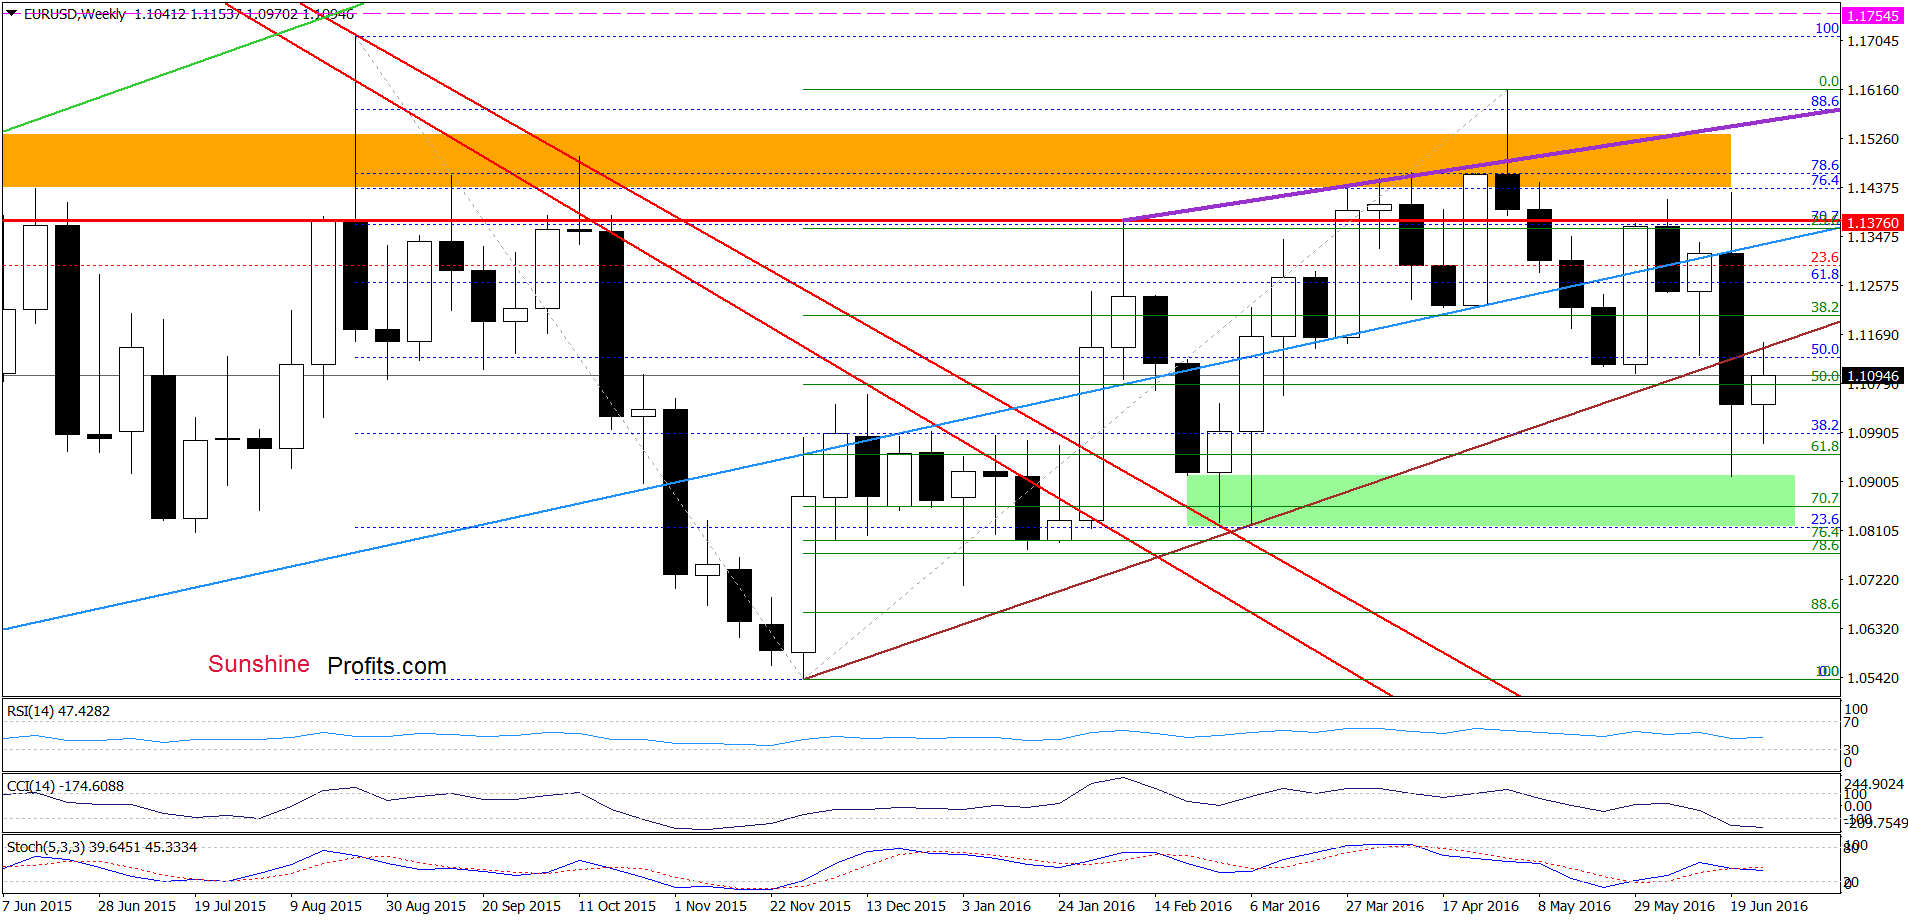
(…) EUR/USD reached our upside target, which looks like a verification of earlier breakdown under the long-term brown line. If this is the case and the exchange rate declines from, it would be a negative signal, which may trigger another downswing in the following days (at this point, it is also worth noting that the recent upward move approached the pair to the upper border of the green rising trend channel, which serves as an additional resistance at the moment). However, in our opinion, as long as there won’t be a breakdown below the lower line of the green rising trend channel another bigger move to the downside is not likely to be seen.
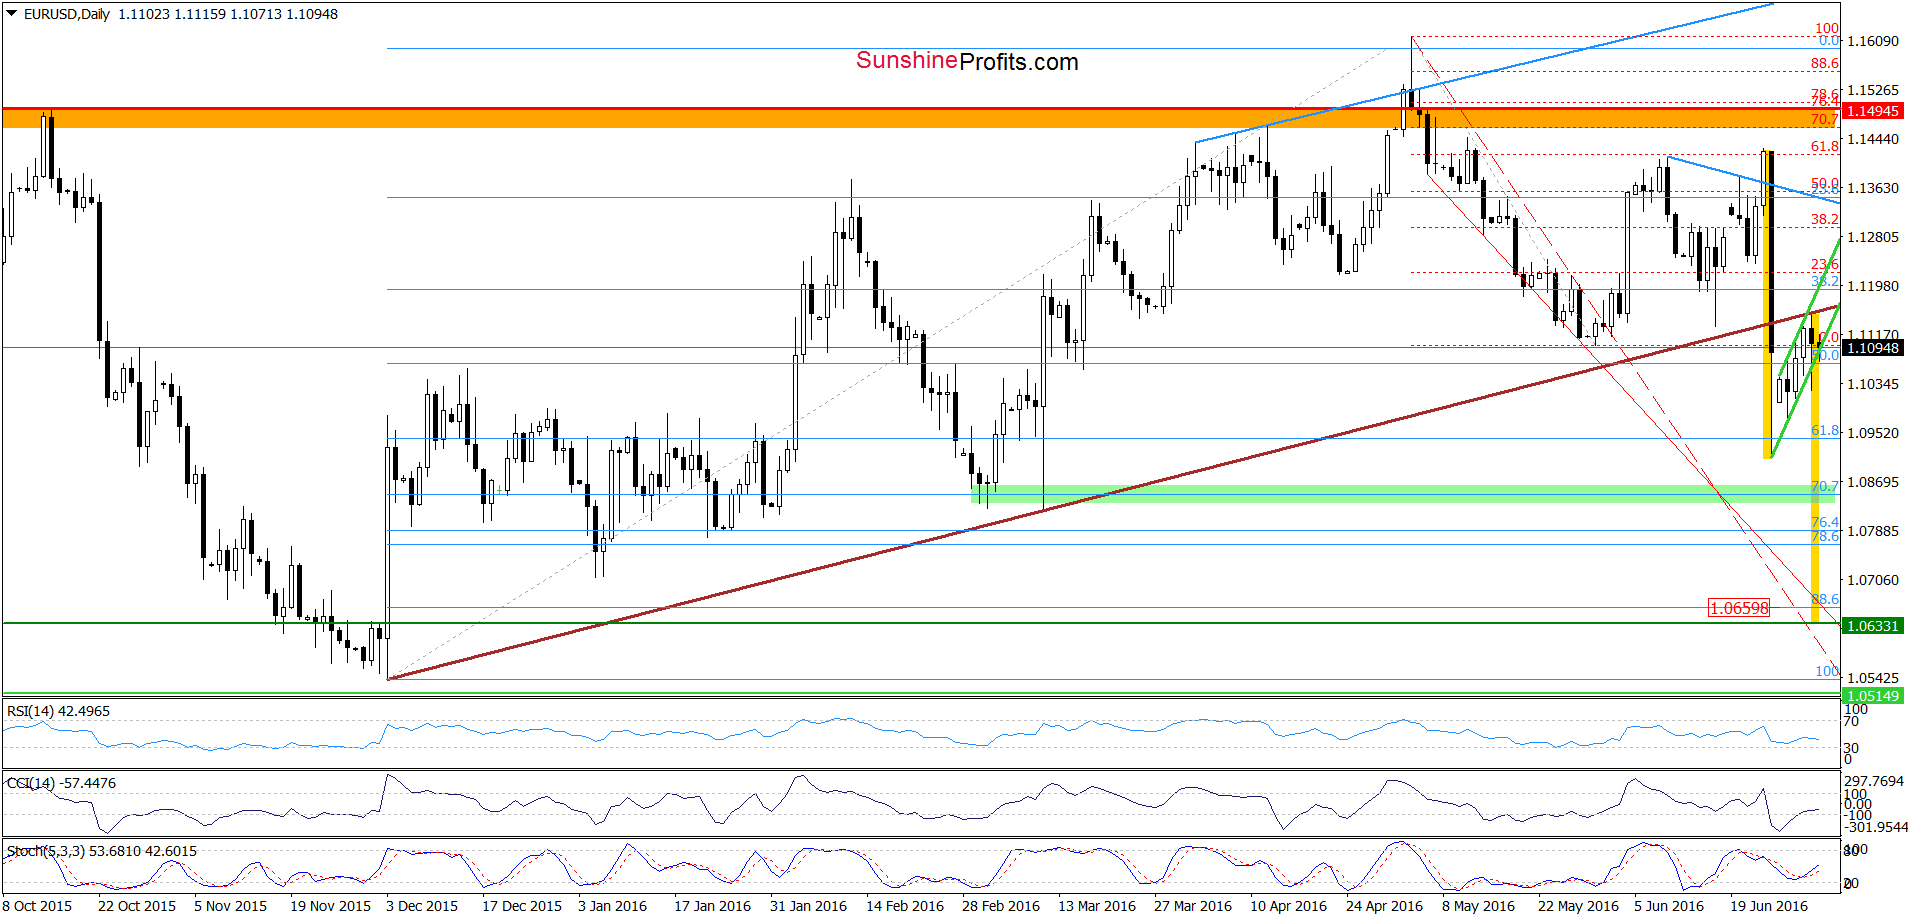
On the daily chart, we see that the combination of the long-term brown line and the upper border of the green rising trend channel encouraged currency bears to act as we had expected. As a result, the exchange rate declined sharply and slipped under the lower line of the green rising trend channel. However, as it turned out in the following hours this deterioration was only temporary and EUR/USD rebounded, closing yesterday’s session inside the trend channel. In this way, the pair invalidated earlier small breakdown, which is a positive signal that suggests further improvement – especially when we factor in buy signals generated by the indicators. Nevertheless, we still believe that as long as there won’t be breakout above the long-term brown resistance line another bigger upward move is not likely to be seen.
Additionally, the risk of a bearish flag formation is still in play – especially when we take into account yesterday’s verification of the breakdown under the long-term brown line. Therefore, we should keep in mind the quote from our Wednesday’s alert:
(…) on the other hand, we can treat the current upward move as a correction preceding the next downward move in the bearish flag formation. In this case, if EUR/USD closes one of the following sessions under the lower border of the green rising trend channel, we may see not only test of the recent low and the 61.8% Fibonacci retracement, but also decline even to around 1.0633, where the size of the move will correspond to the length of the first downward move (please note that at 1.0660 is also the 88.6% Fibonacci retracement based on the entire Dec-May upward move, which may pause declines).
Taking all the above into account, we believe that waiting at the sidelines for a confirmation or invalidation of the above is the best decision at the moment. However, if we receive more clear signals, we’ll consider opening positions.
Very short-term outlook: mixed with bearish bias
Short-term outlook: mixed
MT outlook: mixed
LT outlook: mixed
Trading position (short-term; our opinion): No positions are justified from the risk/reward perspective. We will keep you informed should anything change, or should we see a confirmation/invalidation of the above.
GBP/USD
On Wednesday, we wrote the following:
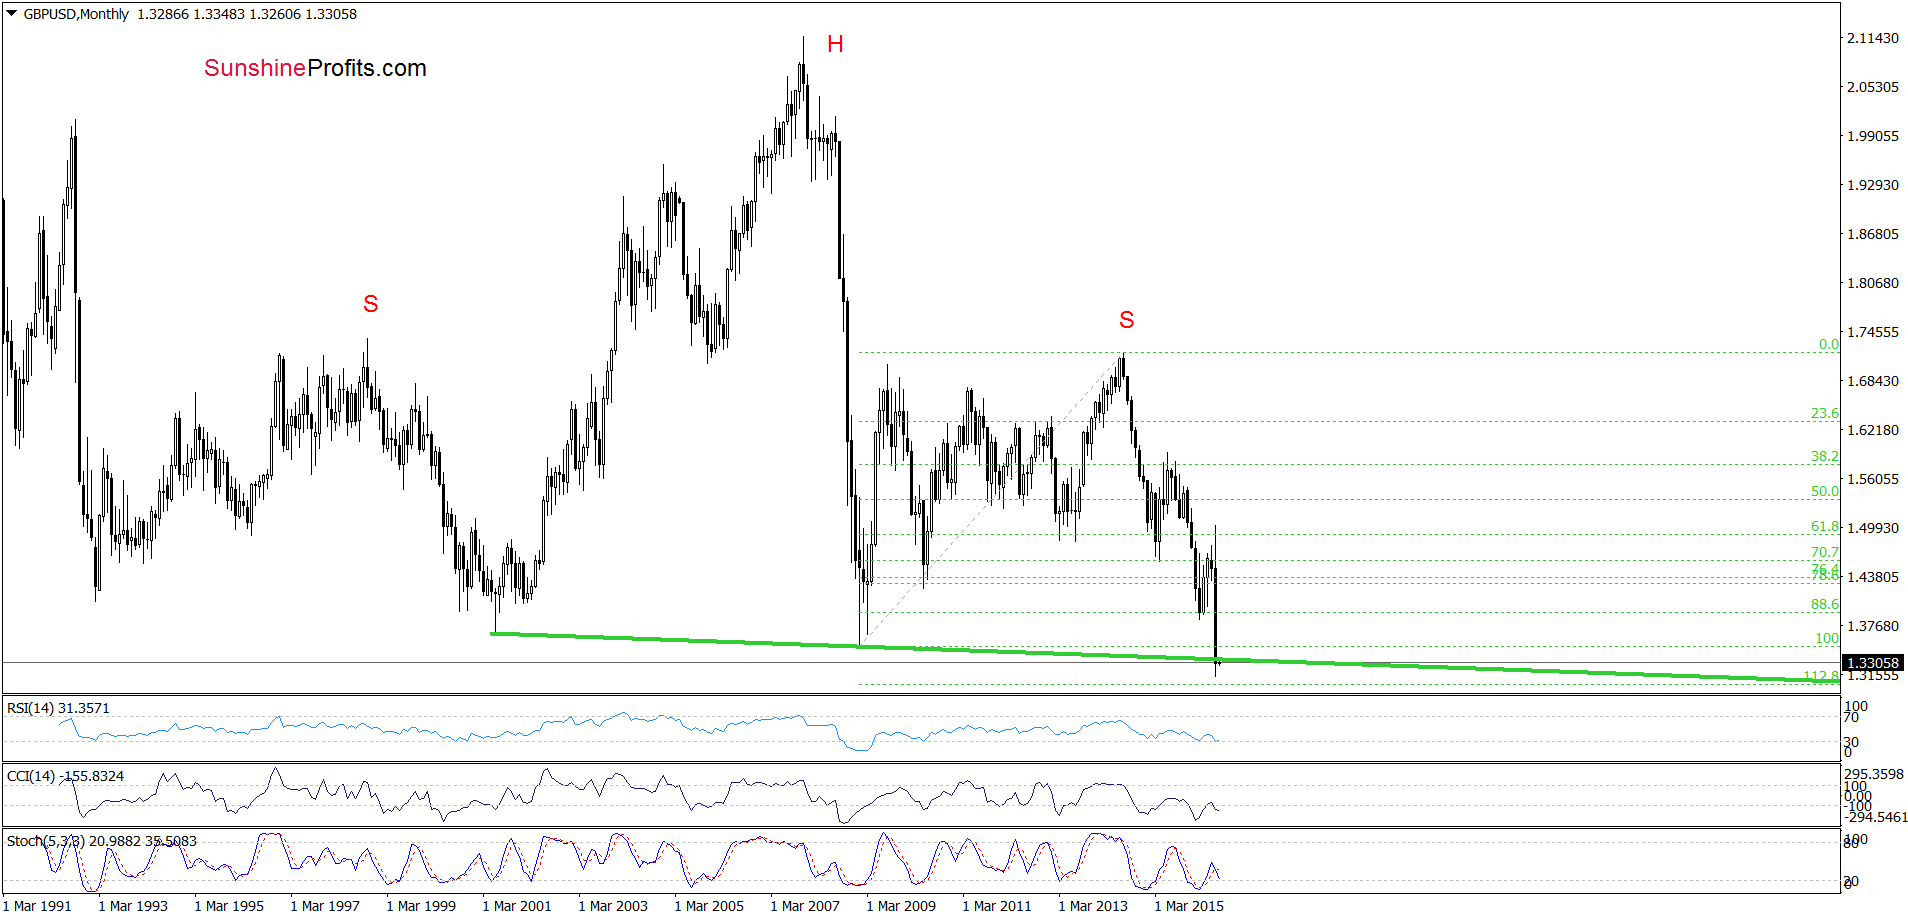
(…) GBP/USD slipped under the above-mentioned key lines, but currency bulls didn’t give up and pushed the pair higher (as we had expected), invalidating earlier small breakdowns. Although this is a positive signal that suggests further improvement, we should keep in mind that sell signals generated by the weekly indicators are still in play, which means that another re-test of the lower border of the red declining trend channel (marked on the weekly chart) and the neck line of the head and shoulder pattern (seen on the monthly chart) can’t be ruled out in the coming days.
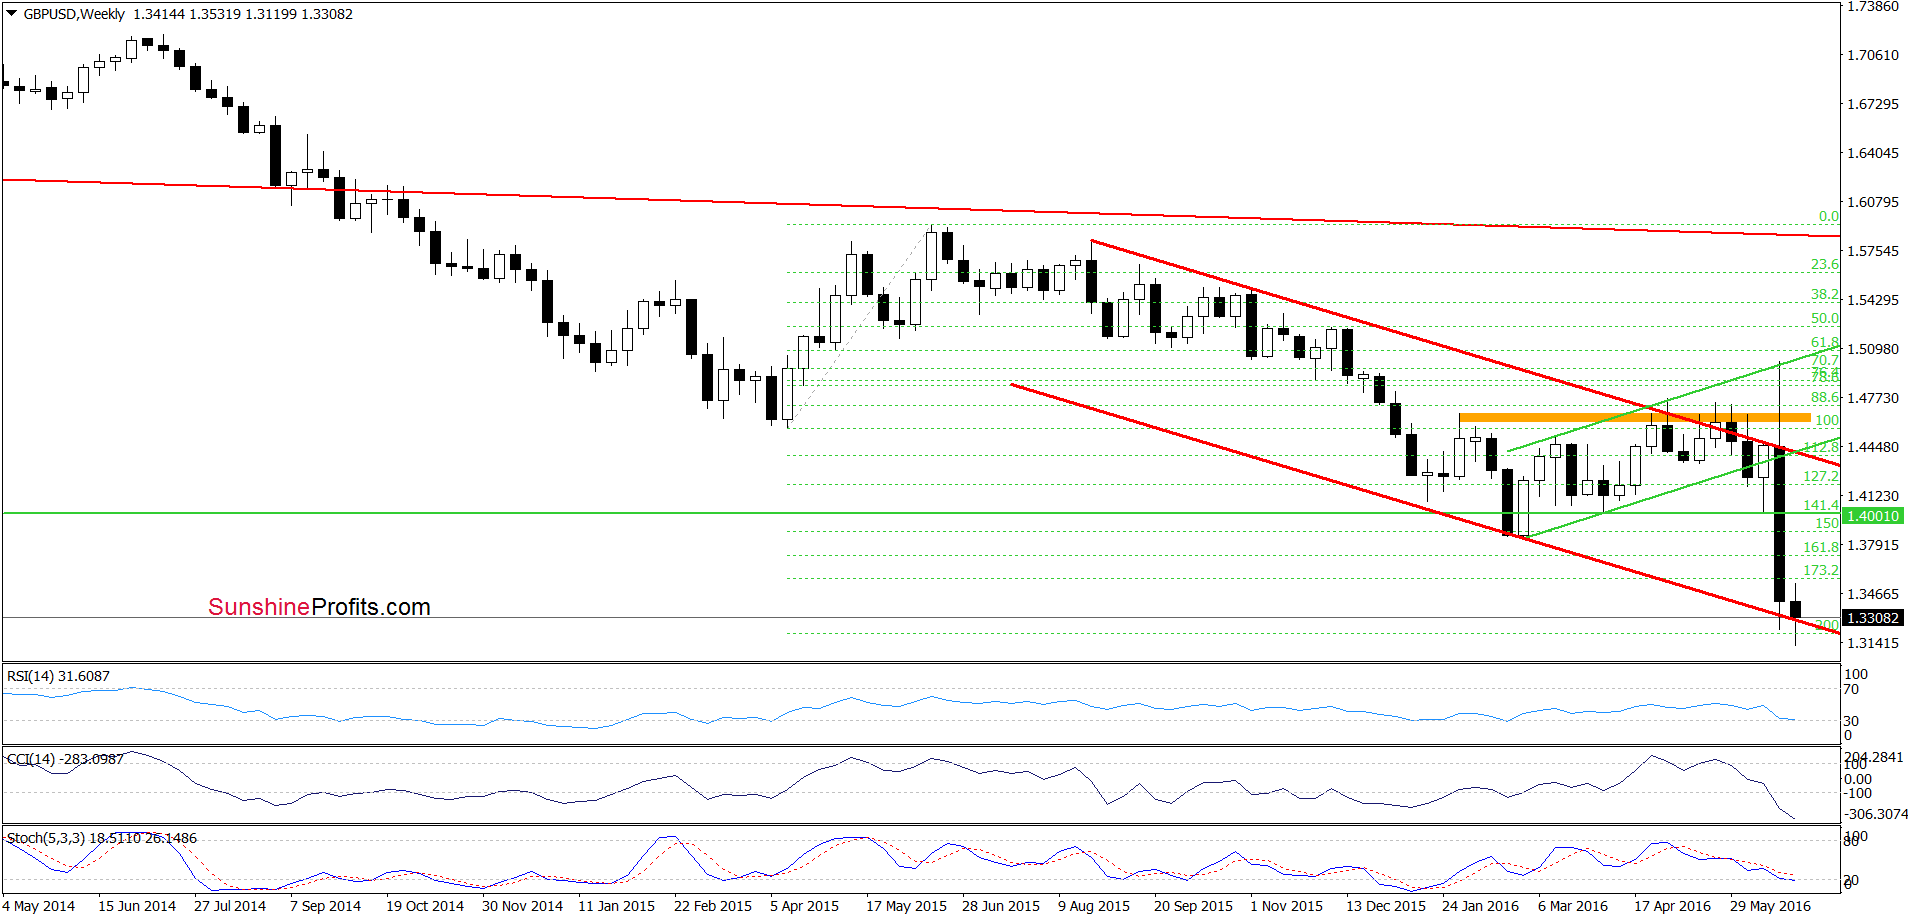
From today’s point of view, we see that the situation developed in tune with the above scenario and GBP/USD not only came back to the neck line of the head and shoulder pattern (seen on the monthly chart), but also closed Jun below it, which is a bearish signal. Nevertheless, as we see on the weekly chart, the lower border of the red declining trend channel continues to keep declines in check, which suggests that as long as there won’t be a weekly closure below this important support further deterioration is questionable and anther rebound can’t be ruled out.
Are there any other factors that could encourage currency bulls to act? Let’s examine the daily chart and find out.
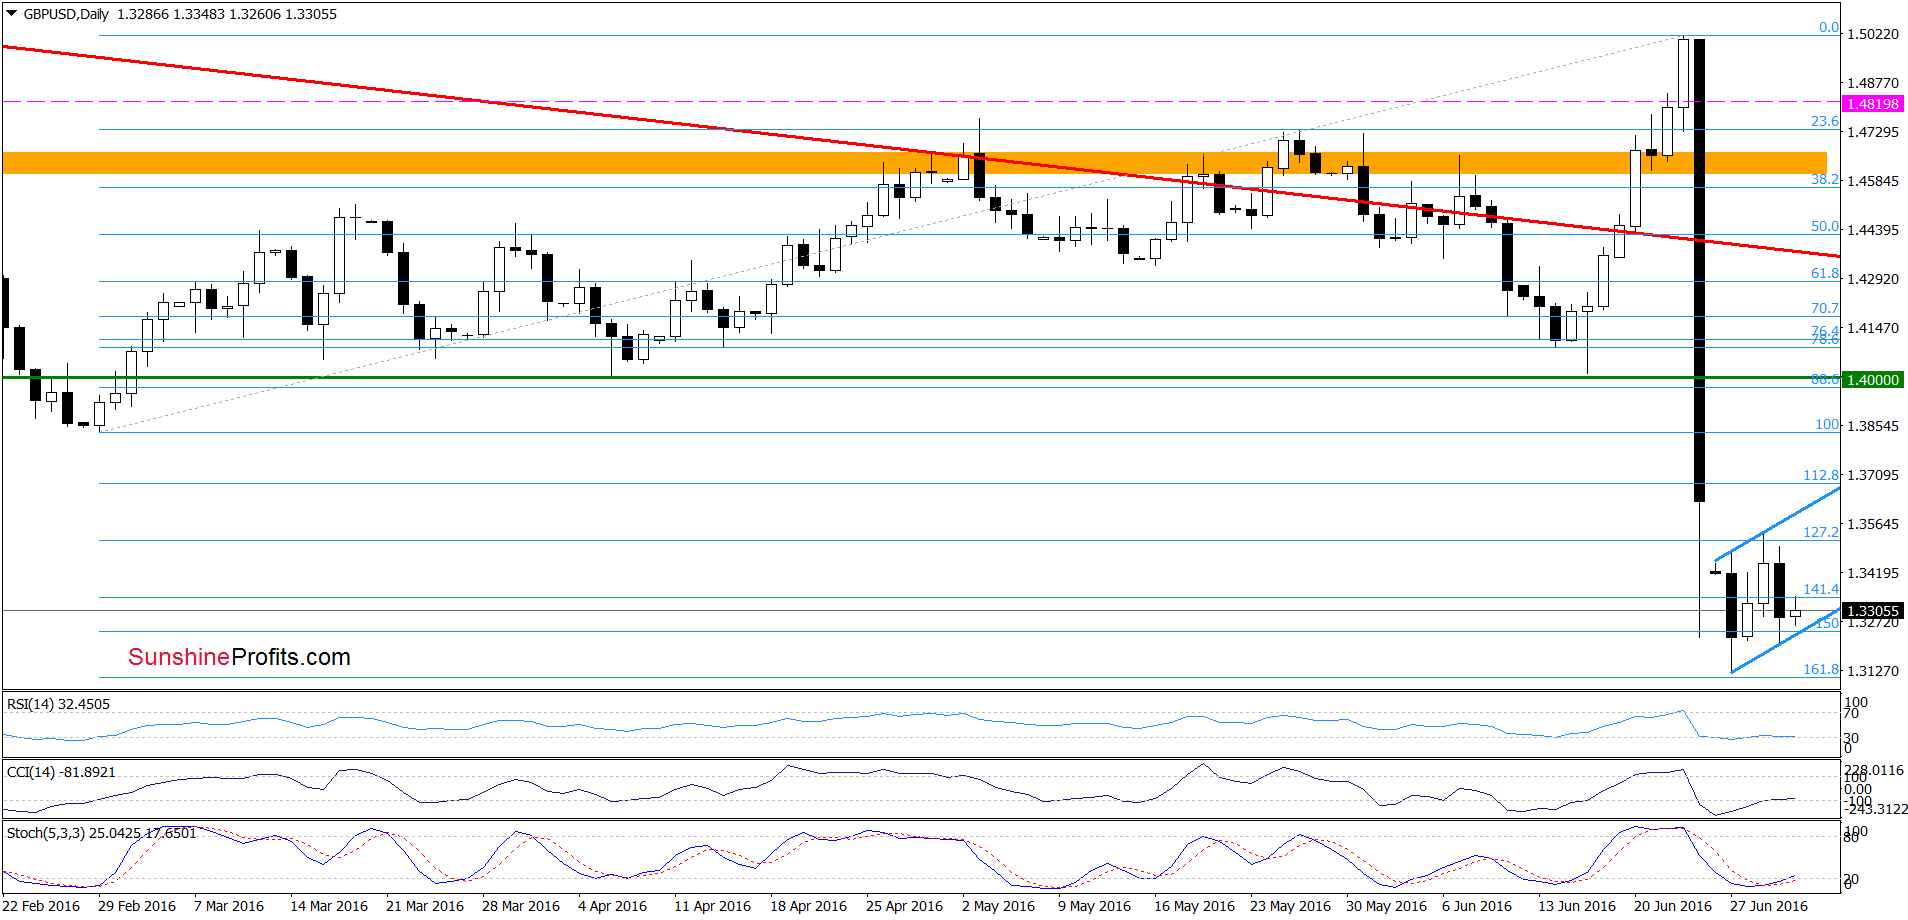
From the daily perspective, we see that the recent downward move took GBP/USD to the 161.8% Fibonacci extension, which in combination with the key support lines marked on the monthly and weekly charts stopped further declines. Since Monday’s low the exchange rate is trading in a blue rising trend channel, which – similarly to what we wrote in the case of EUR/USD may be a bearish flag formation. Nevertheless, the current position of the daily indicators (they all generated buy signals) suggests that further improvement is just around the corner. If this is the case and the pair moves higher from current levels, the initial upside target would be around 1.3590, where the upper border of the blue rising trend channel currently is.
Finishing today’s commentary on this currency pair, please note that if the pair closes this week under the lower border of the red declining trend channel, we’ll consider re-opening short positions.
Very short-term outlook: mixed with bullish bias
Short-term outlook: mixed
MT outlook: mixed
LT outlook: mixed with bearish bias
Trading position (short-term; our opinion): No positions are justified from the risk/reward perspective at the moment. We will keep you informed should anything change, or should we see a confirmation/invalidation of the above.
AUD/USD
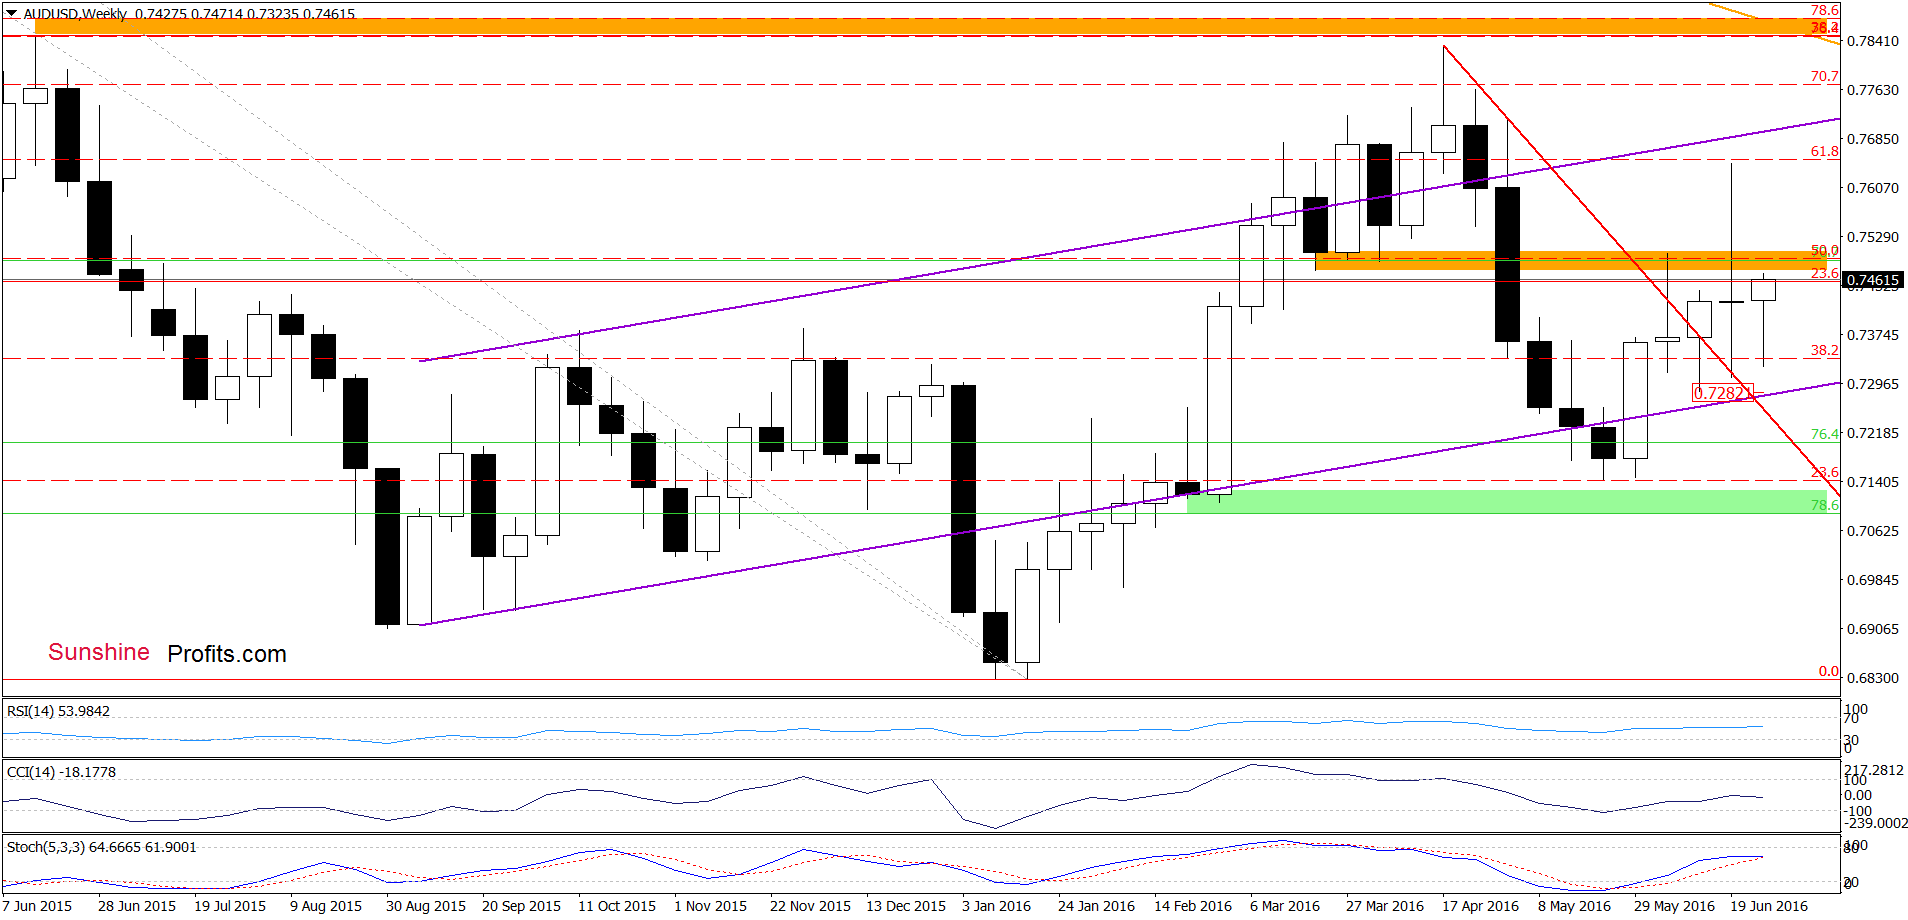
On the weekly chart, we see that although AUD/USD moved lower at the beginning of the week, the exchange rate rebounded in the following days and approached the orange resistance zone, which may be a verification of earlier breakdown.
Will the very short-term picture confirm this pro bearish scenario? Let’s check.
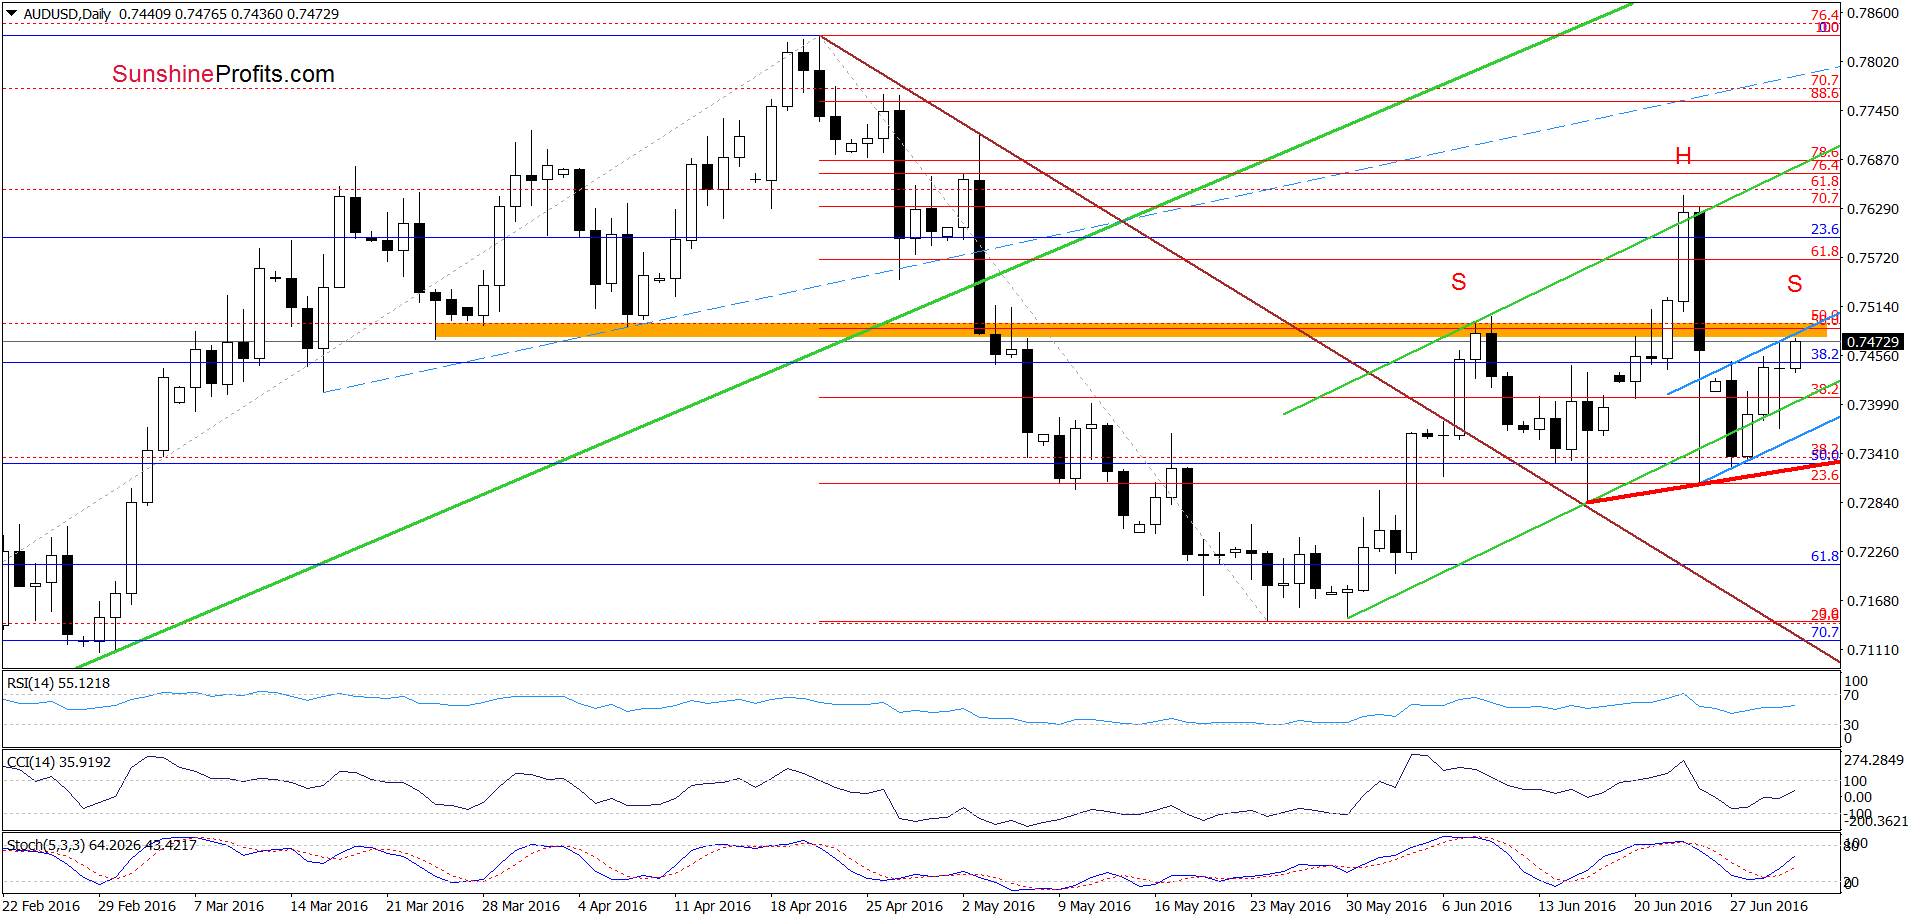
Looking at the daily chart, we see that AUD/USD (similarly to what we saw in the case of EUR/USD and GBP/USD) is moving in the blue rising trend channel since last Friday’s low. With the recent upward move, the exchange rate reached the upper border of the formation and the previously-broken orange resistance zone. What's next? On one hand, buy signals generated by the indicators in combination with invalidation of the breakdown below the green support line based on the previous lows suggest further improvement. However, in our opinion, as long as there won’t be breakout and a daily closure above this key resistance zone, another bigger upward move is not likely to be seen. Why? Because when we take a look at the charts, we see that the recent increase may be nothing more than a verification of earlier breakdown below the orange zone. If this is the case, and the exchange rate declines from here, it would be a negative signal, which will trigger another attempt to move lower and a re-test of the green support line or even a drop to the lower border of the blue rising trend channel. At this point it is worth noting that if this support doesn’t stop currency bears we’ll likely see a decline to the red rising support line, which may be a neck line of a potential head and shoulders formation (marked on the daily chart).
Finishing today’s commentary on this currency pair we would like to draw your attention to another bearish factor – a potential flag formation (similarly to what we saw in the case of the two above-mentioned currency pairs). What does it mean for AUD/USD? If the exchange rate declines from current levels and drops under the lower border of the blue rising trend channel, we may see acceleration of declines and not only a re-test of the last Friday’s low, but also a drop to even to around 0.7143, where the size of the move will correspond to the last week’s decline and where the late May lows are.
Taking all the above into account, we believe that waiting at the sidelines for a confirmation or invalidation of the above is the best decision at the moment. However, if we receive more clear signals, we’ll consider opening positions.
Very short-term outlook: mixed with bearish bias
Short-term outlook: mixed
MT outlook: mixed
LT outlook: mixed
Trading position (short-term; our opinion): No positions are justified from the risk/reward perspective. We will keep you informed should anything change, or should we see a confirmation/invalidation of the above.
Thank you.
Nadia Simmons
Forex & Oil Trading Strategist
Przemyslaw Radomski, CFA
Founder, Editor-in-chief, Gold & Silver Fund Manager
Gold & Silver Trading Alerts
Forex Trading Alerts
Oil Investment Updates
Oil Trading Alerts

