

Yesterday, the Federal Reserve left its interest rates unchanged at 0.50%, which pushed the USD Index to an intraday low of 94.41. Despite this drop, the greenback moved higher against its Canadian counterpart as declining prices of crude oil weakened Canadian currency. Thanks to these circumstances, USD/CAD approached the barrier of 1.3000 earlier today. Will it manage to stop further improvement?
In our opinion the following forex trading positions are justified - summary:
- EUR/USD: none
- GBP/USD: short (stop-loss order at 1.4785; downside target at 1.4056)
- USD/JPY: none
- USD/CAD: none
- USD/CHF: none
- AUD/USD: none
EUR/USD
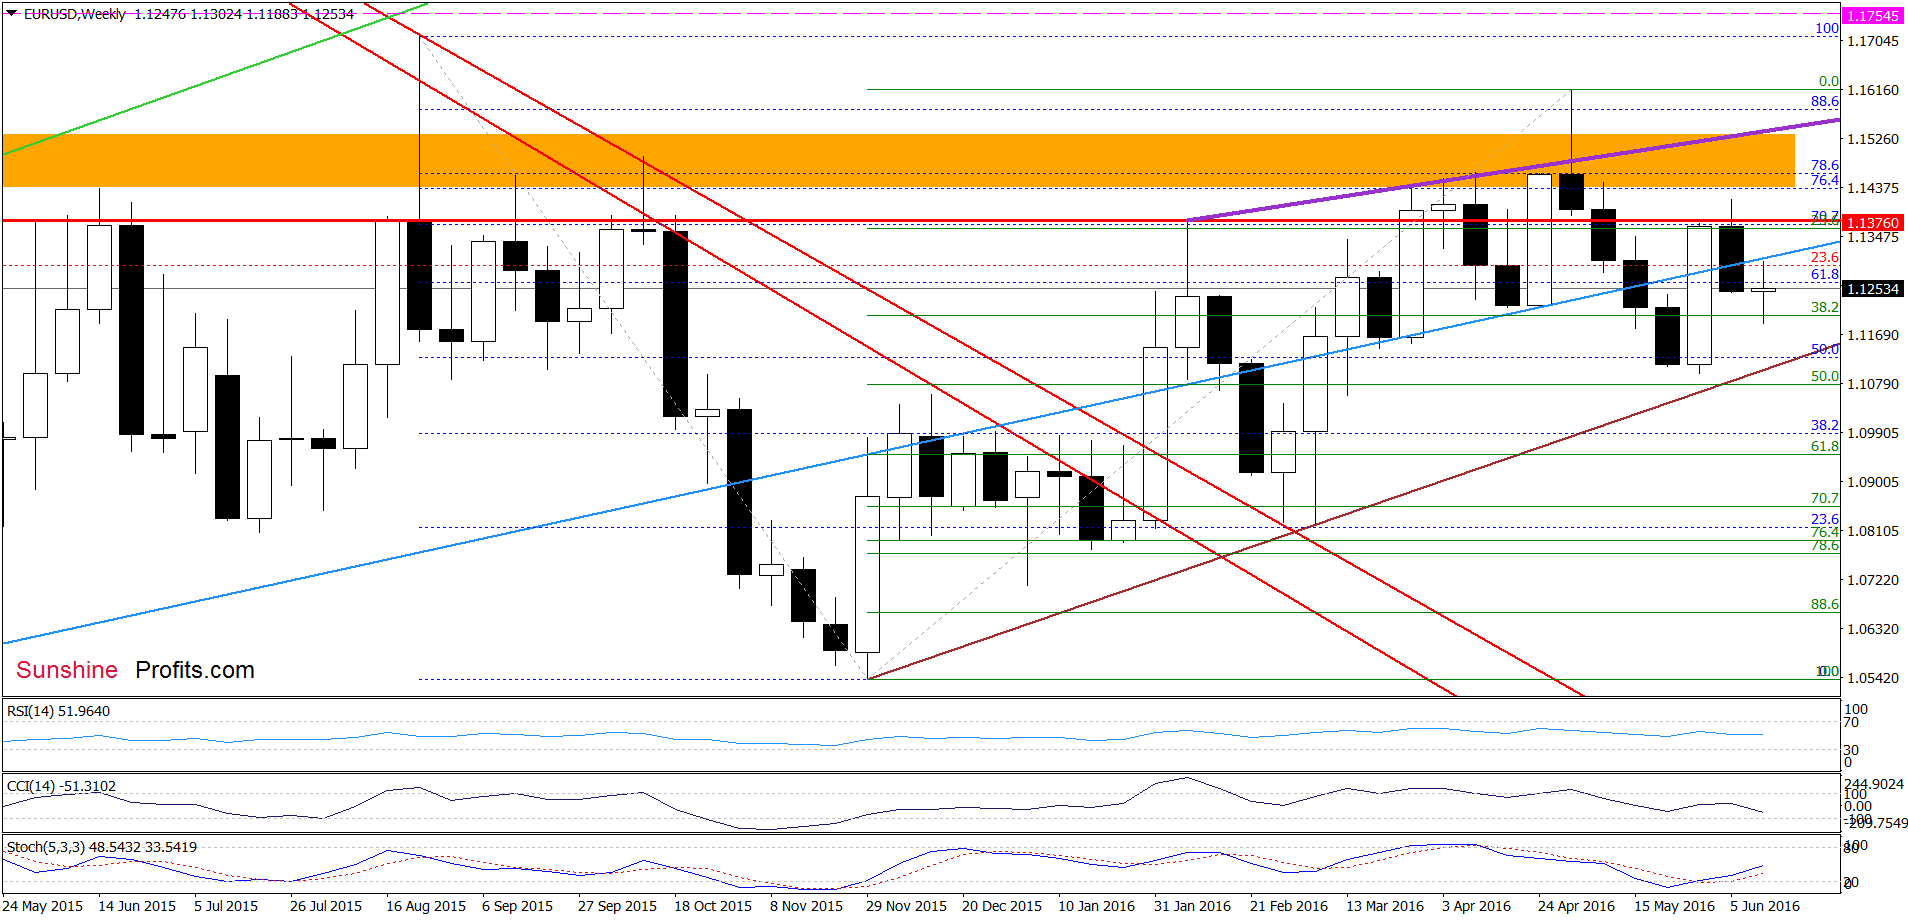
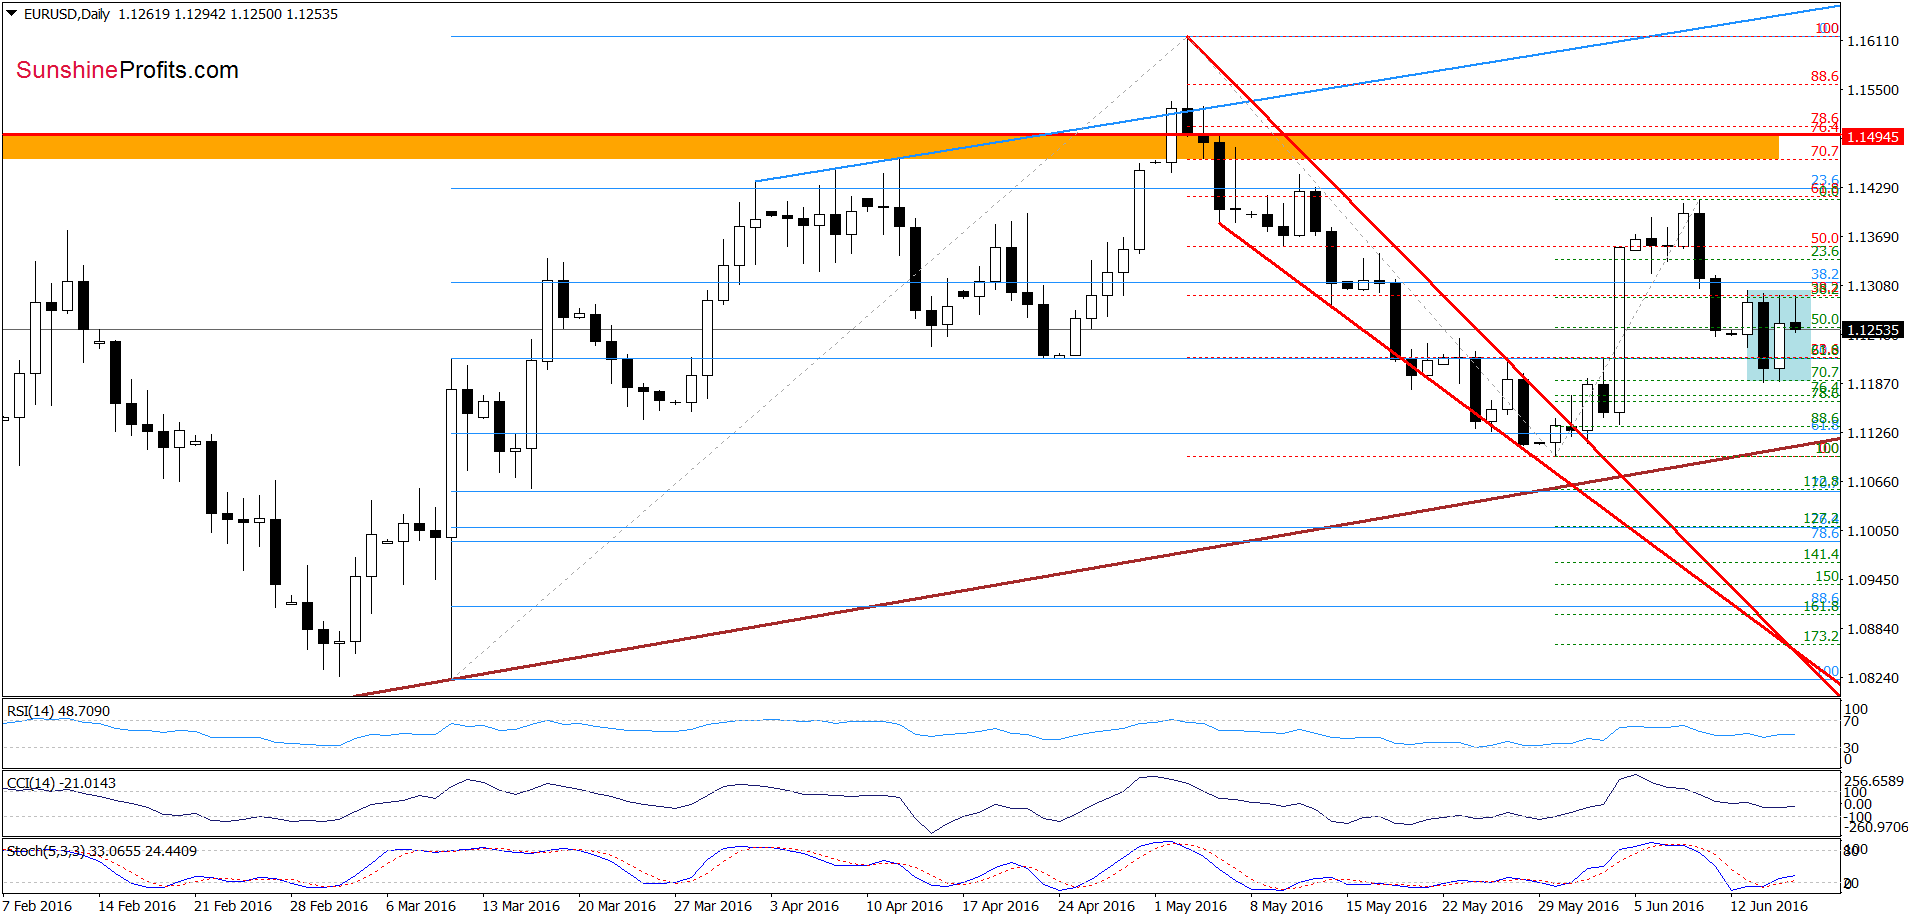
From today’s point of view, we see that the 70.7% Fibonacci retracement encouraged currency bulls to act, which resulted in a rebound to slightly below this week’s highs. This resistance area stopped further improvement and the pair gave up some gains earlier today, which suggests that we may see a re-test of the recent lows in the coming day(s). Nevertheless, in our opinion, as long as there won’t be breakdown under the lower border of the blue consolidation (1.1188) further deterioration is not likely to be seen – especially when we factor in the current position of the daily indicators, which suggests that reversal is just around the corner.
Very short-term outlook: mixed with bearish bias
Short-term outlook: mixed
MT outlook: mixed with bearish bias
LT outlook: mixed
Trading position (short-term; our opinion): No positions are justified from the risk/reward perspective. We will keep you informed should anything change, or should we see a confirmation/invalidation of the above.
GBP/USD
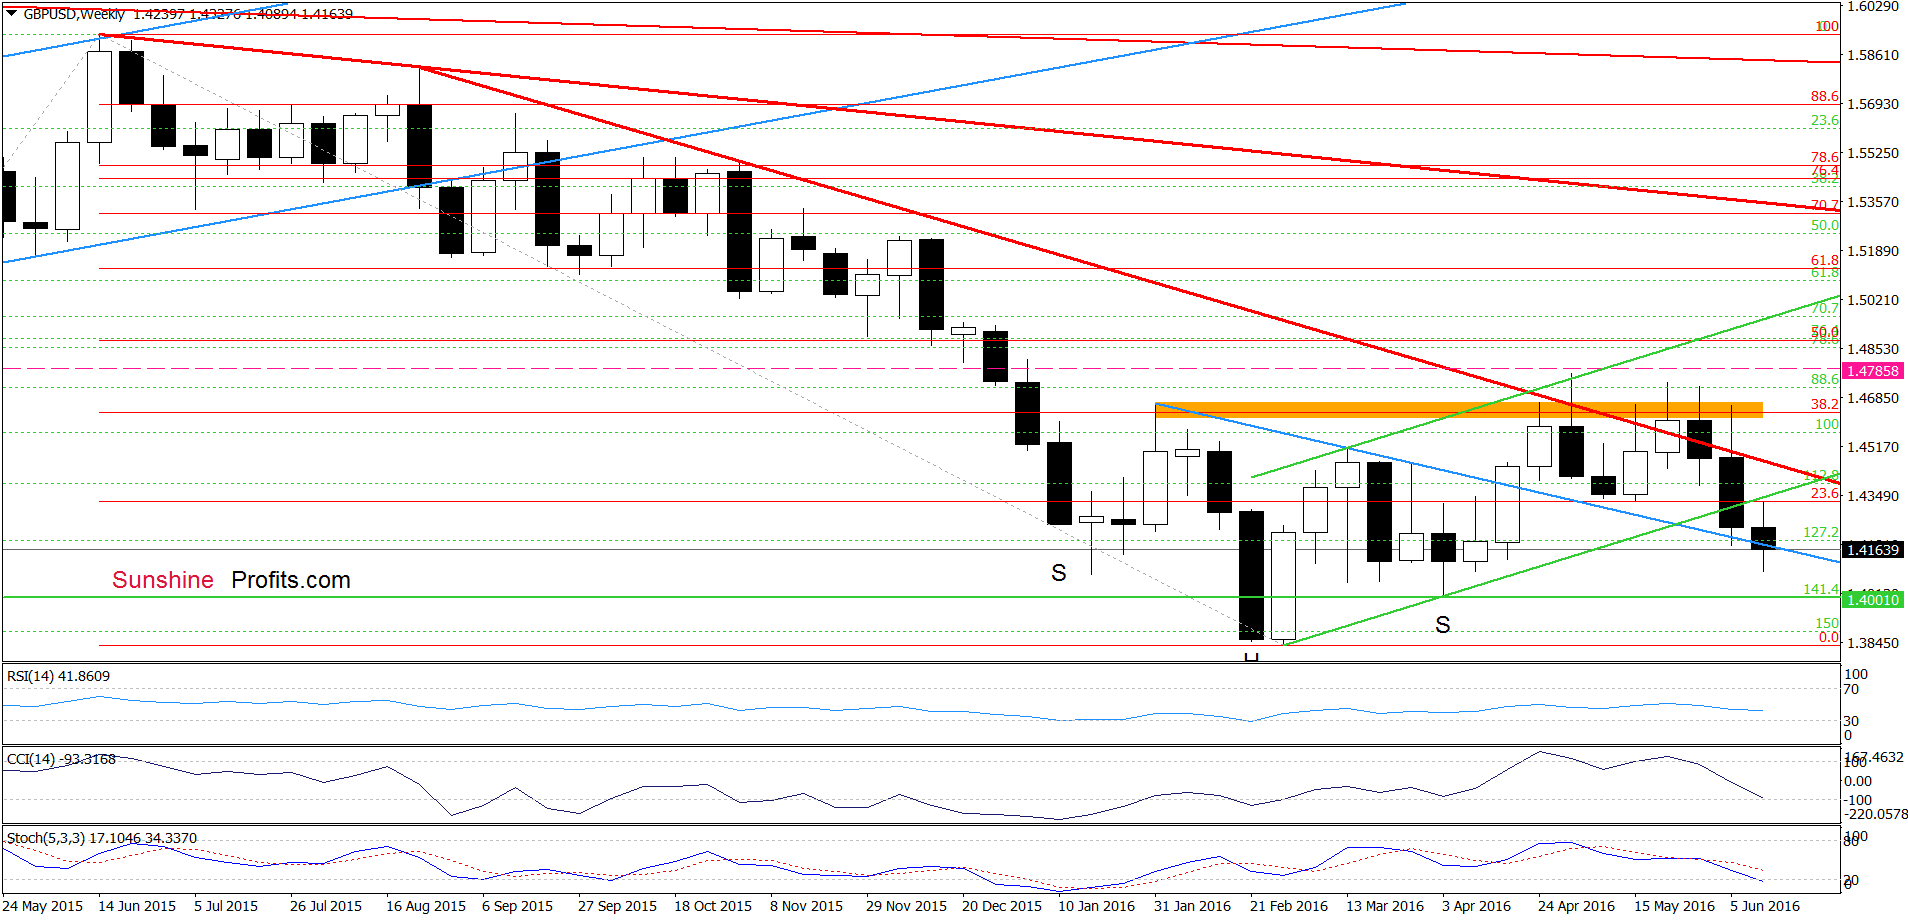
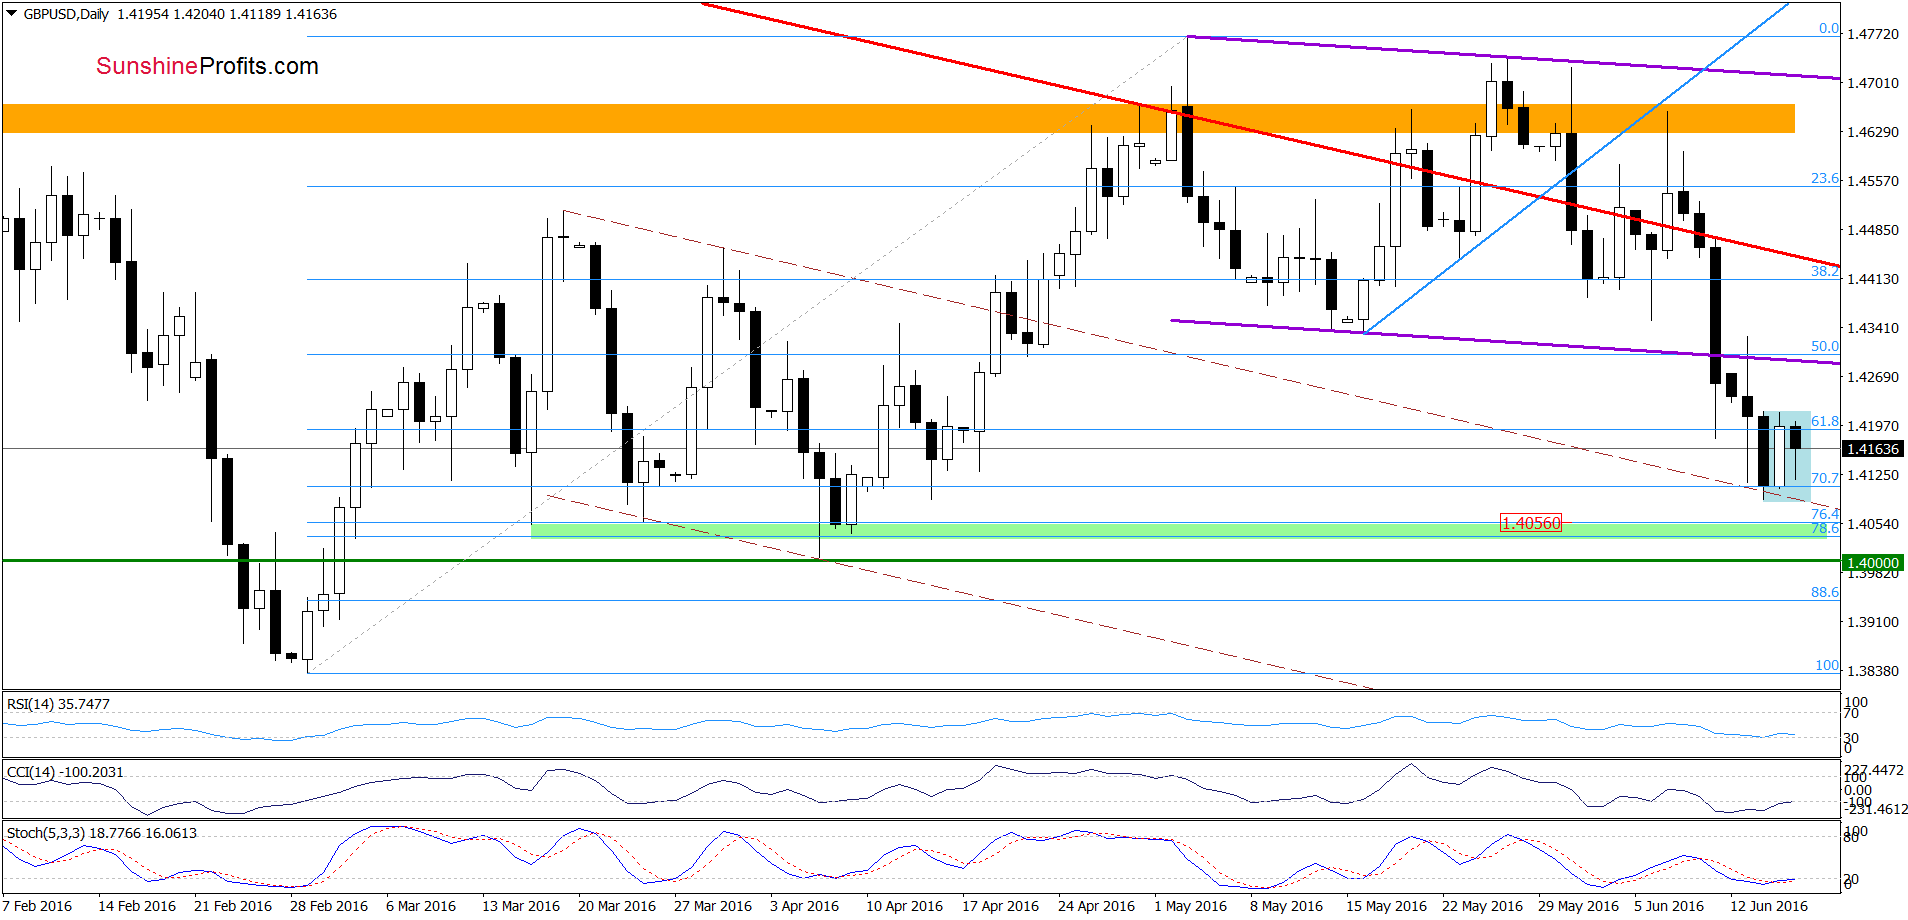
Looking at the charts, we see that although GBP/USD moved higher, the previously-broken blue support/resistance line (marked on the weekly chart) stopped further improvement yesterday. This negative signal triggered a decline earlier today, which suggests that we’ll see a re-test of recent lows in the coming day(s). Additionally, sell signals are still in play, supporting another attempt to move lower (at this point, please note that they are very close to generating buy signals, which suggests that the space for further declines may be limited). Taking this fact into account and another drop under the blue support line seen on the weekly chart, we think that the exchange rate will drop to the green support zone (created by the 76.4% and 78.6% Fibonacci retracement levels) in the coming day(s). If we see such price action, we’ll consider closing our profitable short positions.
Very short-term outlook: bearish
Short-term outlook: mixed with bearish bias
MT outlook: mixed with bearish bias
LT outlook: mixed
Trading position (short-term; our opinion): Short positions (with a stop-loss order at 1.4785 and downside target at 1.4056), which are already profitable are justified from the risk/reward perspective at the moment. We will keep you informed should anything change, or should we see a confirmation/invalidation of the above.
USD/CAD
Quoting our Monday’s alert:
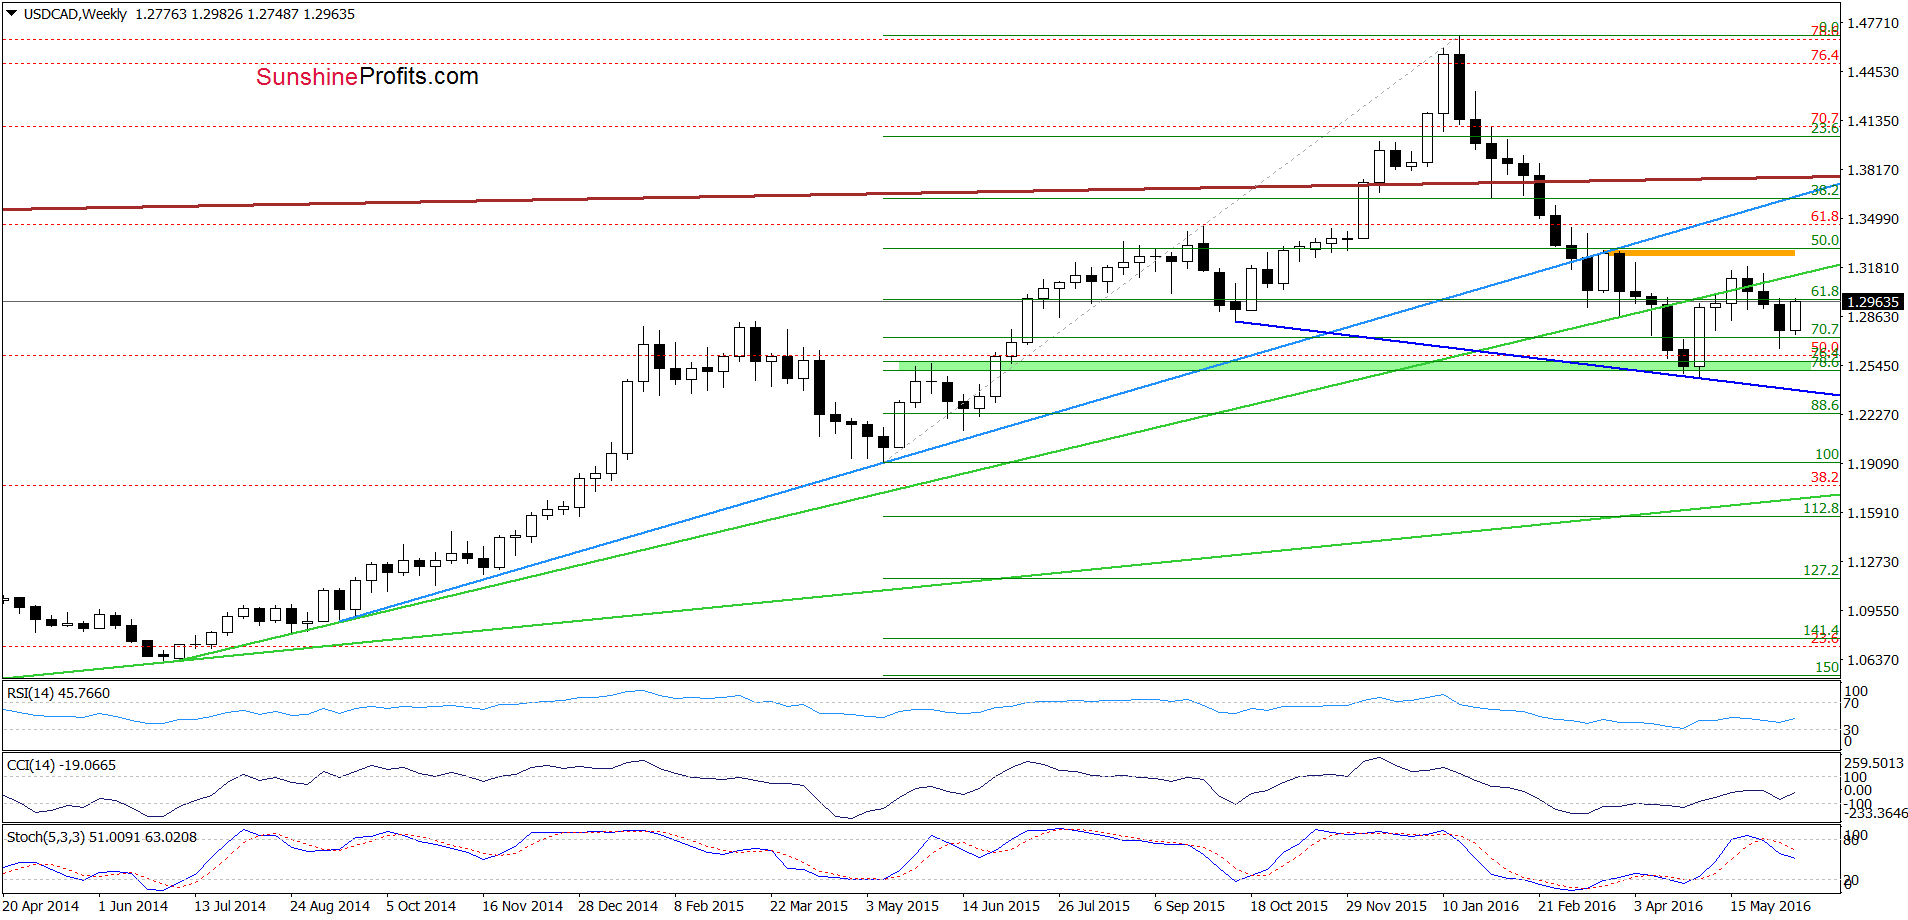
(…) invalidation of the breakdown below the 70.7% Fibonacci retracement (based on the May 2015 – Jan 2016 upward move) encouraged currency bulls to act and resulted in a small increase earlier today. Additionally, all indicators generated buy signals, which suggest that further improvement is just around the corner. If this is the case, and the exchange rate extends gains from here, USD/CAD will likely test the barrier of 1.3000 in the coming week.
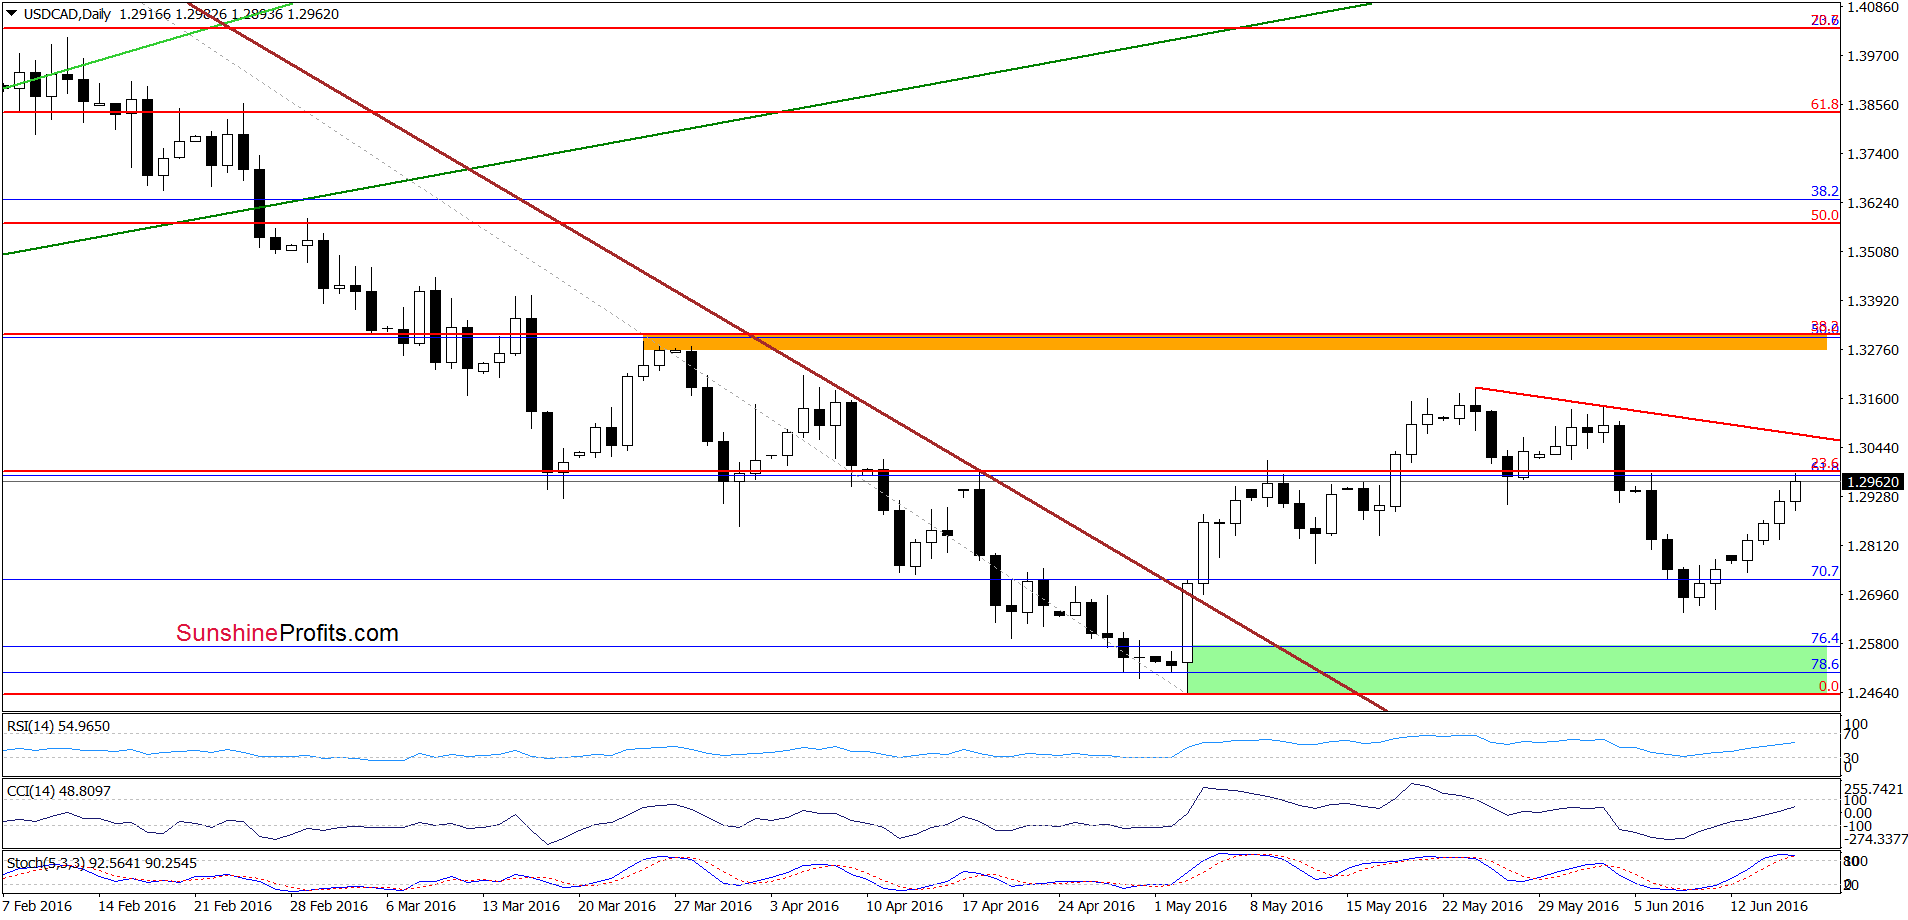
On the daily chart, we see that the situation developed in line with the above scenario and USD/CAD approached our upside target earlier today. What’s next? Although the barrier of 1.3000 could trigger a pullback later in the day, buy signals are still in play, supporting another attempt to move higher. If this is the case, and the exchange rate breaks above 1.300, we’ll likely see an increase to around 1.3071, where the short-term red declining resistance line (based on the previous highs) currently is. Nevertheless, at this point it is also worth noting that the Stochastic Oscillator is overbought, which suggests that the space for gains may be limited and reversal in near future should not surprise us.
Very short-term outlook: mixed with bullish bias
Short-term outlook: mixed
MT outlook: mixed
LT outlook: mixed
Trading position (short-term; our opinion): No positions are justified from the risk/reward perspective. We will keep you informed should anything change, or should we see a confirmation/invalidation of the above.
Thank you.
Nadia Simmons
Forex & Oil Trading Strategist
Przemyslaw Radomski, CFA
Founder, Editor-in-chief
Gold & Silver Trading Alerts
Forex Trading Alerts
Oil Investment Updates
Oil Trading Alerts

