

Earlier today, the price of crude oil extended losses below the barrier of $50, which affected negatively the commodity-related Canadian currency. As a result USD//CAD extended gains, but what happened at the same time with our other currency pairs?
In our opinion the following forex trading positions are justified - summary:
- EUR/USD: none
- GBP/USD: short (stop-loss order at 1.4785; initial downside target at 1.4220)
- USD/JPY: none
- USD/CAD: none
- USD/CHF: none
- AUD/USD: none
EUR/USD
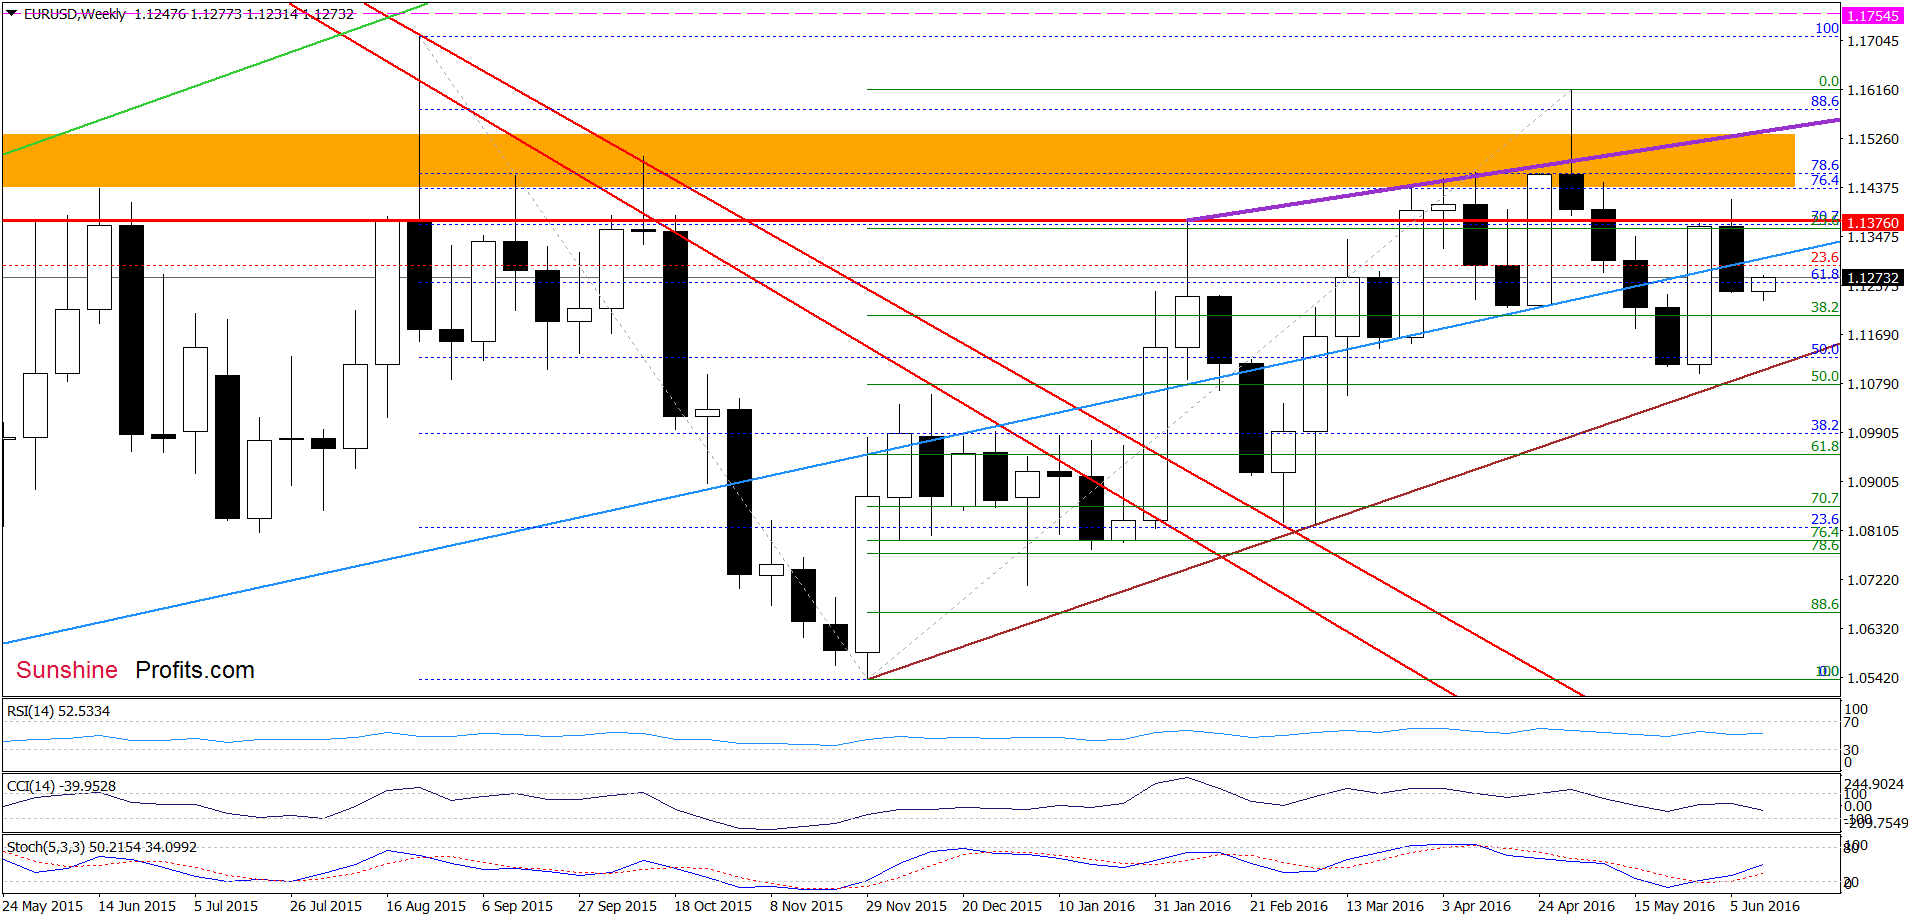
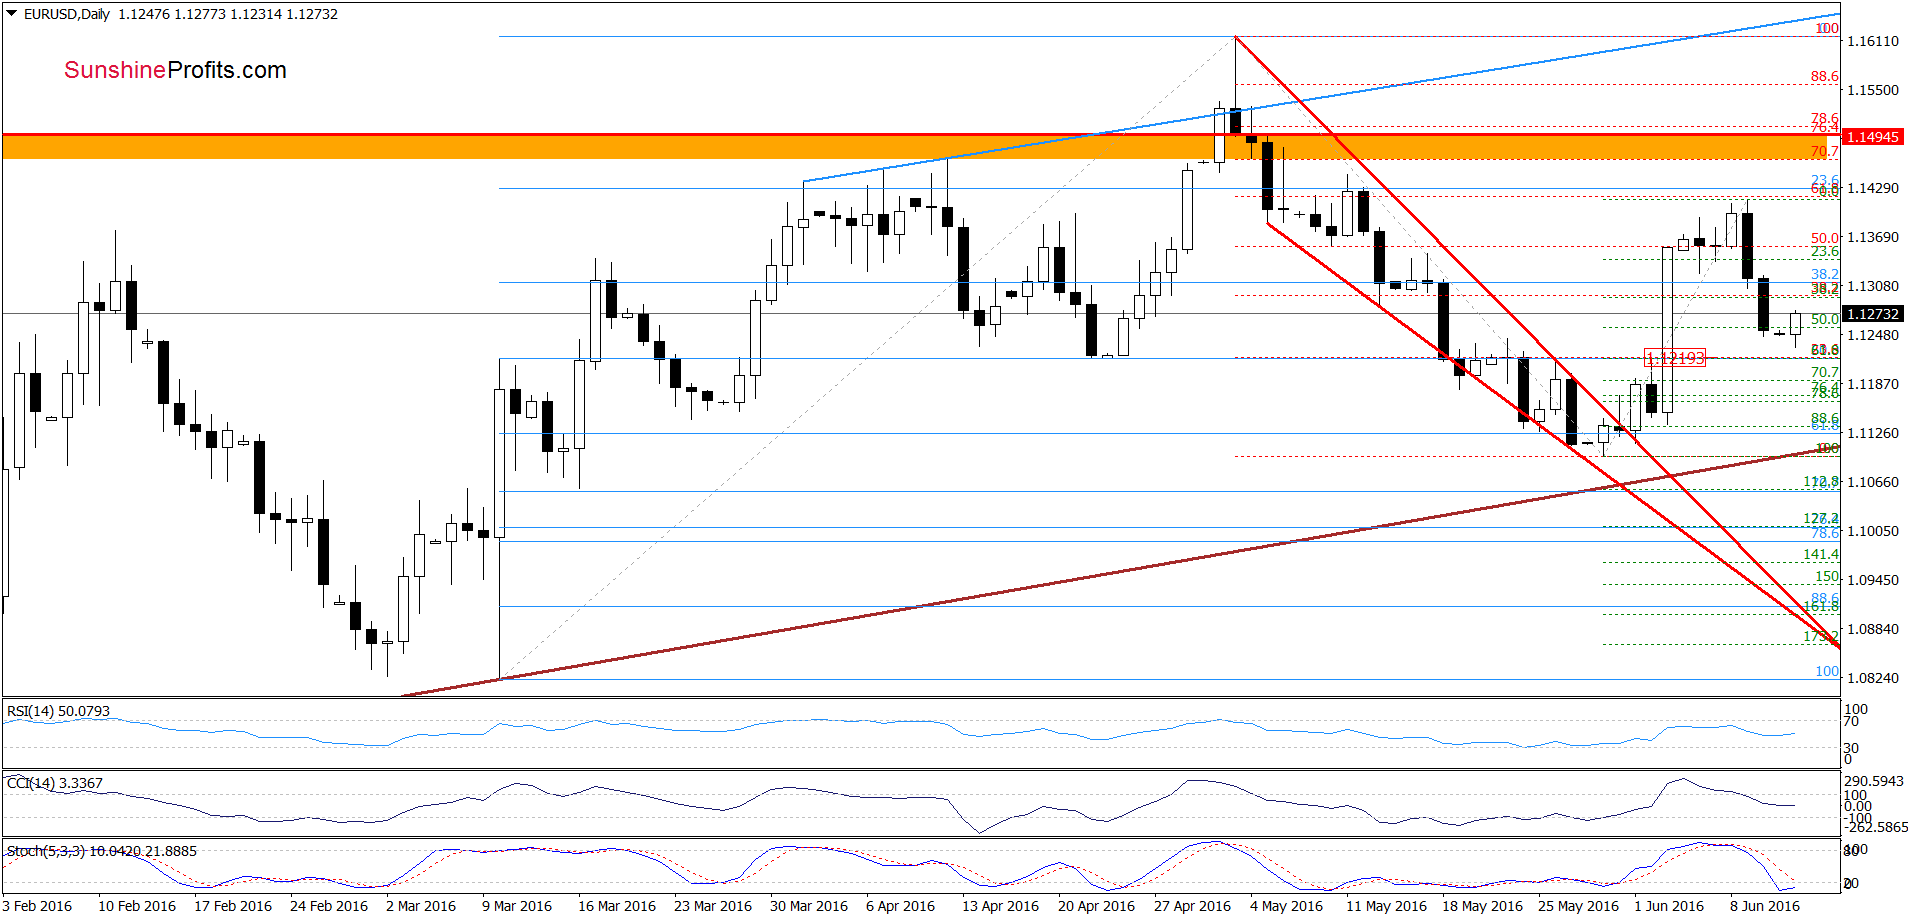
On the daily chart, we see that EUR/USD extended declines and dropped under the Friday’s low earlier today. Despite this move, currency bulls didn’t give up and pushed the pair higher in the following hours, invalidating earlier decrease under the 50% Fibonacci retracement. Although this is a positive signal, we should keep in mind that sell signals generated by the indicators remain in place, suggesting another attempt to move lower. If this is the case, we’ll likely see a decline to around 1.1219, where the 61.8% retracement (based on the May 30 – Jun 9 upward move) and the Jun 2 high are. If this area is broken, the next target would be the brown rising support line based on the Dec and Mar lows.
Very short-term outlook: mixed with bearish bias
Short-term outlook: mixed with bearish bias
MT outlook: mixed with bearish bias
LT outlook: mixed
Trading position (short-term; our opinion): No positions are justified from the risk/reward perspective. We will keep you informed should anything change, or should we see a confirmation/invalidation of the above.
GBP/USD
Quoting our last commentary on this currency pair:
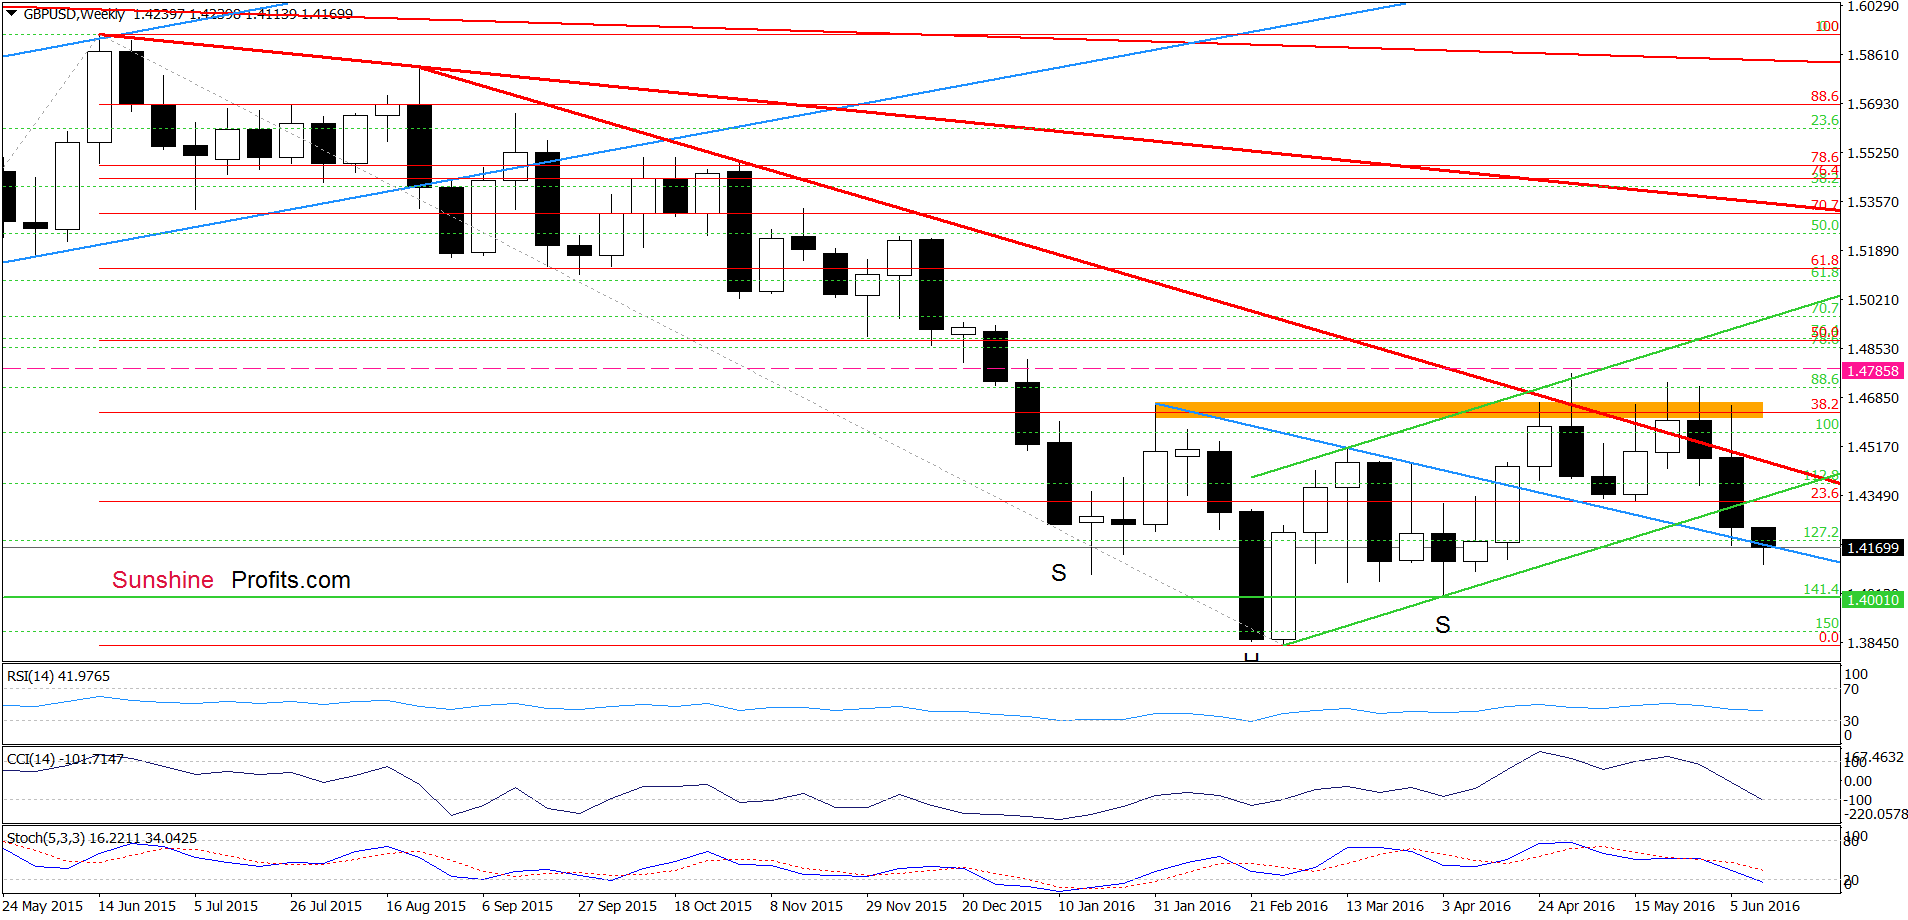
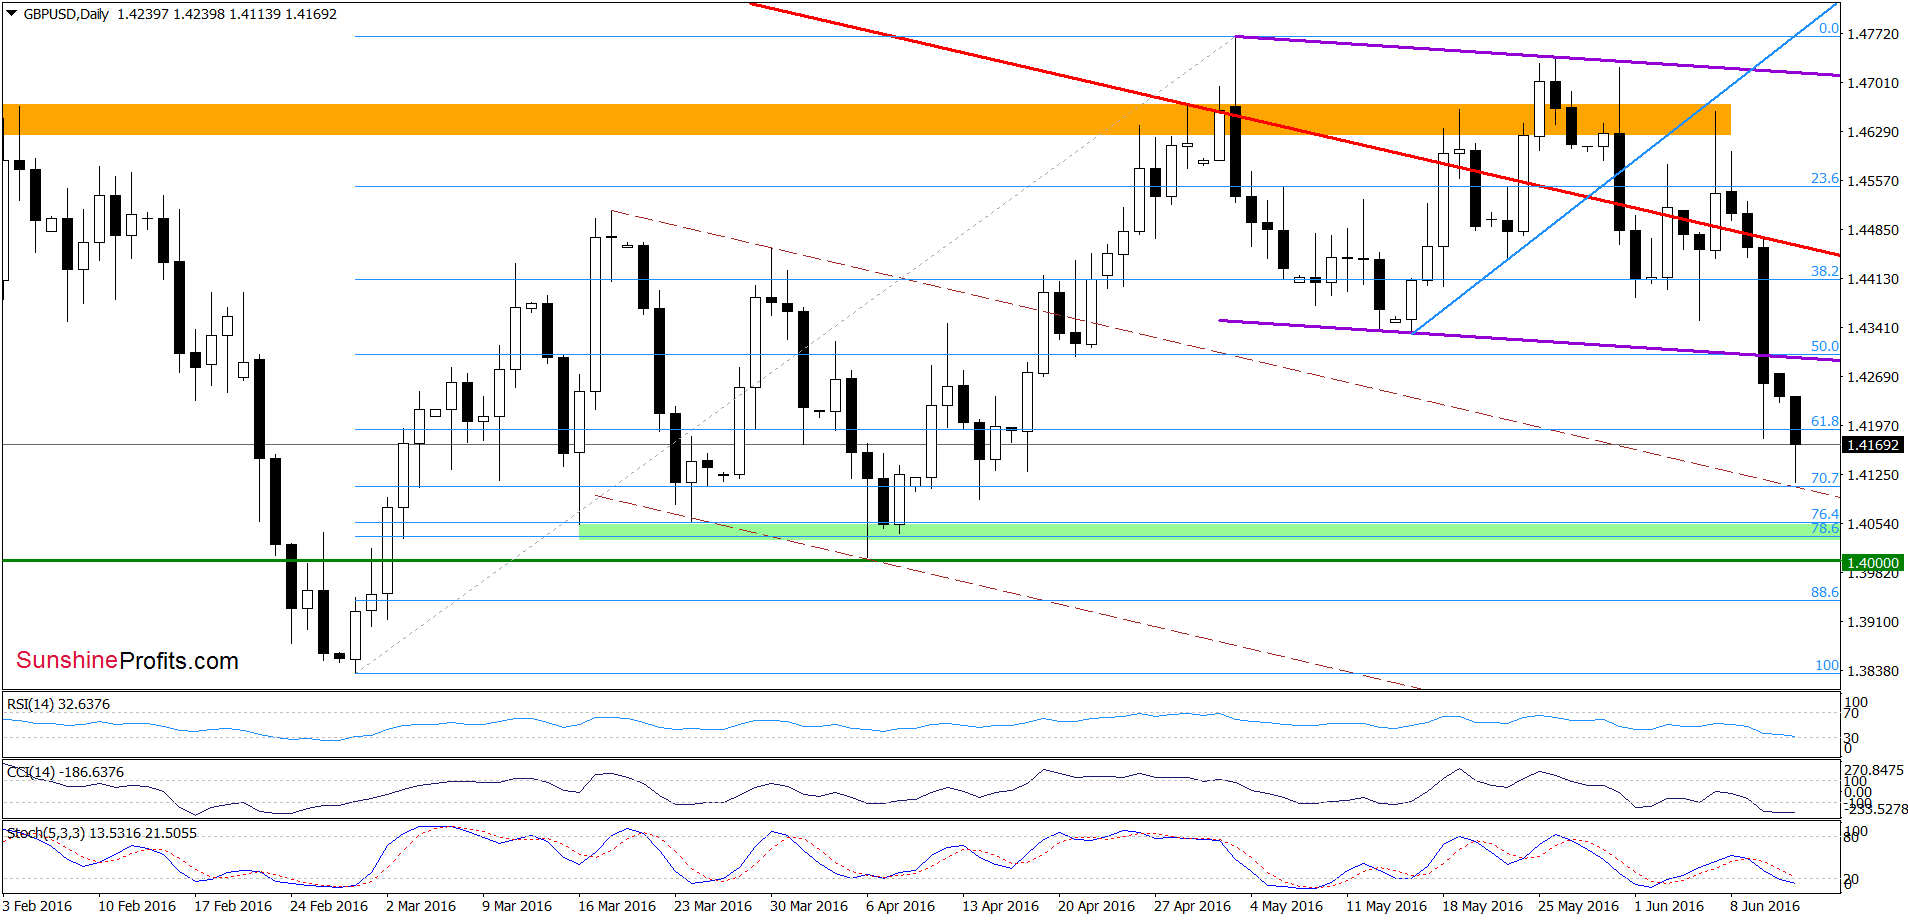
(…) the orange resistance zone stopped further improvement once again and triggered a downswing, which took the exchange rate under the long-term red declining support/resistance line. In this way, the pair invalidated earlier breakout, which is a negative signal that suggests further deterioration. Nevertheless, such price action would be more likely and reliable if the pair closes today’s session under the above-mentioned line. In this case, we’ll see another downswing and a test of the lower purple support line and the 50% Fibonacci retracement in the coming days.
Looking at the charts, we see that the situation developed in line with the above scenario and currency bears not only took the pair to our initial downside target, but also managed to push GBP/SD below it. With this move, the exchange rate dropped below the blue support line (seen on the weekly chart) and reached the brown dashed declining line (marked on the daily chart), which triggered a rebound in the following hours. Despite this move, sell signals generated by the indicators still support currency bears and the pair remains under the lower border of the purple declining trend channel, which suggests another attempt to move lower and a test of the green support zone in the coming days.
Very short-term outlook: bearish
Short-term outlook: bearish
MT outlook: mixed with bearish bias
LT outlook: mixed
Trading position (short-term; our opinion): Short positions (with a stop-loss order at 1.4785 and initial downside target at 1.4220) are justified from the risk/reward perspective at the moment. We will keep you informed should anything change, or should we see a confirmation/invalidation of the above.
USD/JPY
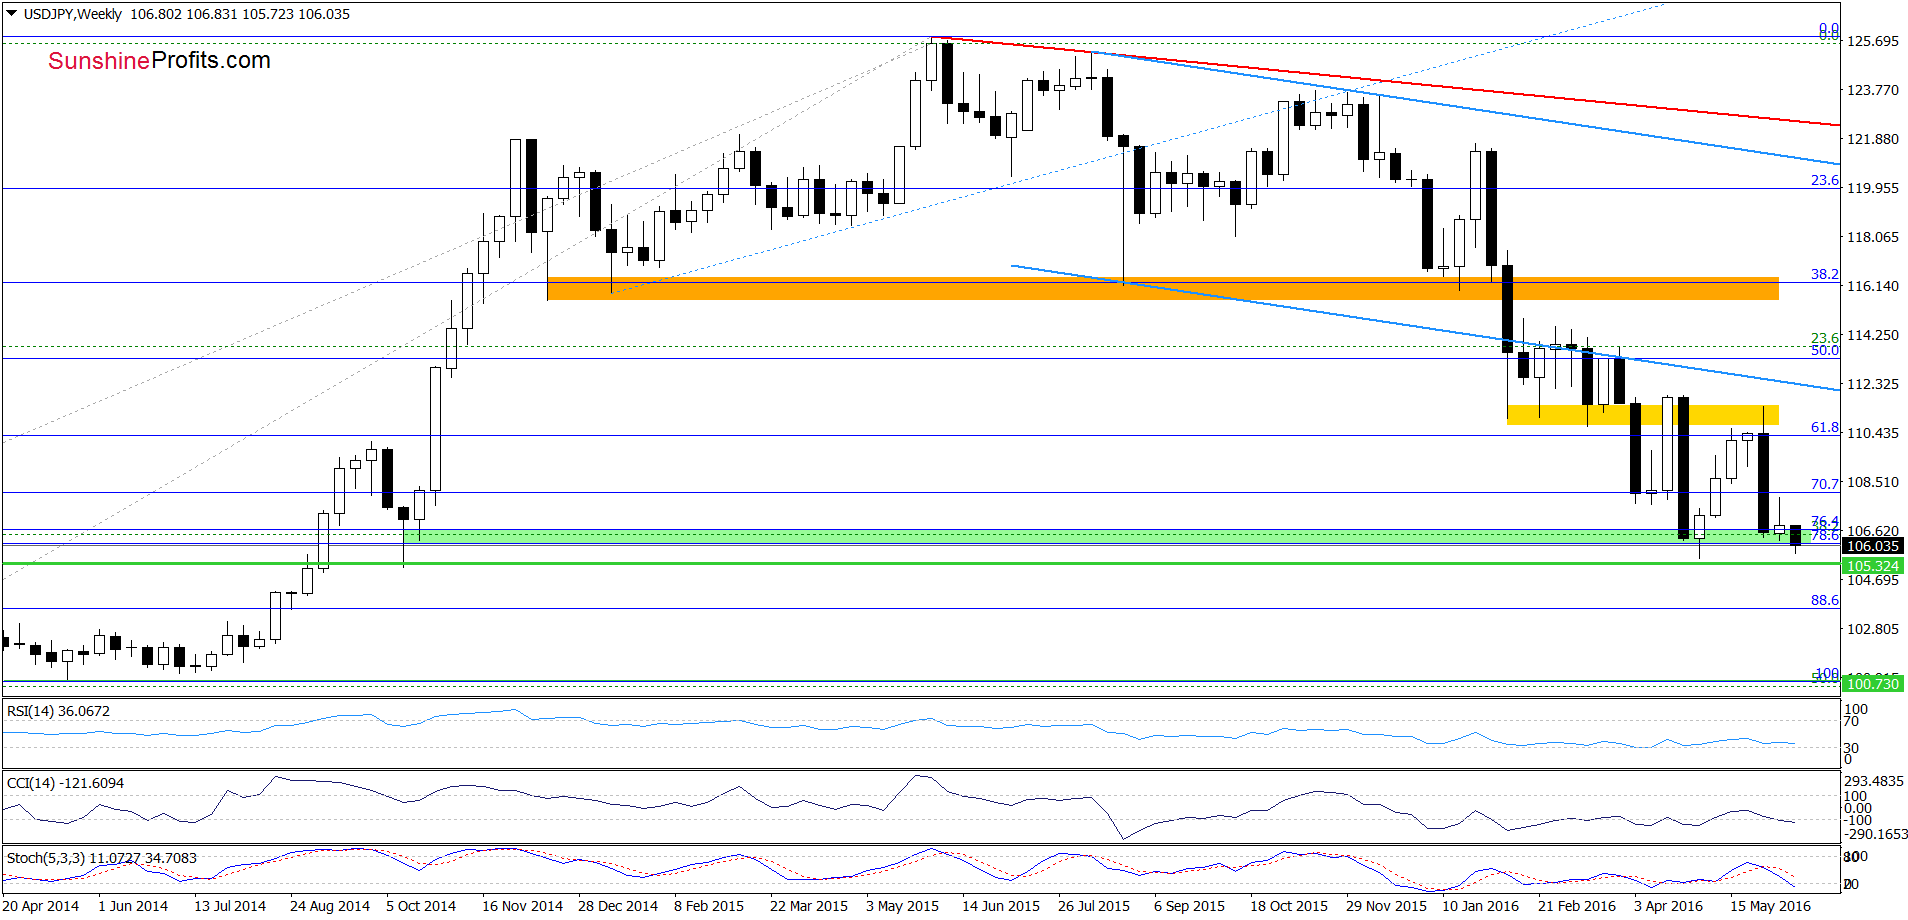
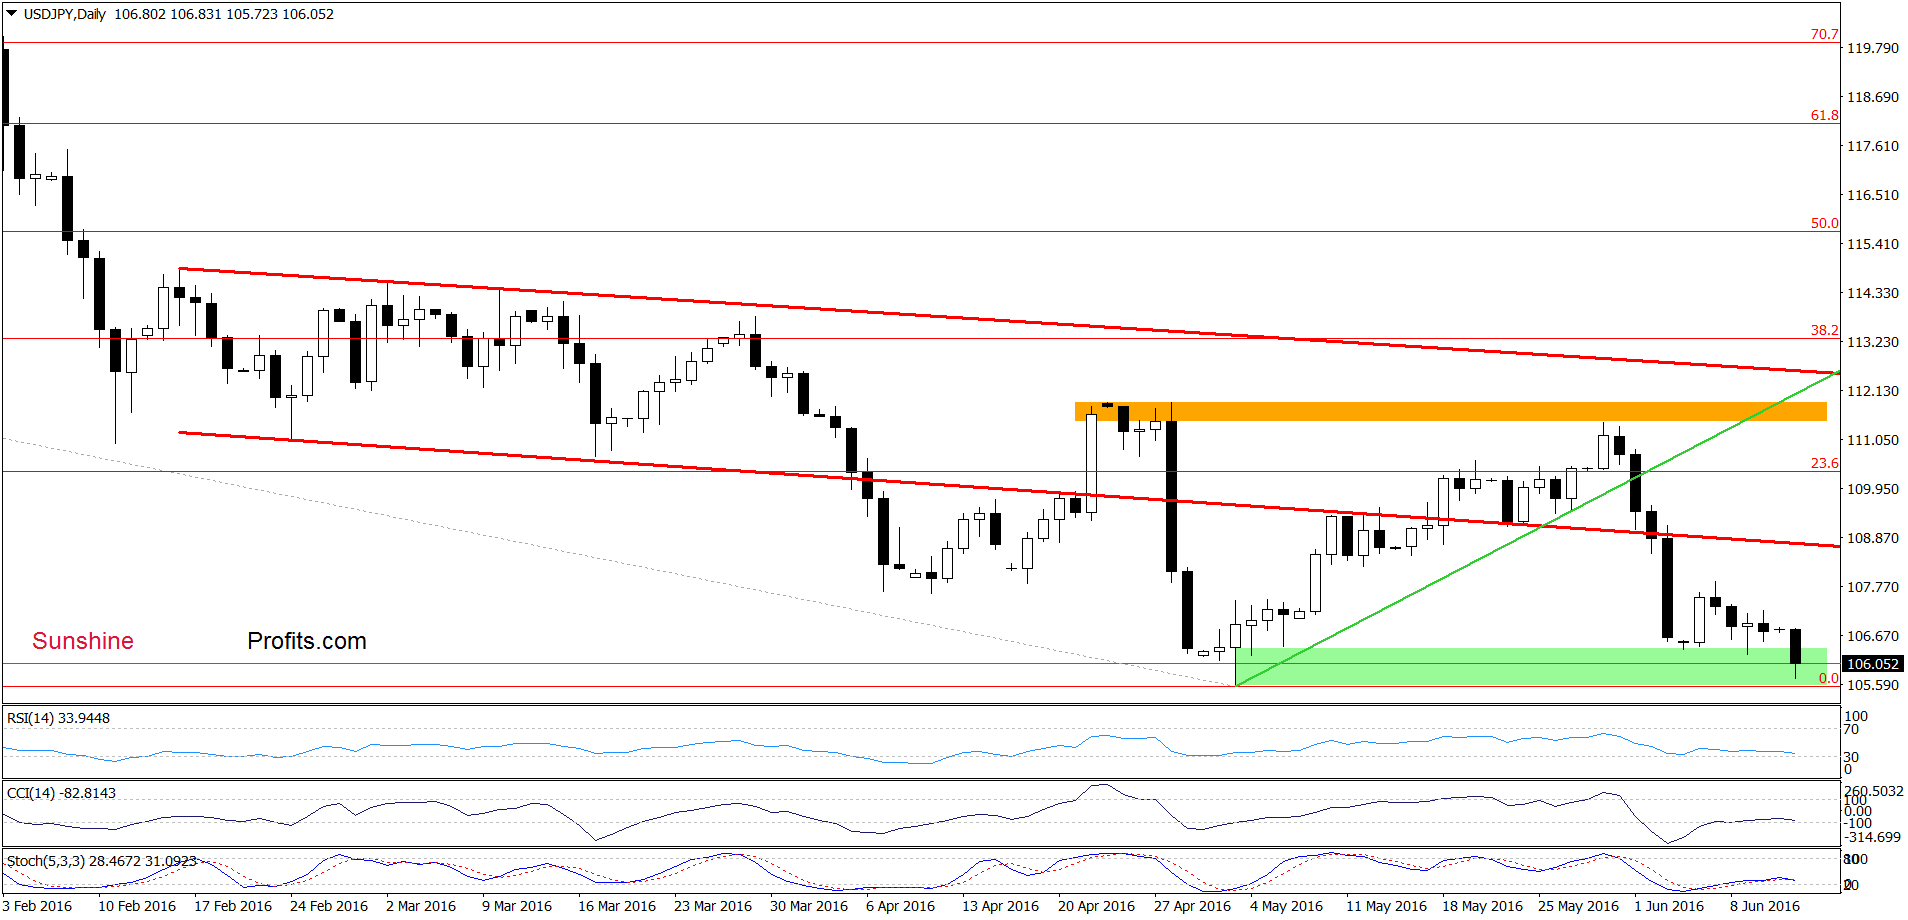
From today’s point of view, we see that USD/JPY moved lower and reached the green support zone (marked on the weekly chart) earlier today. As you see, this area was strong enough to stop currency bears at the beginning of May, which suggests that we may see similar price action in the coming days – especially when we factor in buy signals generated by the daily CCI and Stochastic Oscillator. If this is the case and the pair rebounds from here, we’ll see a test of the last week’s high of 107.89.
Very short-term outlook: mixed with bullish bias
Short-term outlook: mixed
MT outlook: mixed
LT outlook: mixed
Trading position (short-term; our opinion): No positions are justified from the risk/reward perspective at the moment. We will keep you informed should anything change, or should we see a confirmation/invalidation of the above.
USD/CAD
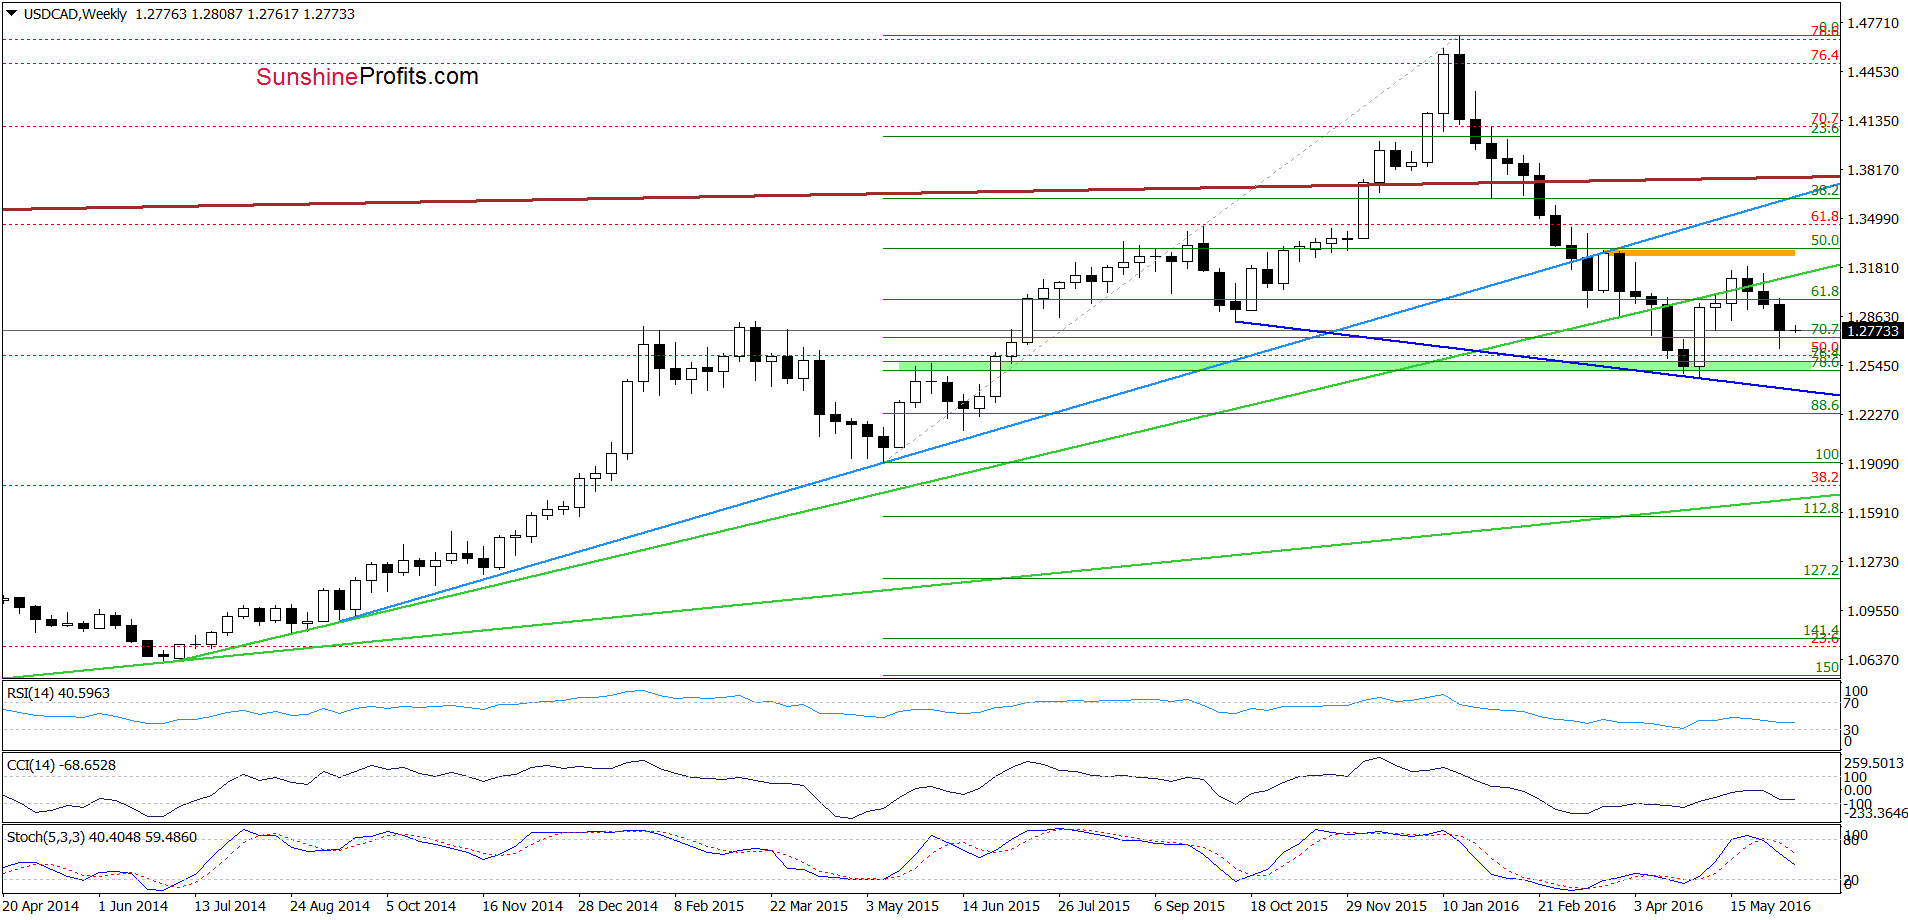
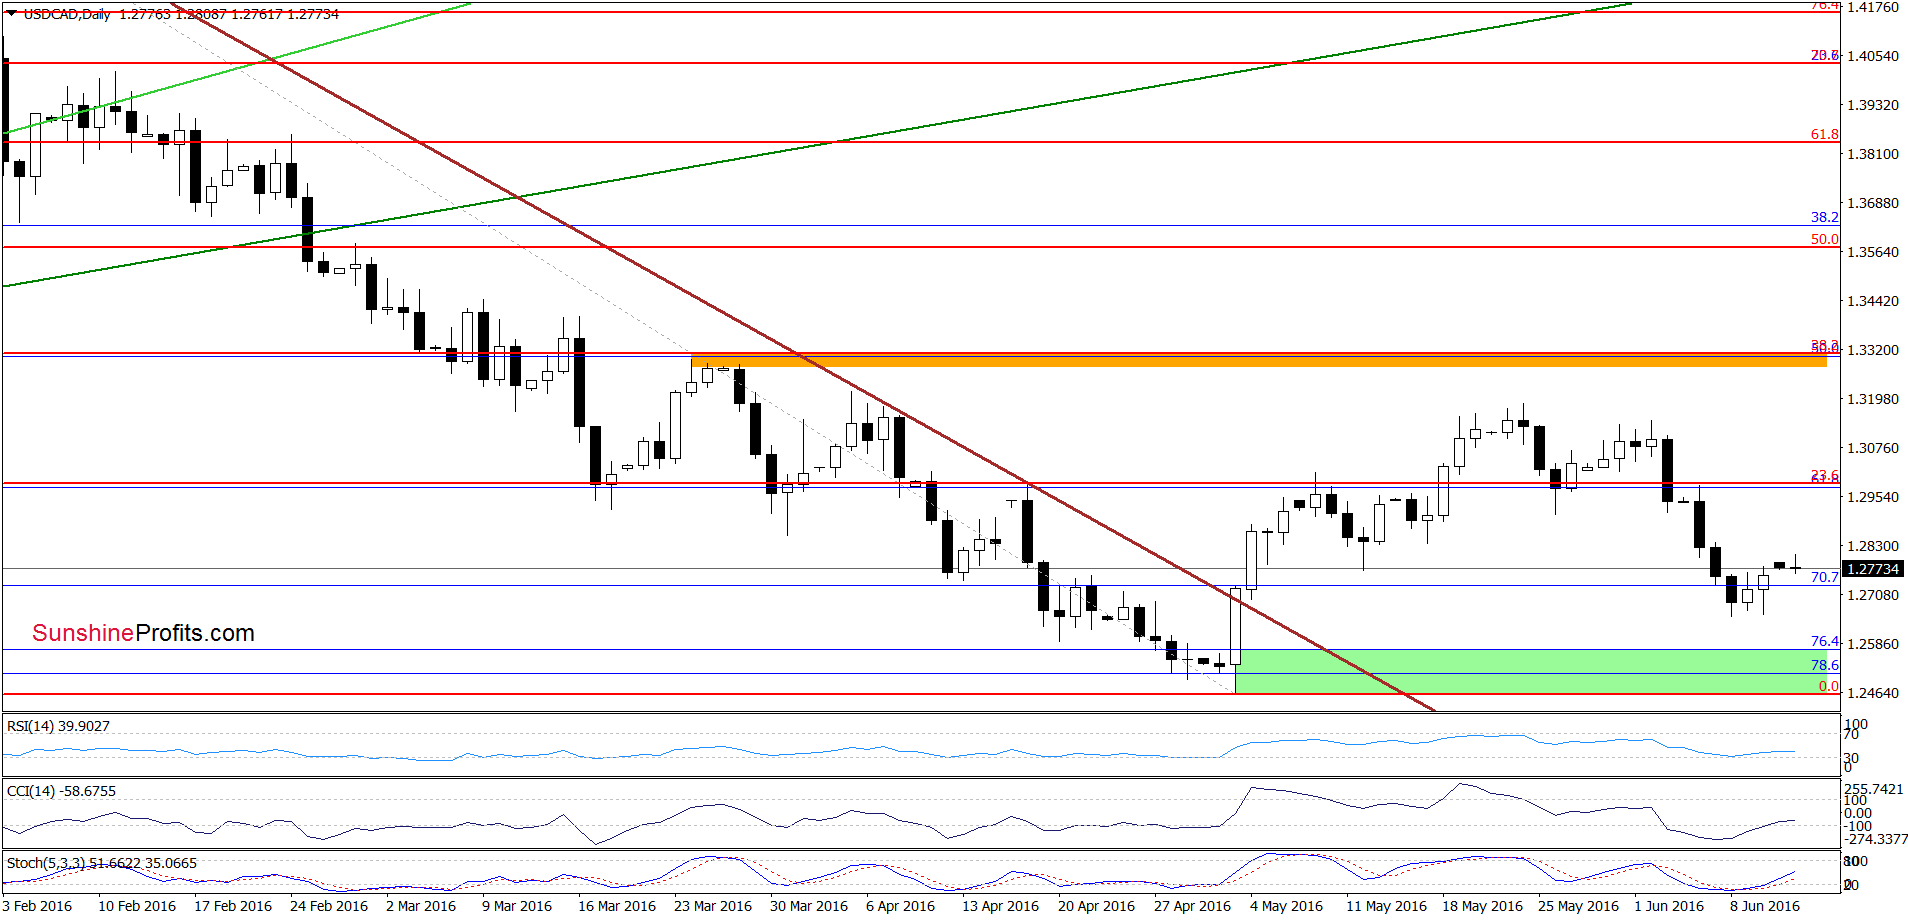
On the above charts, we see that invalidation of the breakdown below the 70.7% Fibonacci retracement (based on the May 2015 – Jan 2016 upward move) encouraged currency bulls to act and resulted in a small increase earlier today. Additionally, all indicators generated buy signals, which suggest that further improvement is just around the corner. If this is the case, and the exchange rate extends gains from here, USD/CAD will likely test the barrier of 1.3000 in the coming week.
Very short-term outlook: mixed with bullish bias
Short-term outlook: mixed
MT outlook: mixed
LT outlook: mixed
Trading position (short-term; our opinion): No positions are justified from the risk/reward perspective. We will keep you informed should anything change, or should we see a confirmation/invalidation of the above.
USD/CHF
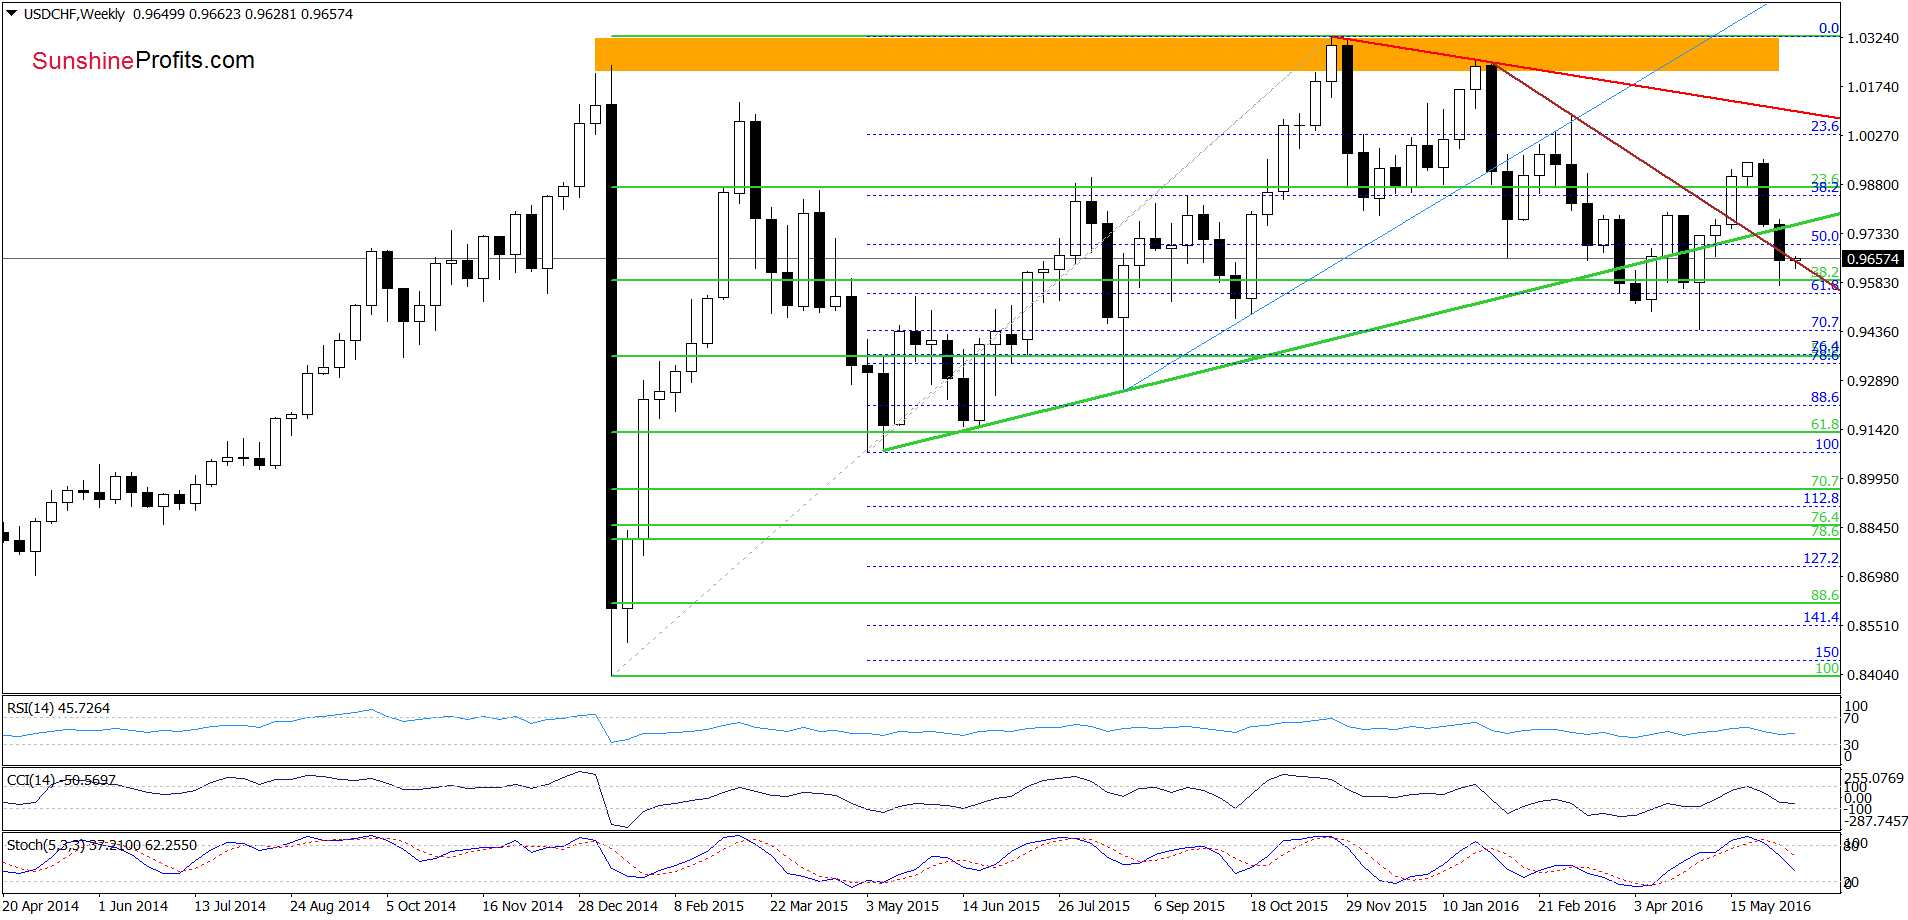
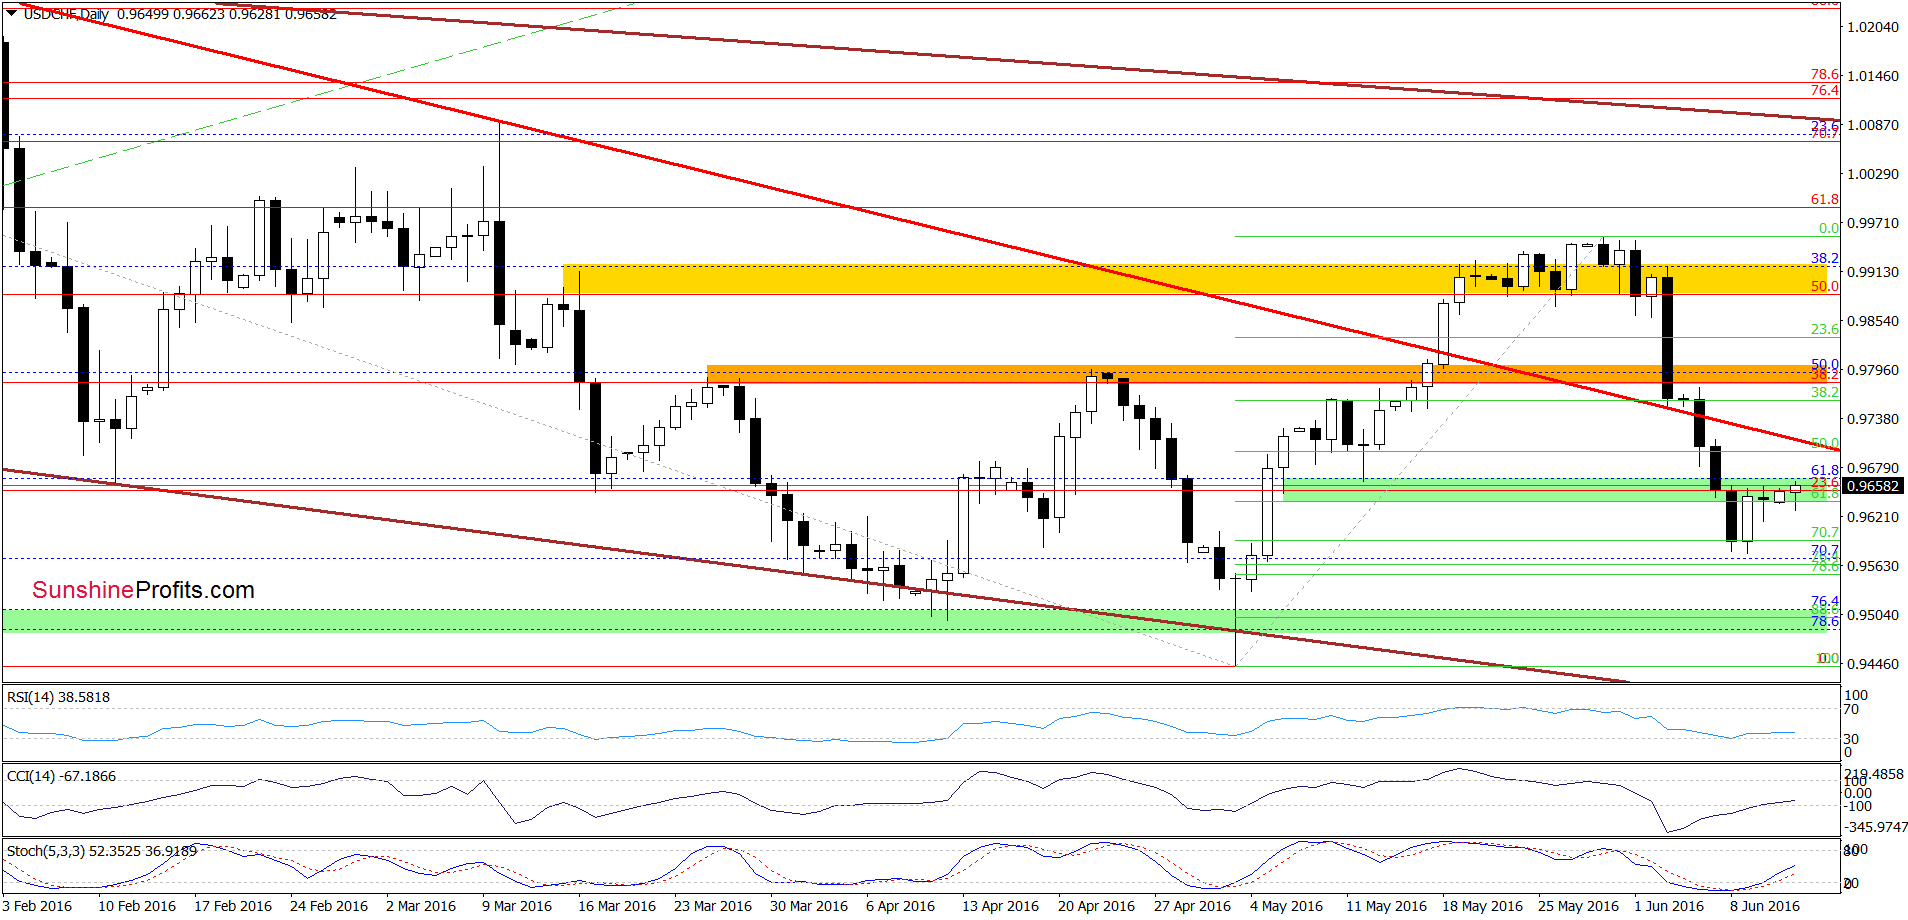
On the above charts, we see that USD/CHF moved little higher earlier today, while buy signals remain in place, which means that what we wrote on Thursday is up-to-date also today:
(…) the exchange rate reached the 38.2% Fibonacci retracement based on the entire Jan 2015 - Nov 2015 upward move (marked on the weekly chart) and the 70.7% retracement based on the May rally (seen on the daily chart), which triggered a rebound earlier today. Taking this fact into account, and combining it with the current position of the daily indicators (they are very close to generating buy signals), we think that further improvement is just around the corner. If this is the case, we’ll see (at least) a comeback to the red declining resistance line (…) in the coming days.
Very short-term outlook: mixed with bullish bias
Short-term outlook: mixed
MT outlook: mixed
LT outlook: mixed
Trading position (short-term; our opinion): No positions are justified from the risk/reward perspective. We will keep you informed should anything change, or should we see a confirmation/invalidation of the above.
AUD/USD
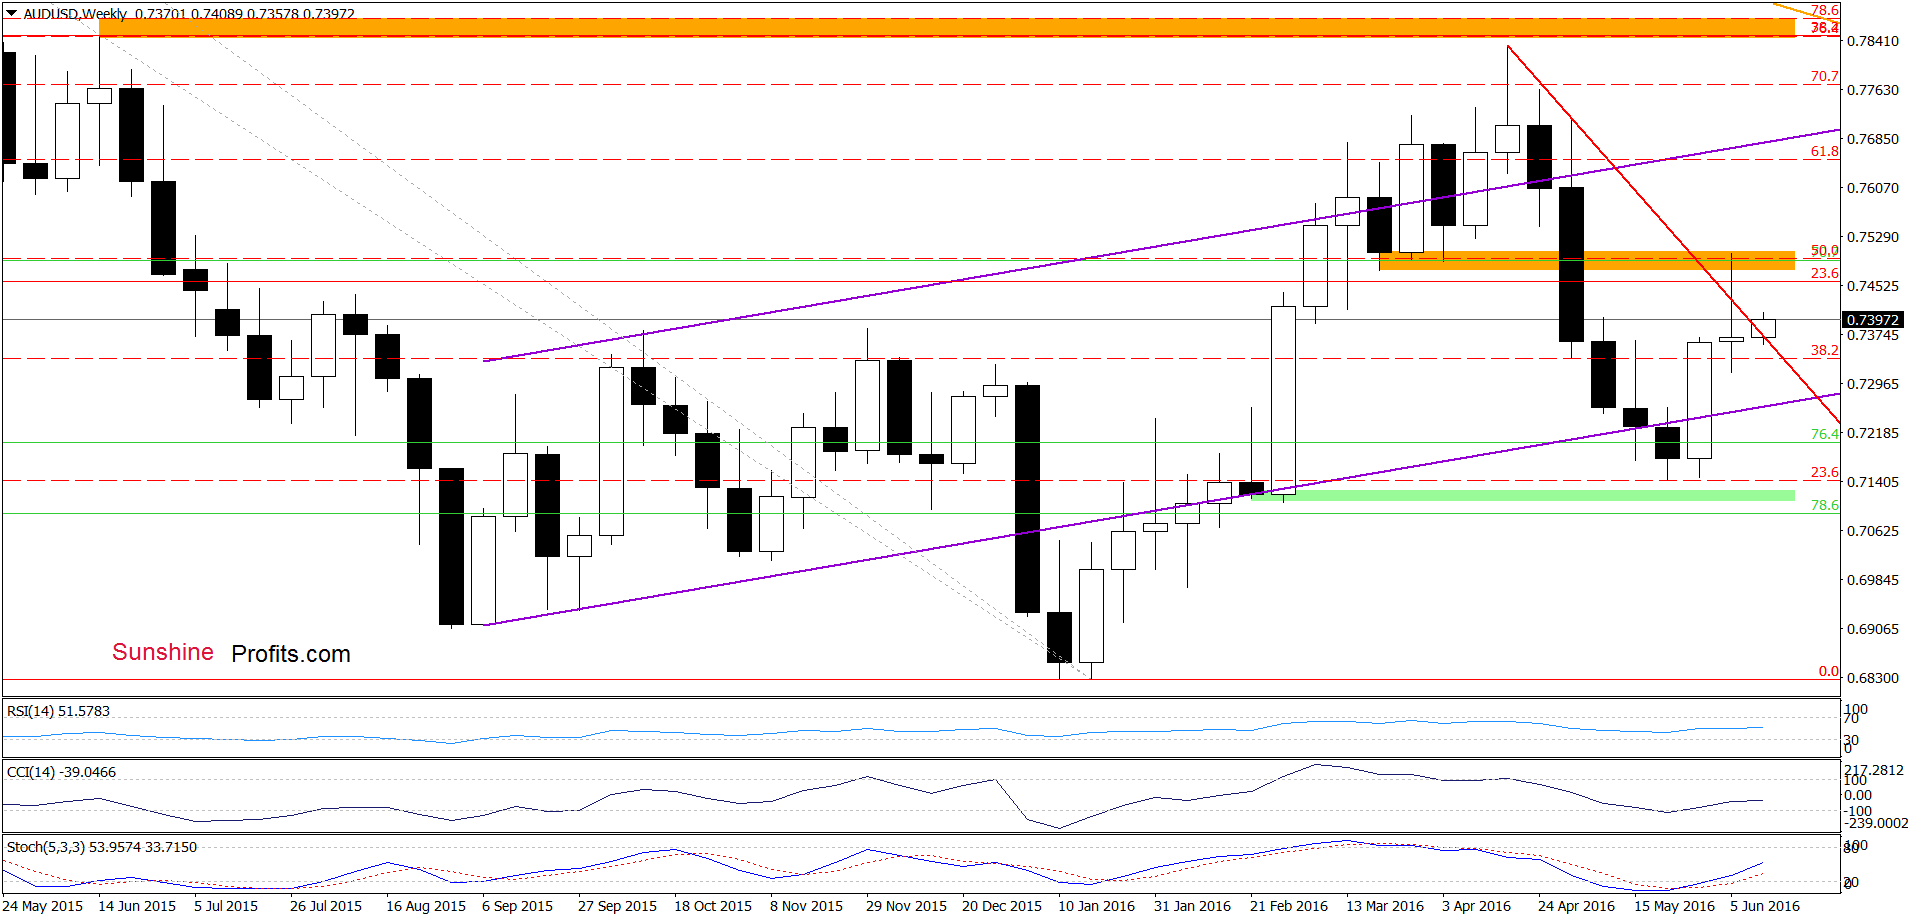
The first thing that catches the eye on the weekly chart is a comeback above the red declining resistance line, which in combination with buy signals generated by the indicators, suggests further improvement in the coming days. Nevertheless, such price action would be more likely and reliable if the pair closes this week above this line. Until this time, another downswing can’t be ruled out.
Can we infer something more from the daily chart? Let’s check.
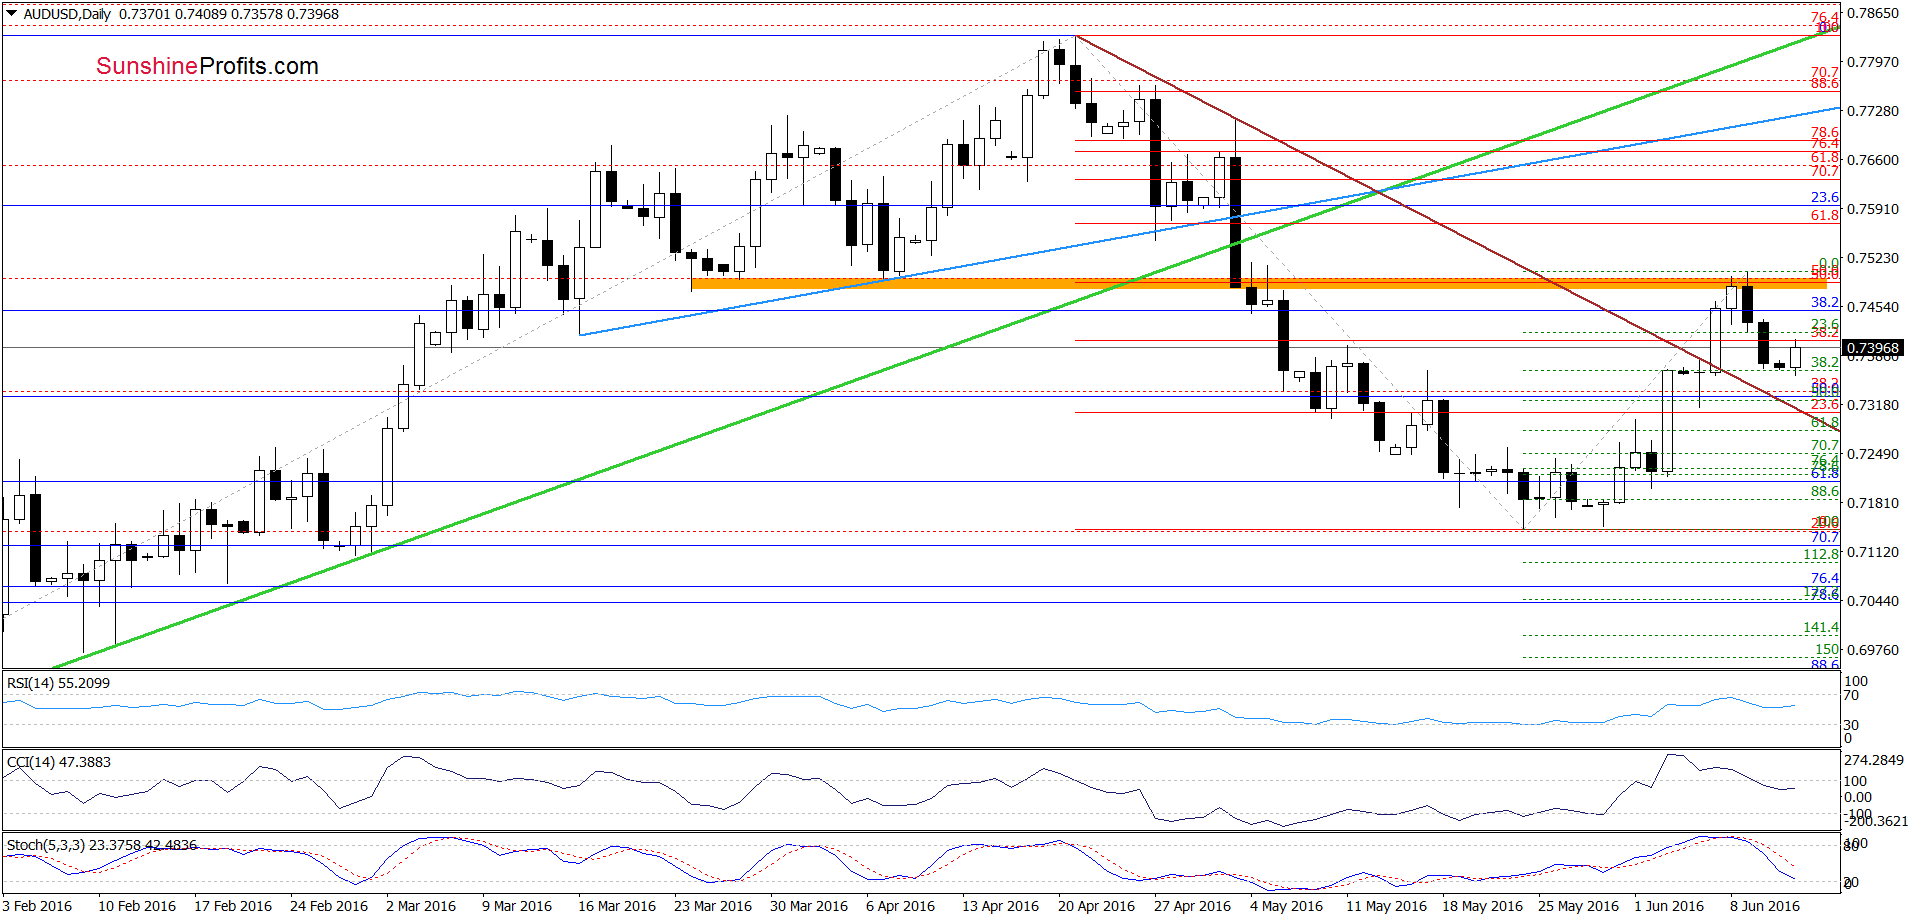
From this perspective we see that the exchange rate dropped to the 38.2% Fibonacci retracement based on the recent upward move, which resulted in a rebound earlier today. Although this is a positive signal that suggests further improvement, we should keep in mind that sell signals are still in play, which suggests that another attempt to move lower is likely. If this is the case, the initial downside target would be the brown declining line, which serves now as the nearest support.
Very short-term outlook: mixed
Short-term outlook: mixed
MT outlook: mixed
LT outlook: mixed
Trading position (short-term; our opinion): No positions are justified from the risk/reward perspective. We will keep you informed should anything change, or should we see a confirmation/invalidation of the above.
Thank you.
Nadia Simmons
Forex & Oil Trading Strategist
Przemyslaw Radomski, CFA
Founder, Editor-in-chief
Gold & Silver Trading Alerts
Forex Trading Alerts
Oil Investment Updates
Oil Trading Alerts

