

Although official data showed that the volume of exported goods increased by £2.2 billion from a month earlier and imports rose by £2 billion, uncertainty around the June 23 EU Brexit referendum pushed the British currency lower against the greenback. As a result, GBP/USD dropped under the long-term line, invalidating earlier breakout. What does it mean for the exchange rate?
In our opinion the following forex trading positions are justified - summary:
- EUR/USD: none
- GBP/USD: short (stop-loss order at 1.4785; initial downside target at 1.4220)
- USD/JPY: none
- USD/CAD: none
- USD/CHF: none
- AUD/USD: none
EUR/USD
On Monday, we wrote the following:
(…) as long as there won’t be sell signals another attempt to move higher (to the 61.8% retracement and the May 11 and May 12 highs) is likely.
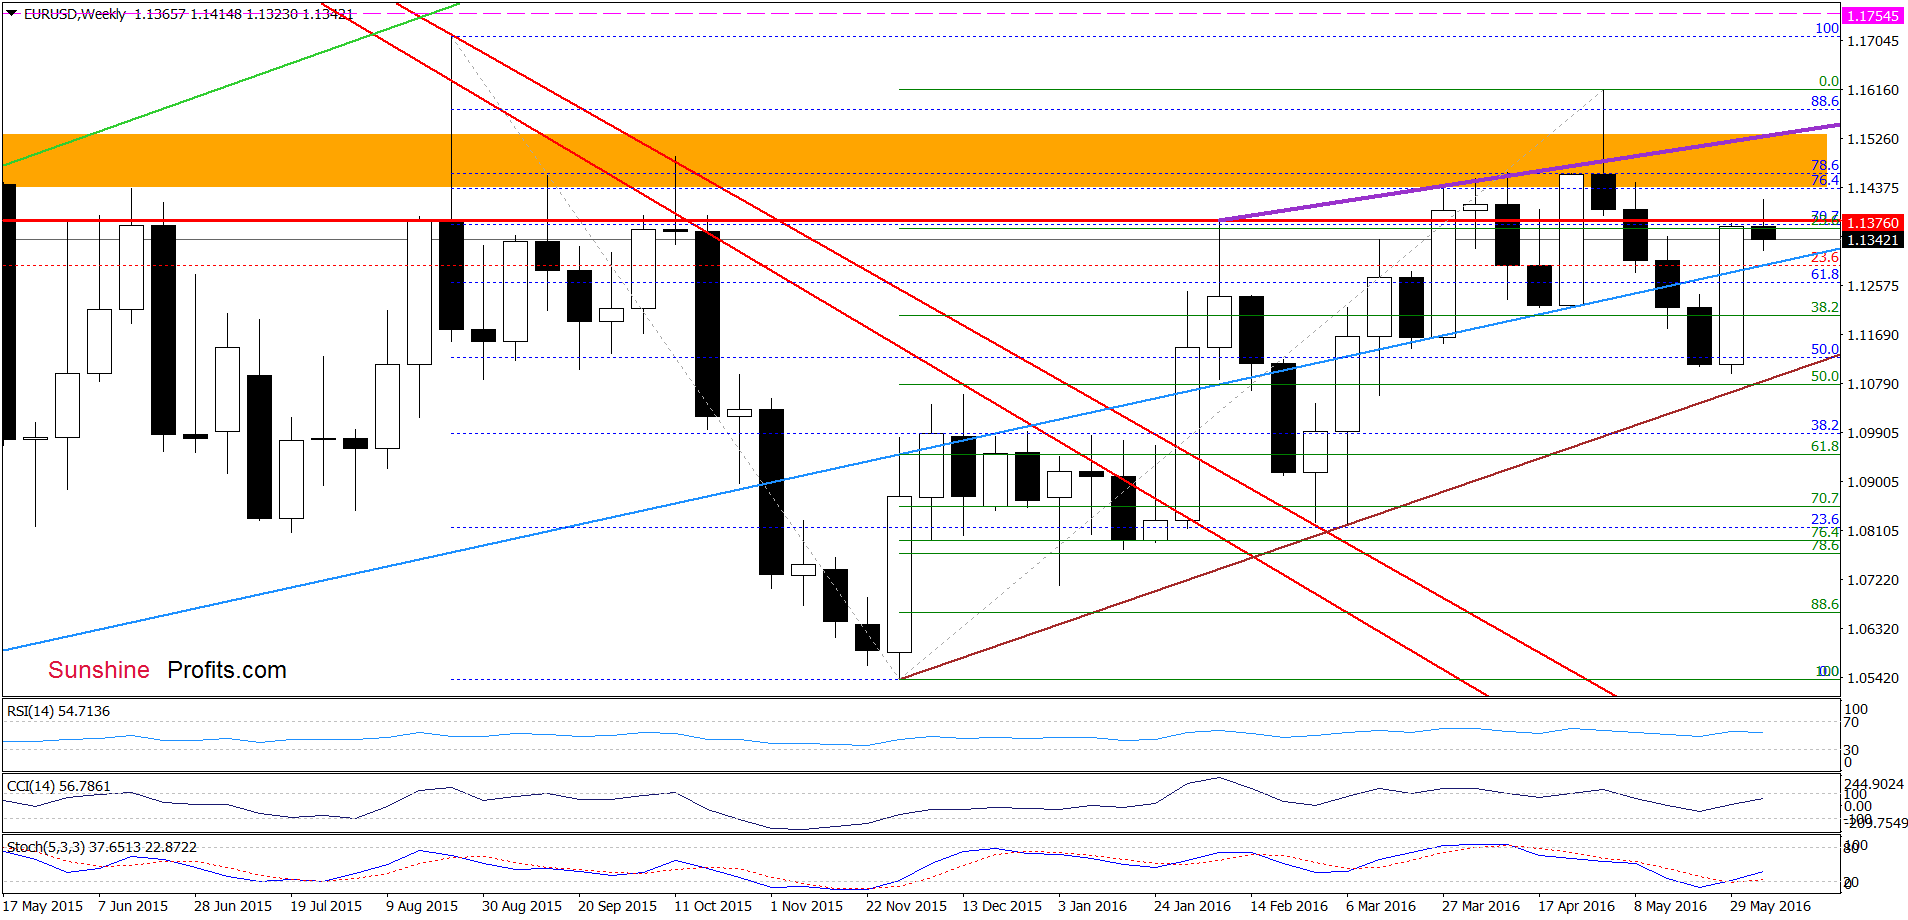
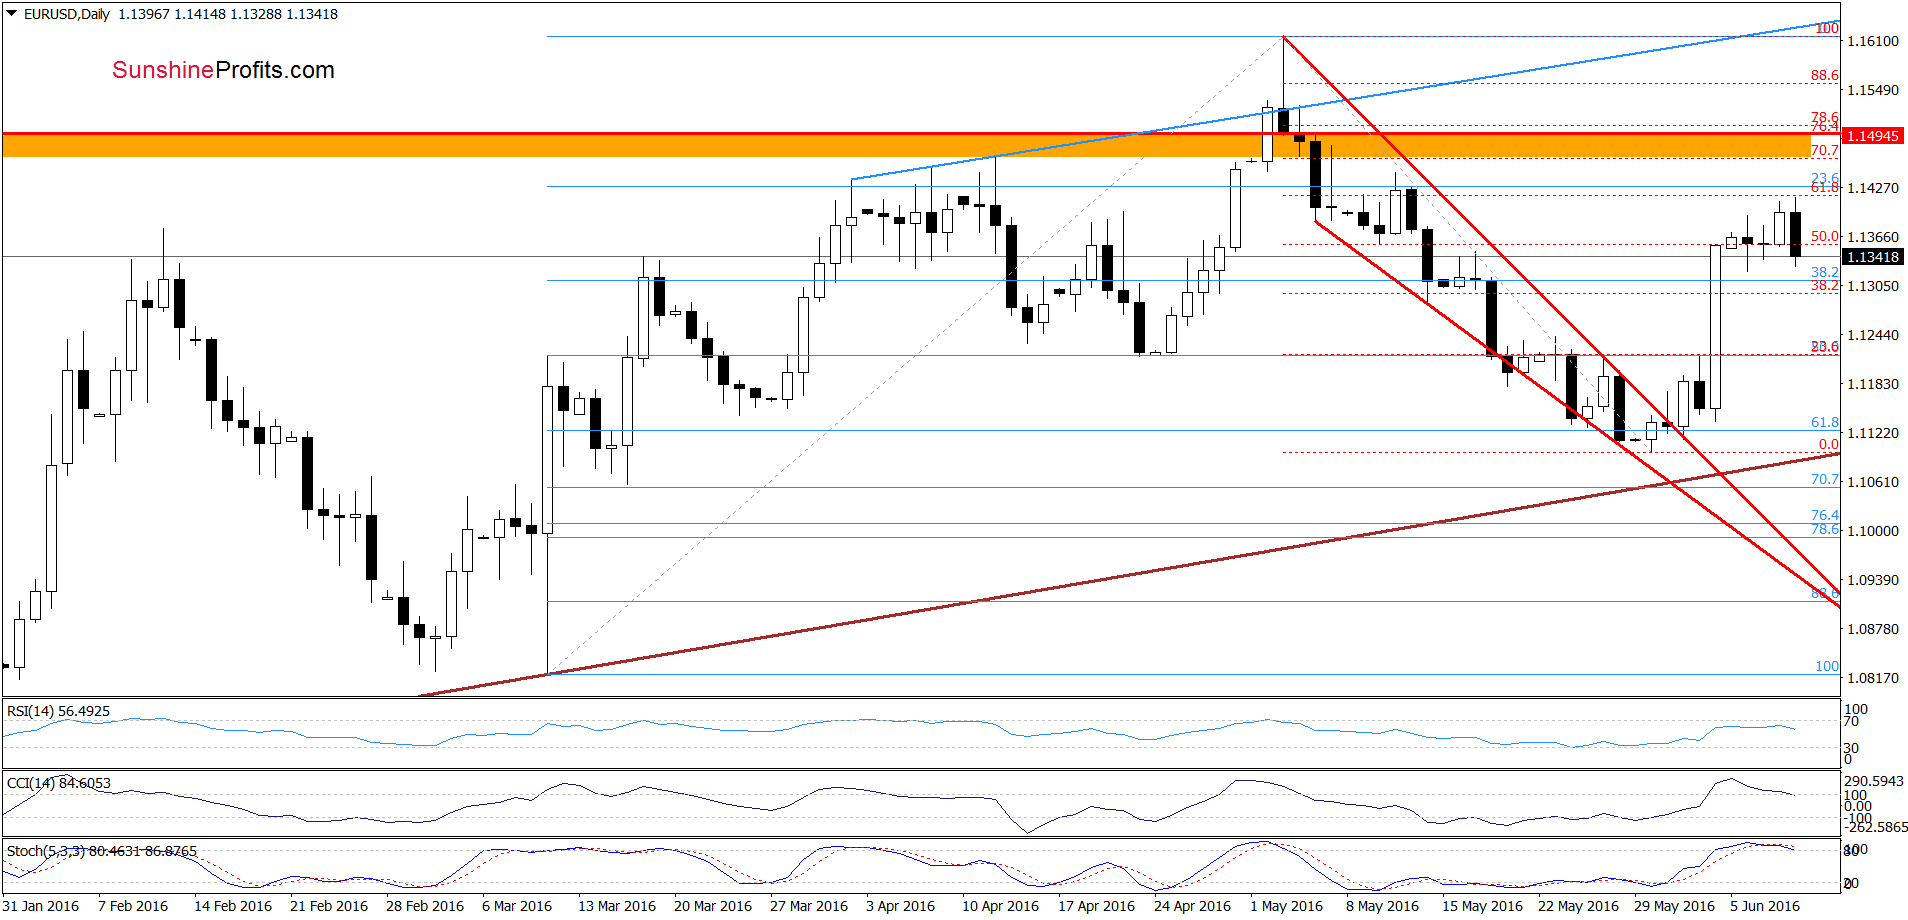
Looking at the daily chart, we see that the situation developed in line with the above scenario and EUR/USD increased to the 61.8% retracement earlier today. As you see this resistance level encouraged currency bears to act, which resulted in a pullback. Additionally, the CCI generated a sell signal, while the Stochastic Oscillator is very close to doing the same, which suggests lower values of the exchange rate in the coming days. Therefore, if the pair drops under Monday’s low of 1.1323, we’ll likely see a decline to around 1.1219, where the 61.8% retracement (based on the May 30 – Jun 9 upward move) and the Jun 2 high are. If this area is broken, the next target would be the brown rising support line based on the Dec and Mar lows (currently around May 30 low).
Very short-term outlook: mixed with bearish bias
Short-term outlook: mixed with bearish bias
MT outlook: mixed
LT outlook: mixed
Trading position (short-term; our opinion): No positions are justified from the risk/reward perspective. We will keep you informed should anything change, or should we see a confirmation/invalidation of the above.
GBP/USD
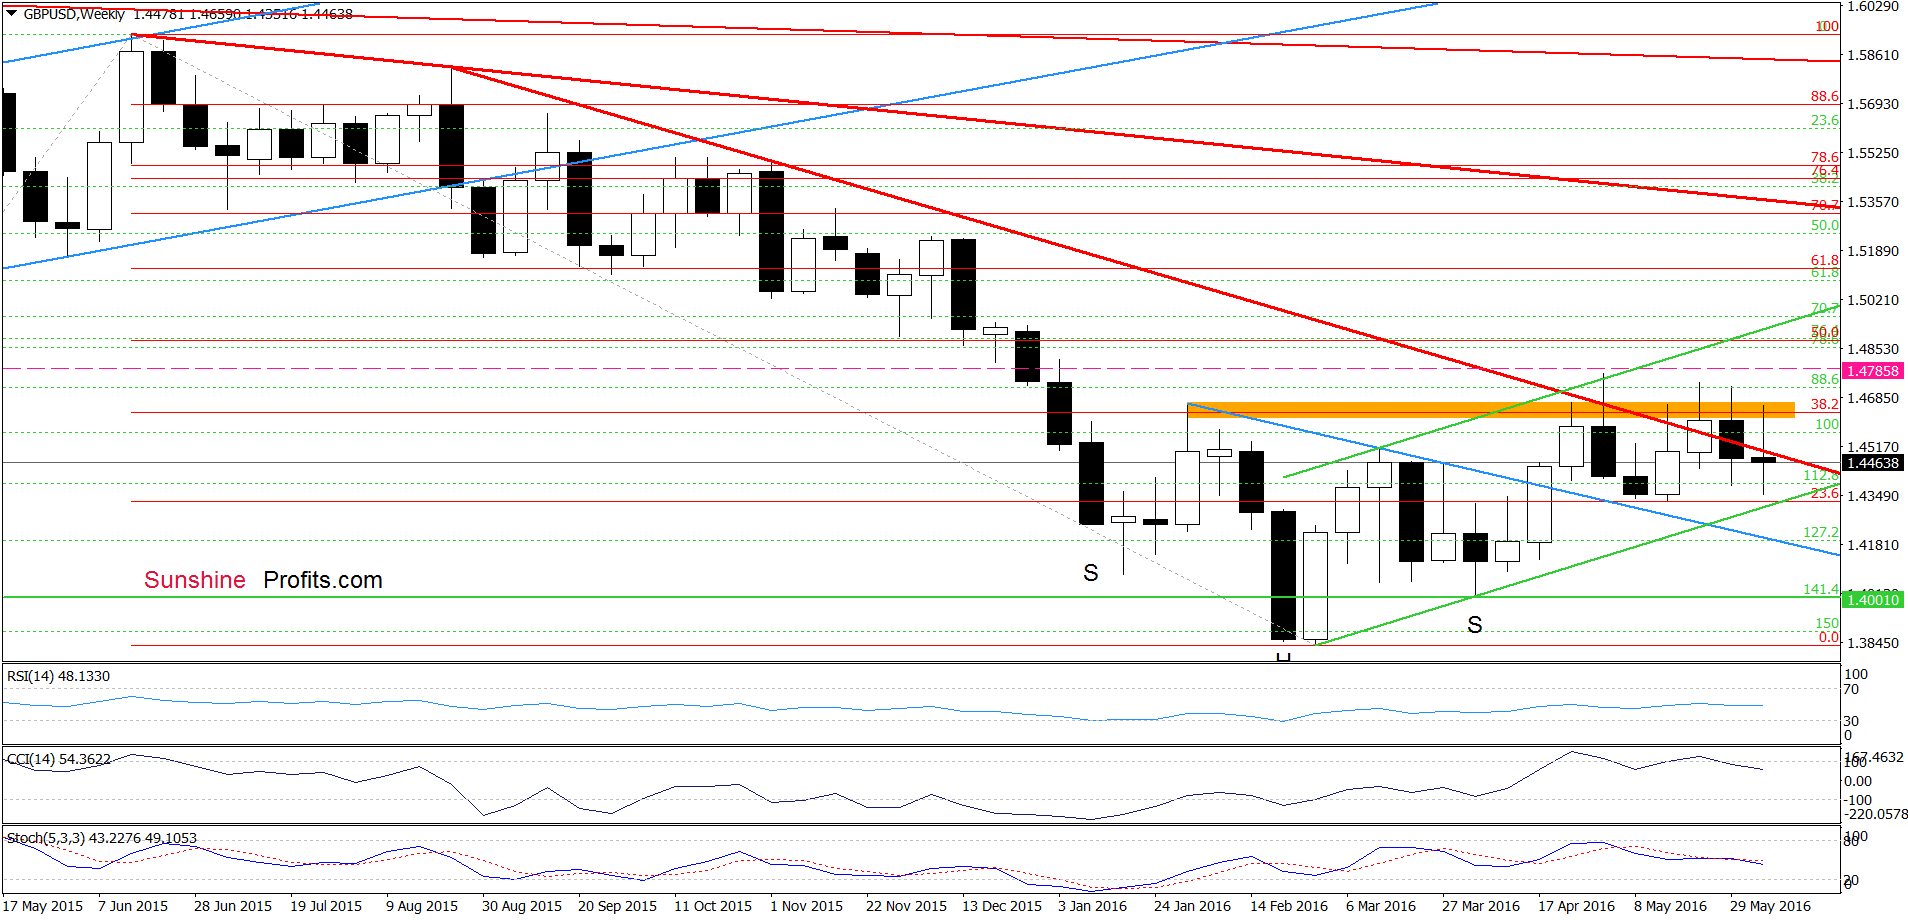
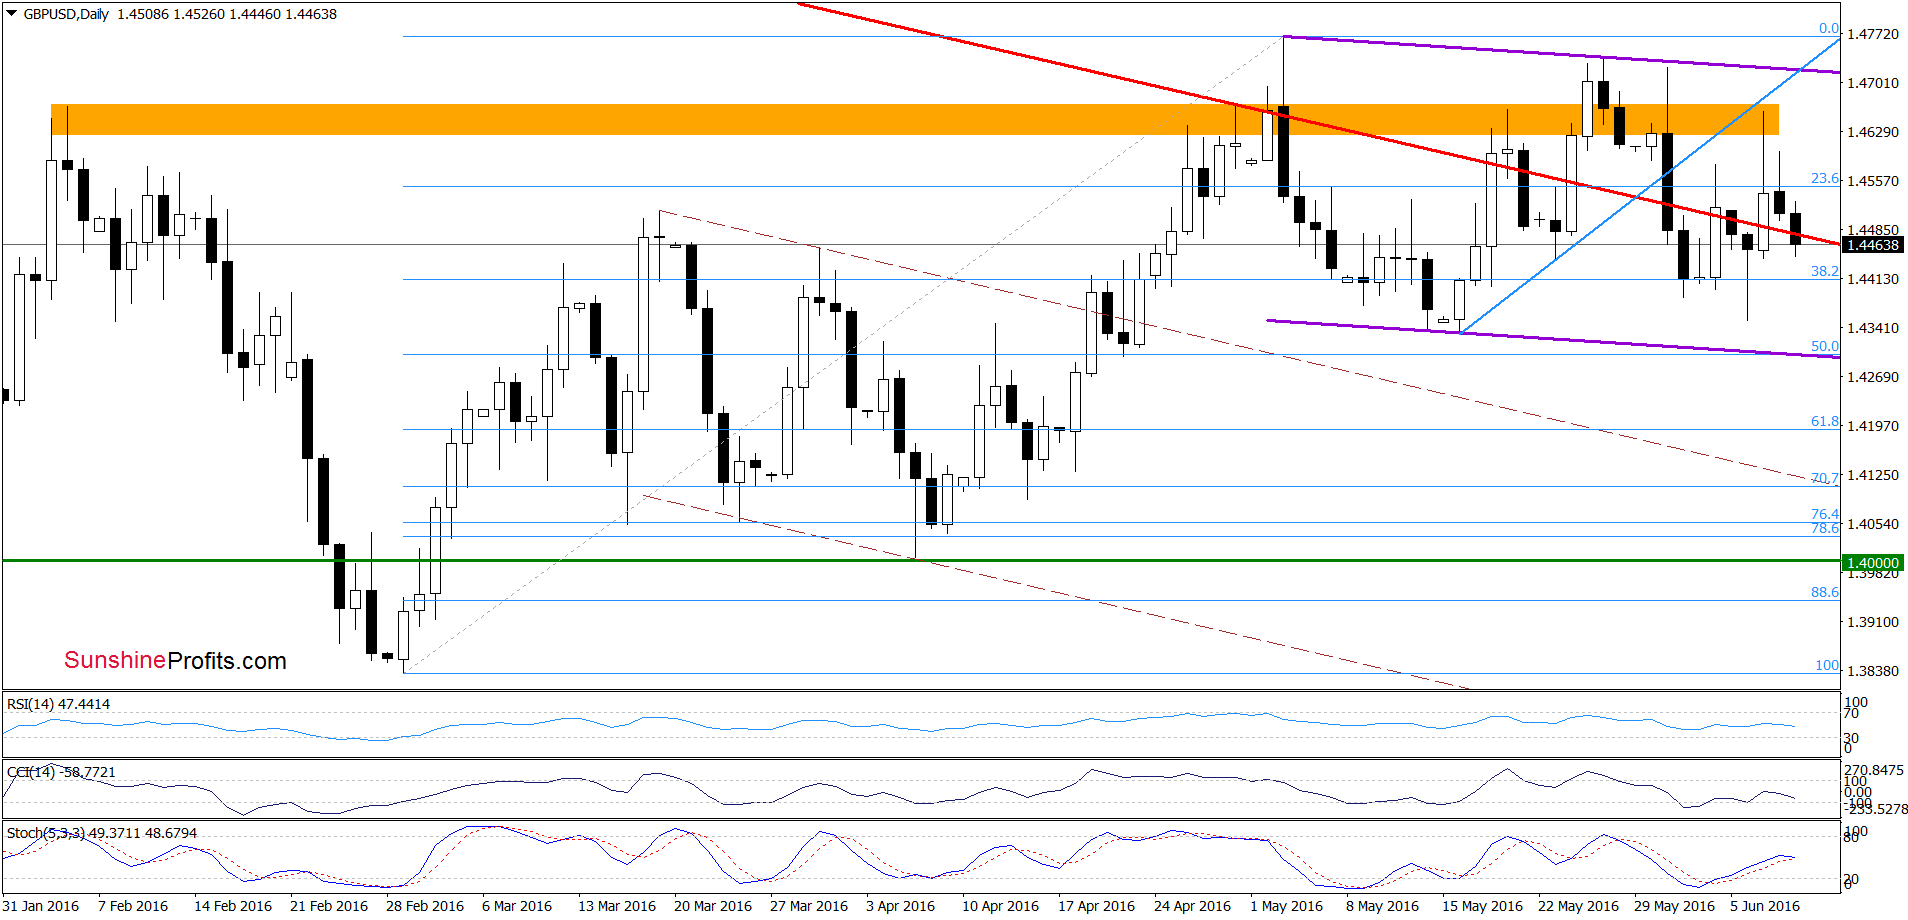
From today’s point of view, we see that although GBP/USD moved sharply higher on Monday, the orange resistance zone stopped further improvement once again and triggered a downswing, which took the exchange rate under the long-term red declining support/resistance line. In this way, the pair invalidated earlier breakout, which is a negative signal that suggests further deterioration. Nevertheless, such price action would be more likely and reliable if the pair closes today’s session under the above-mentioned line. In this case, we’ll see another downswing and a test of the lower purple support line and the 50% Fibonacci retracement in the coming days.
Very short-term outlook: bearish
Short-term outlook: mixed with bearish bias
MT outlook: mixed
LT outlook: mixed
Trading position (short-term; our opinion): Short positions (with a stop-loss order at 1.4785 and initial downside target at 1.4220) are justified from the risk/reward perspective at the moment. We will keep you informed should anything change, or should we see a confirmation/invalidation of the above.
USD/CHF
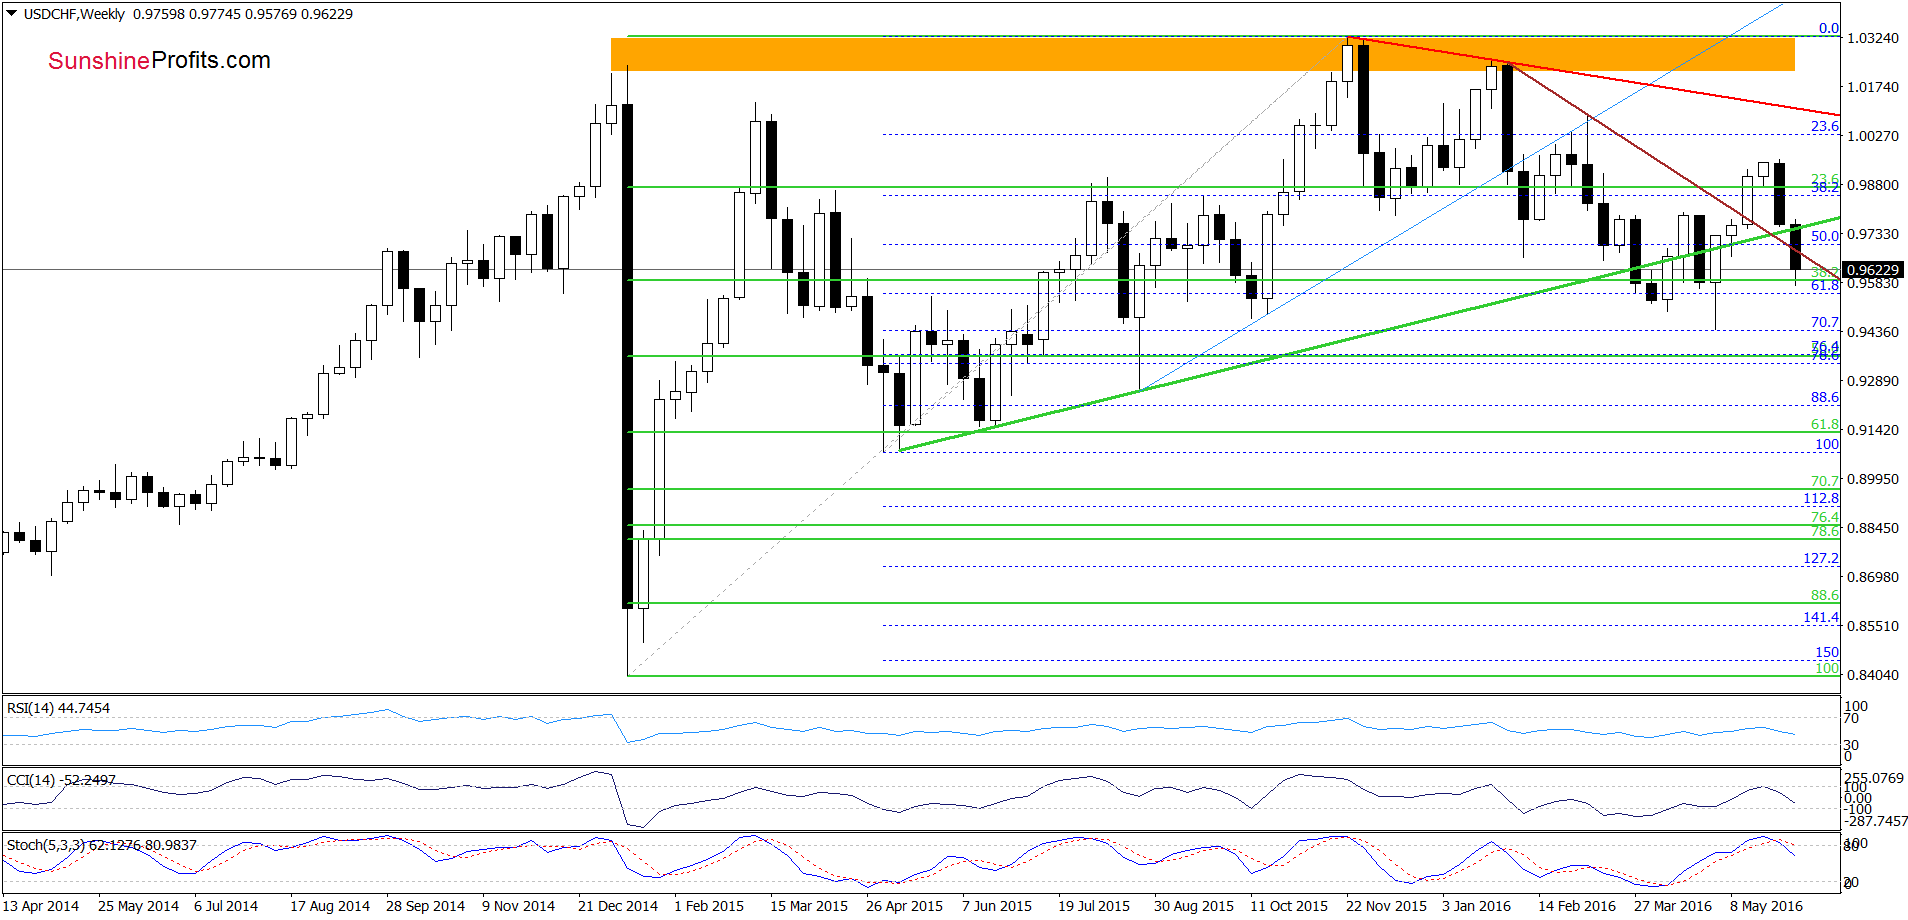
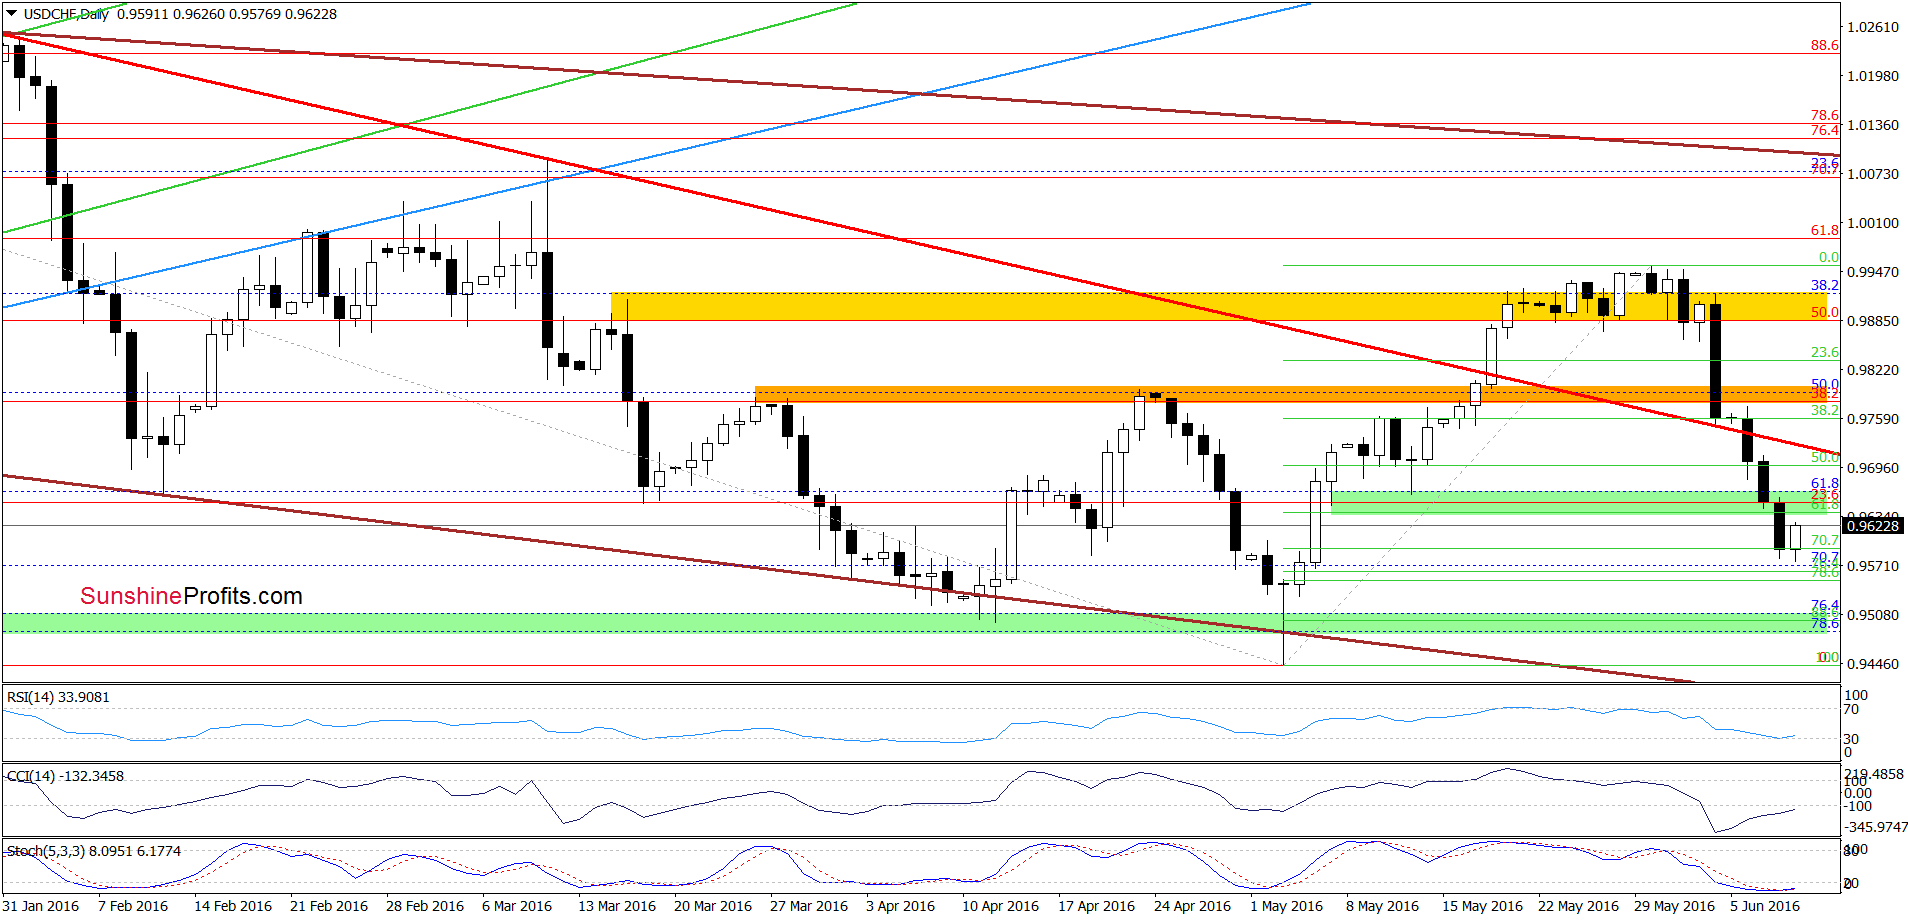
Quoting our Monday’s alert:
(…) the pair slipped under the medium-term red support line (based on the late Jan and Mar highs), which in combination with the medium-term picture and sell signals generated by the indicators suggests a test of the green support zone (created by the 61.8% retracement and the mid-May low) in the coming days.
Looking at the charts, we see that USD/CHF broke below the previously-broken brown support line (marked on the weekly chart), which triggered further deterioration and a drop under the green support zone seen on the daily chart. With this downward move the exchange rate reached the 38.2% Fibonacci retracement based on the entire Jan 2015 - Nov 2015 upward move (marked on the weekly chart) and the 70.7% retracement based on the May rally (seen on the daily chart), which triggered a rebound earlier today. Taking this fact into account, and combining it with the current position of the daily indicators (they are very close to generating buy signals), we think that furter improvement is just arund the corner. If this is the cse, we’ll see (at least) a comeback to the red declining resistance line (currently around 0.9724) in the coming days.
Very short-term outlook: mixed with bullish bias
Short-term outlook: mixed
MT outlook: mixed
LT outlook: mixed
Trading position (short-term; our opinion): No positions are justified from the risk/reward perspective. We will keep you informed should anything change, or should we see a confirmation/invalidation of the above.
Thank you.
Nadia Simmons
Forex & Oil Trading Strategist
Przemyslaw Radomski, CFA
Founder, Editor-in-chief
Gold & Silver Trading Alerts
Forex Trading Alerts
Oil Investment Updates
Oil Trading Alerts

