

Earlier today, the USD Index approached Friday’s lows as a poor payrolls report (it was the weakest reading in more than 5-1/2 years) continued to weigh on investors’ sentiment. What impact did this price action have on our six currency pairs?
In our opinion the following forex trading positions are justified - summary:
- EUR/USD: none
- GBP/USD: short (stop-loss order at 1.4785; initial downside target at 1.4220)
- USD/JPY: none
- USD/CAD: none
- USD/CHF: none
- AUD/USD: none
EUR/USD
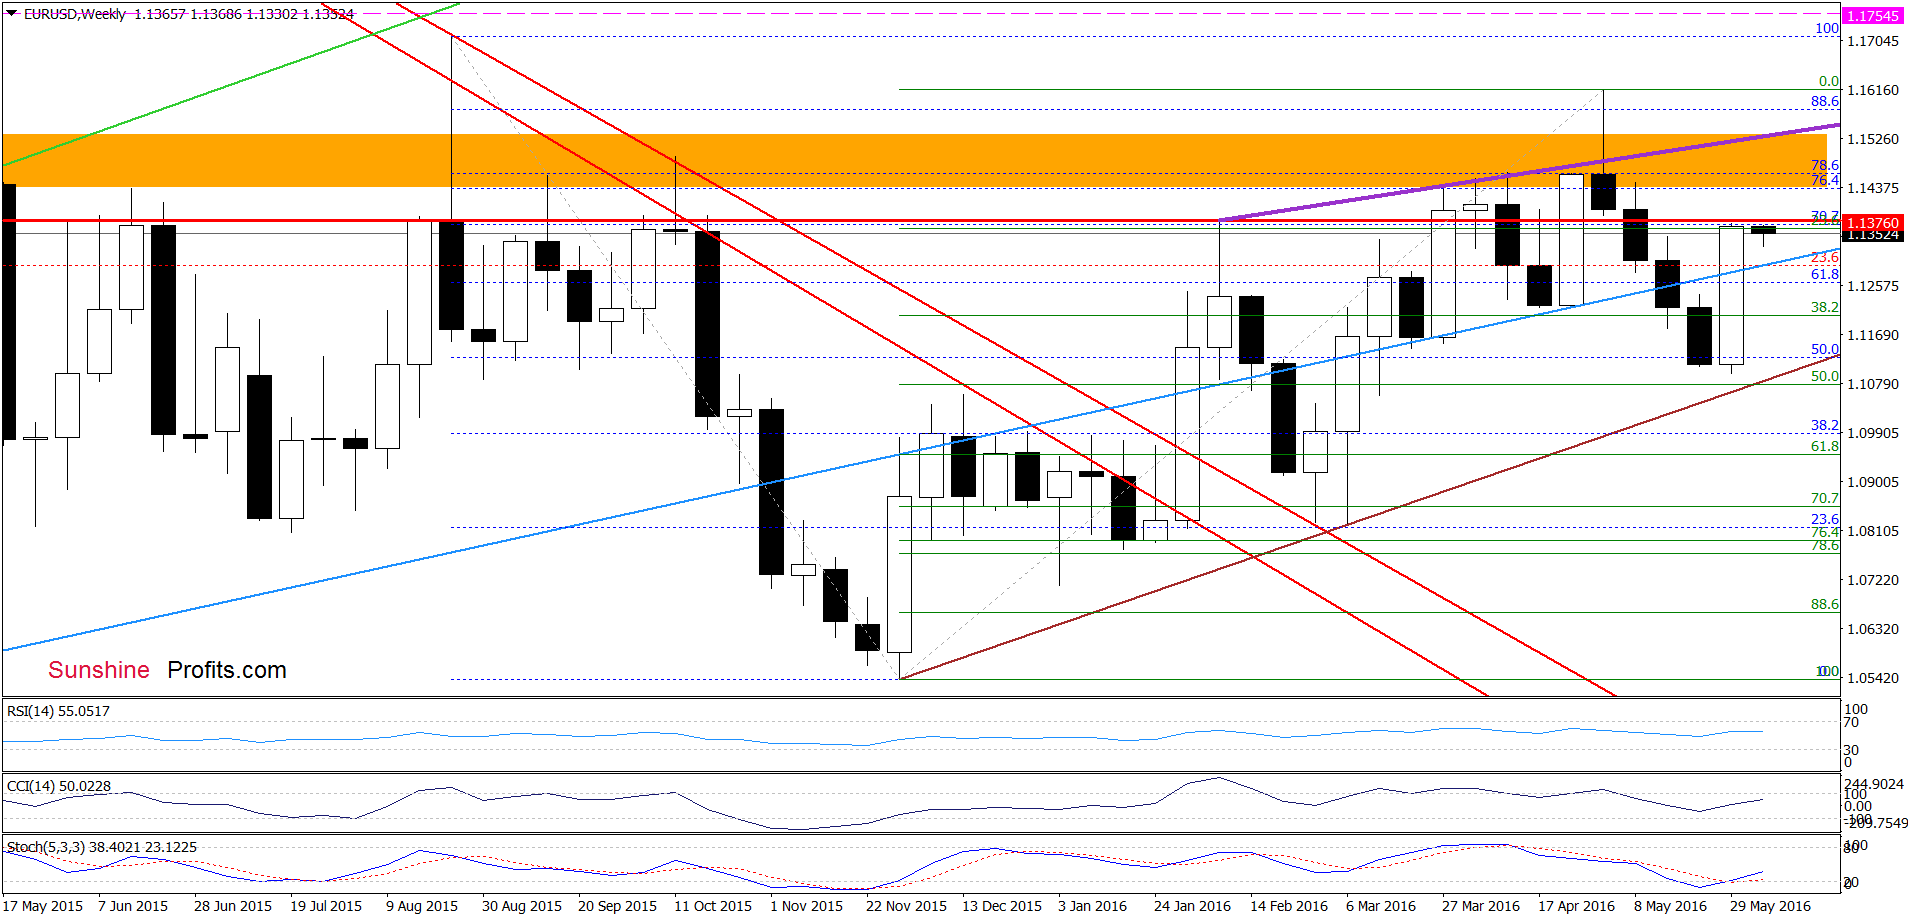
Looking at the weekly chart, we see that EUR/USD rebounded sharply in the previous week, which resulted in a comeback to the Feb high. How did this move affect the very short-term picture? Let’s check.
On Tuesday, we wrote the following:
(…) the exchange rate invalidated earlier breakdown under Fibonacci retracement yesterday. Earlier today, the pair extended gains, increasing above the upper line of the declining wedge and the late-Apr low, which is a positive signal that suggests further improvement – especially when we factor in buy signals generated by all indicators. (…) In this case, the next upside target would be around 1.1293, where the 38.2% Fibonacci retracement (based on the recent downward move) currently is.
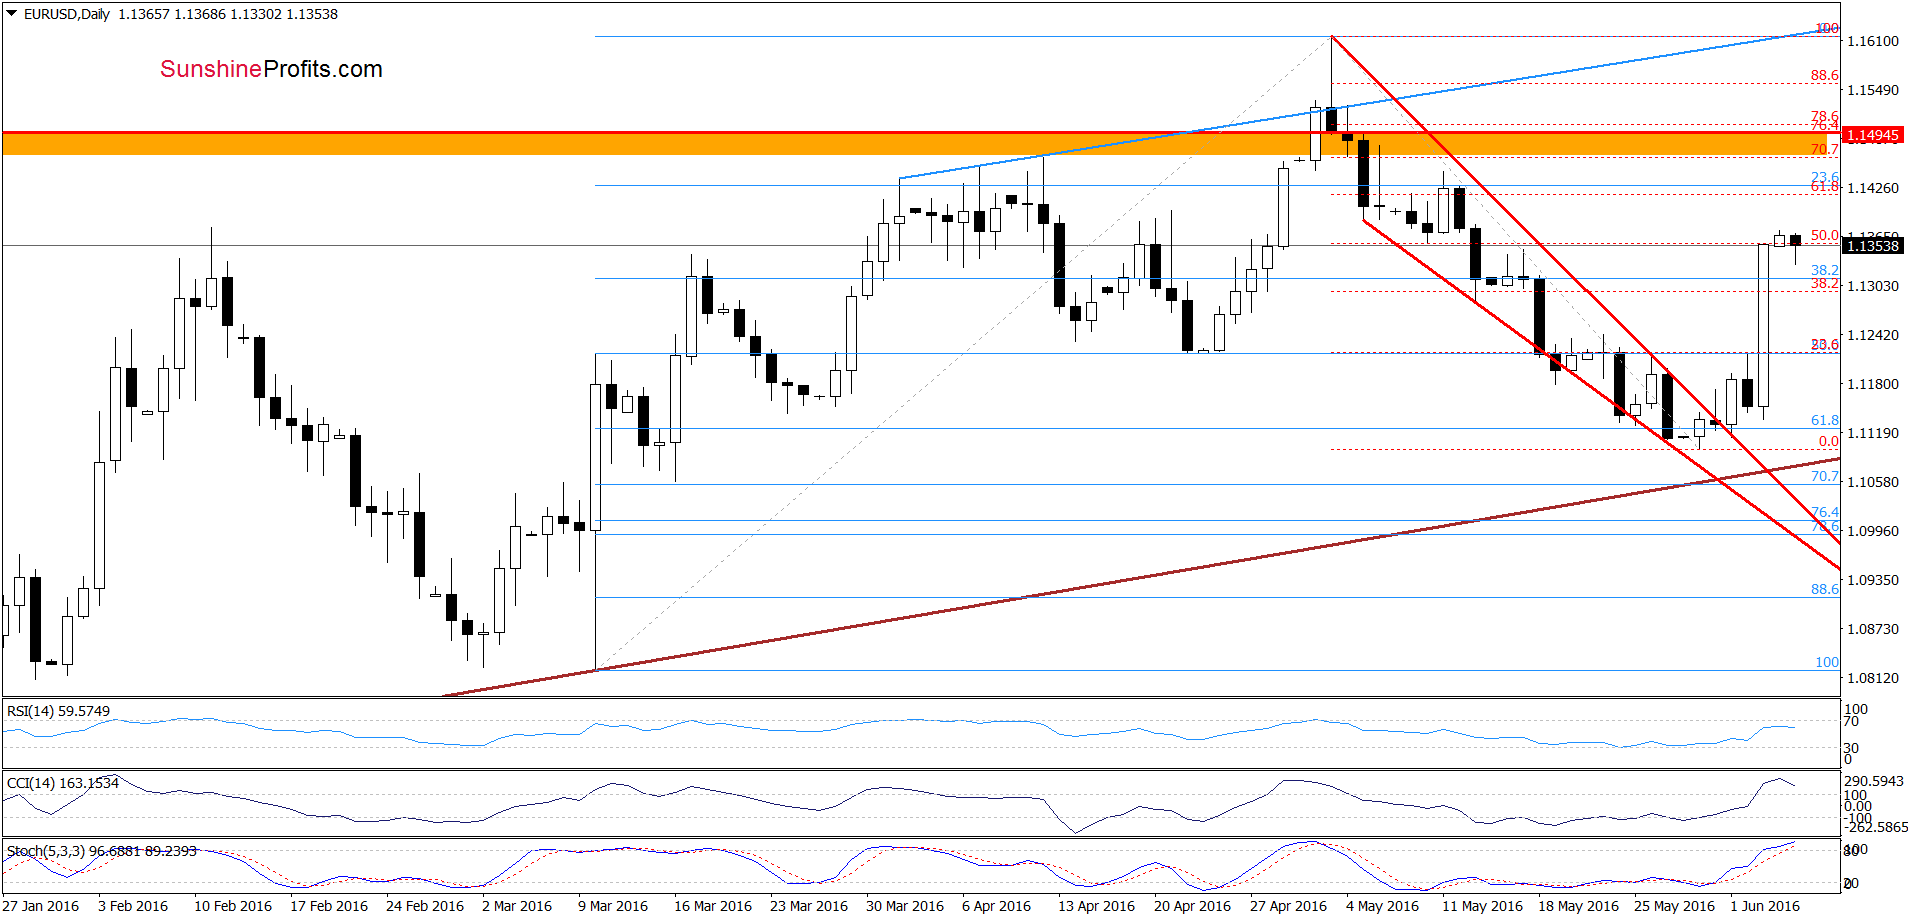
On the daily chart, we see that the situation developed in line with the above scenario and currency bulls pushed the exchange rate not only to our initial upside target, but also to the 50% Fibonacci retracement. Taking this fact into account and combining it with the current position of the indicators (the CCI and Stochastic Oscillator are overbought) it seems that reversal is just around the corner. Nevertheless, as long as there won’t be sell signals another attempt to move higher (to the 61.8% retracement and the May 11 and May 12 highs) is likely.
Very short-term outlook: mixed with bullsi bias
Short-term outlook: mixed
MT outlook: mixed
LT outlook: mixed
Trading position (short-term; our opinion): No positions are justified from the risk/reward perspective. We will keep you informed should anything change, or should we see a confirmation/invalidation of the above.
GBP/USD
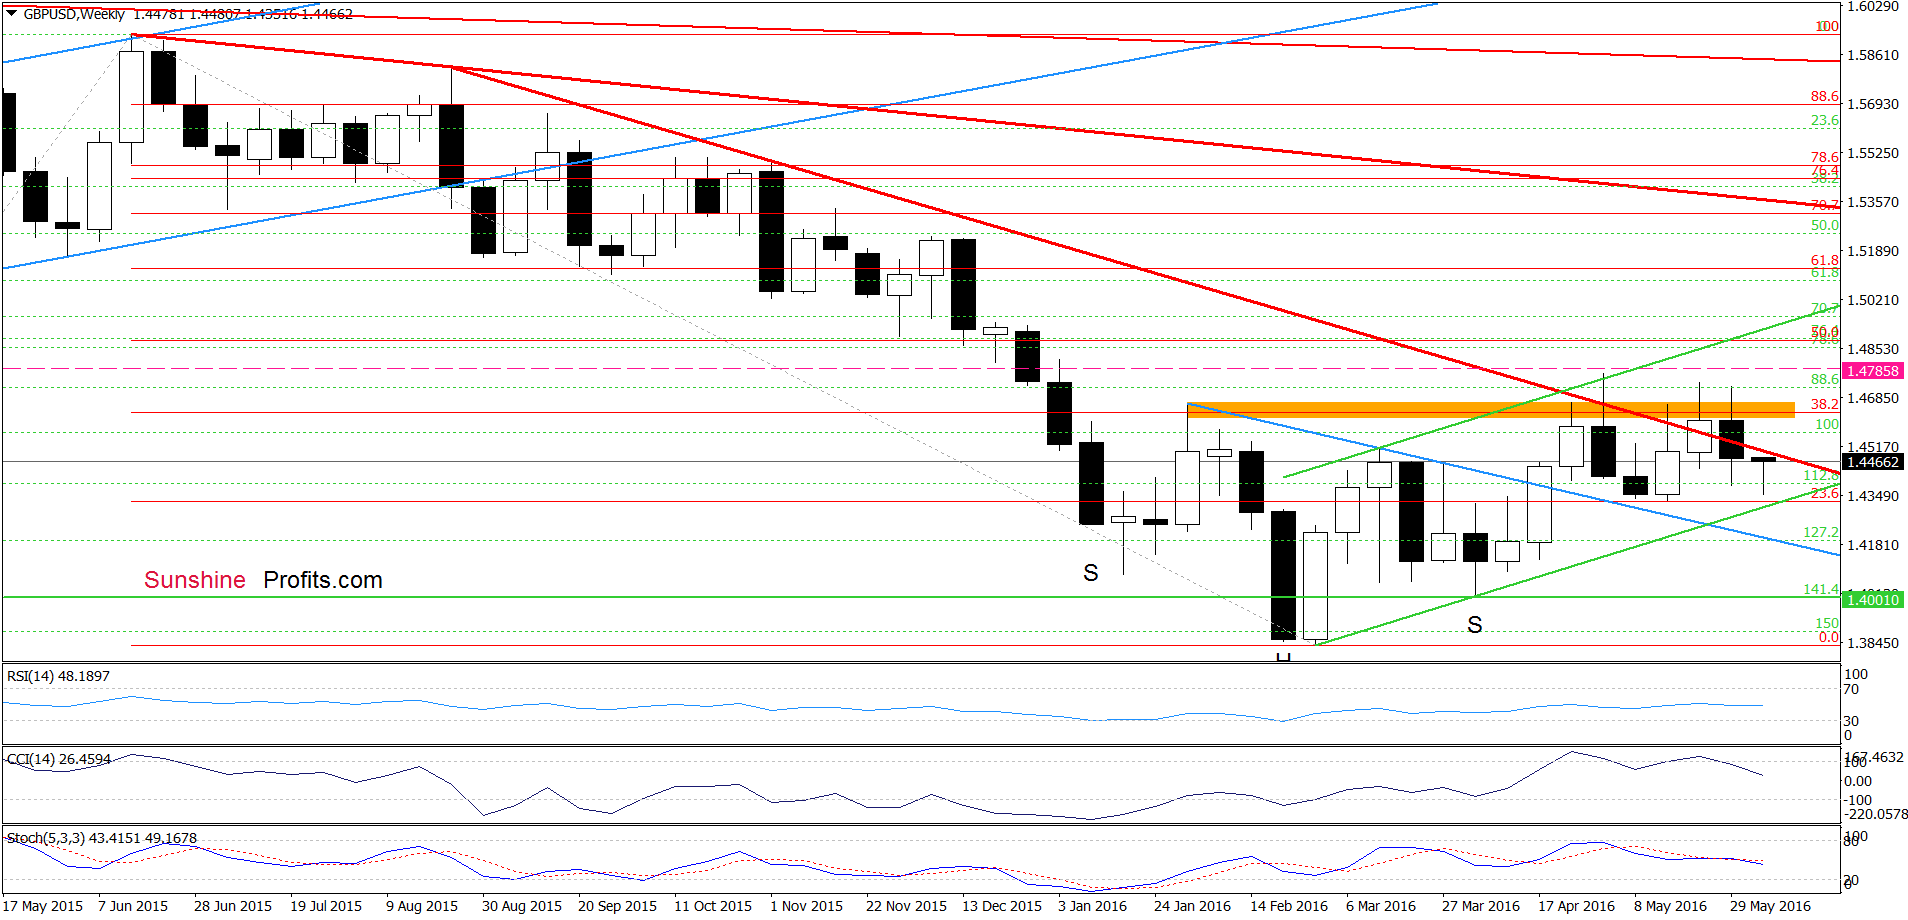
On the medium-term chart, we see that the orange resistance zone stopped further improvement and triggered a downswing in the previous week. With this move GBP/USD dropped under the long-term red declining support/resistance line, invalidating earlier breakout, which is a negative signal that suggests further deterioration. Nevertheless, such price action would be more likely and reliable if the pair drops under the lower border of the green rising trend channel (currently around 1.4303).
Having said the above, let’s focus on the very short-term changes.
Quoting our Tuesday’s alert:
(…) although the exchange rate increased last week, currency bulls didn’t manage to hold gained levels, which resulted in a pullback and invalidation of earlier small breakout above the orange resistance zone. Earlier today, we saw another unsuccessful attempt to move higher, which in combination with sell signals generated by the indicators suggests that lower values of the exchange rate are just around the corner. If this is the case, and GBP/USD drops under the blue support line based on previous lows, we’ll see a test of the red declining line (which serves as the nearest support at the moment) or even a drop to the lower purple support line (currently around 1.4314) in the following days.
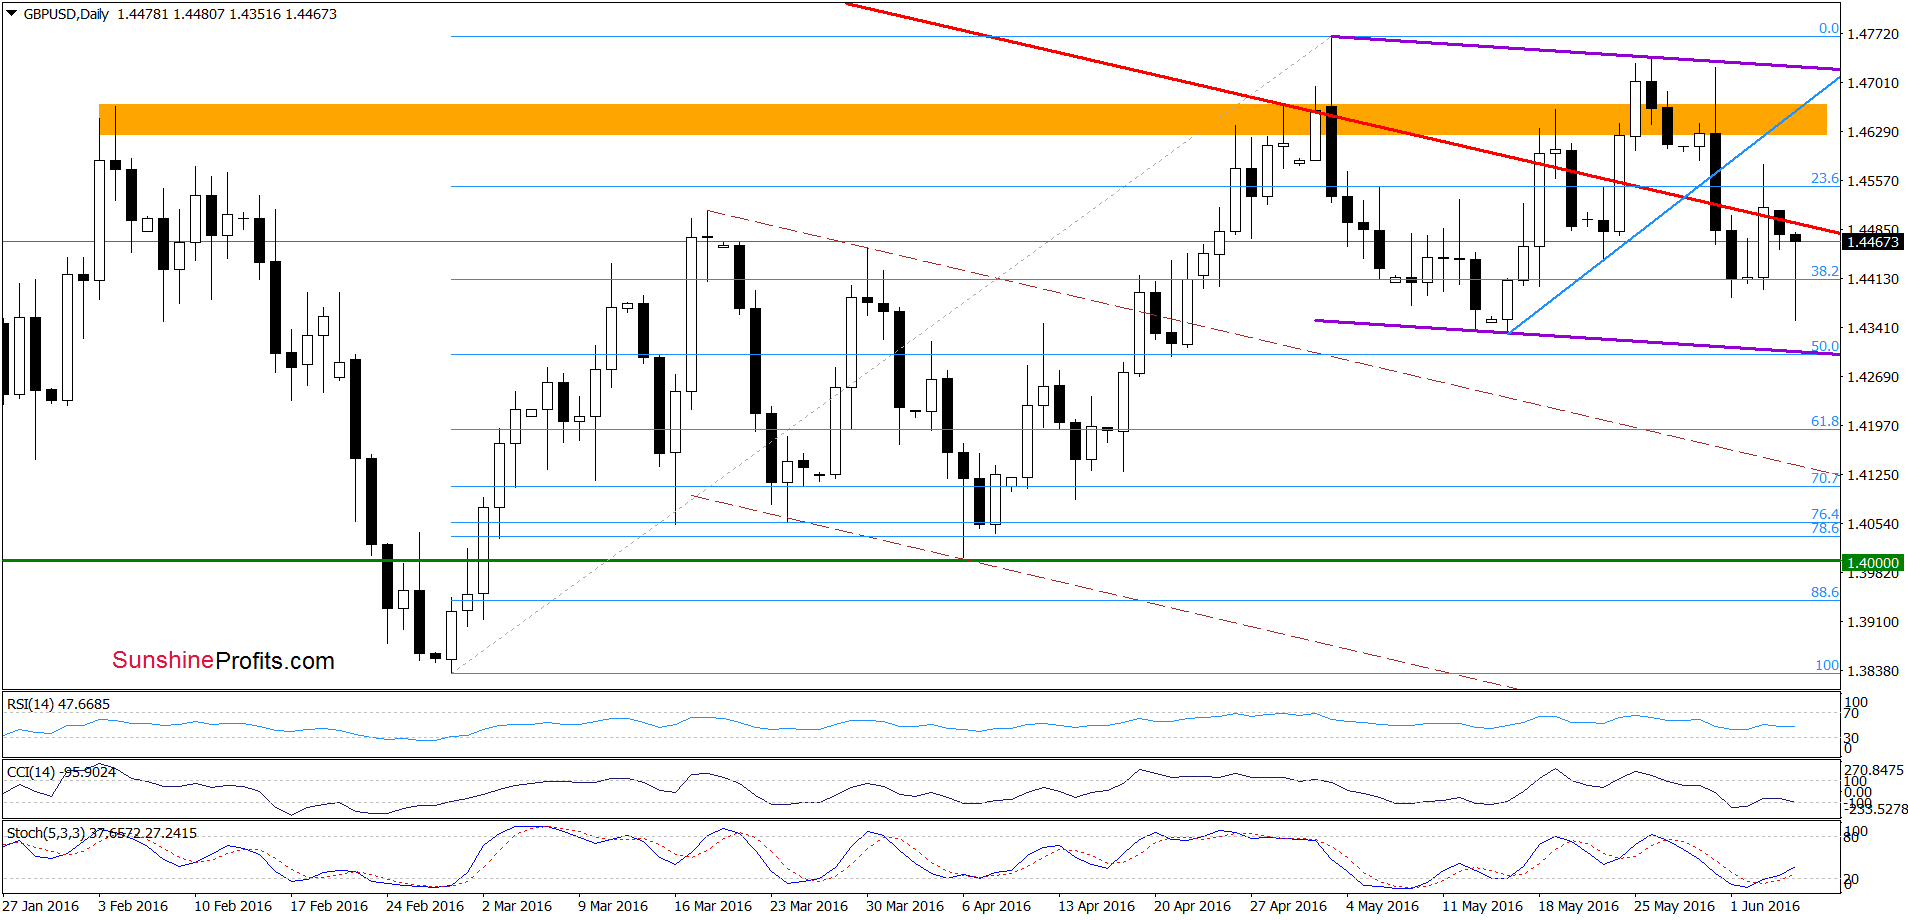
From this perspective, we see that currency bears pushed the pair lower as we had expected. With this downward move, GBP/USD slipped under the 38.2% Fibonacci retracement (based on the entire Feb-May increases) and approached mid-May lows. As you see, this support area triggered a rebound earlier today, but despite this move, the exchange rate remains under the long-term red declining line, which suggests that today’s upswing may be a verification of earlier breakdown. If this is the case, we’ll see another downswing and a test of the lower purple support line (currently around 1.4308) in the coming days.
Very short-term outlook: bearish
Short-term outlook: bearish
MT outlook: mixed with bearish bias
LT outlook: mixed
Trading position (short-term; our opinion): Short positions (with a stop-loss order at 1.4785 and initial downside target at 1.4220) are justified from the risk/reward perspective at the moment. We will keep you informed should anything change, or should we see a confirmation/invalidation of the above.
USD/JPY
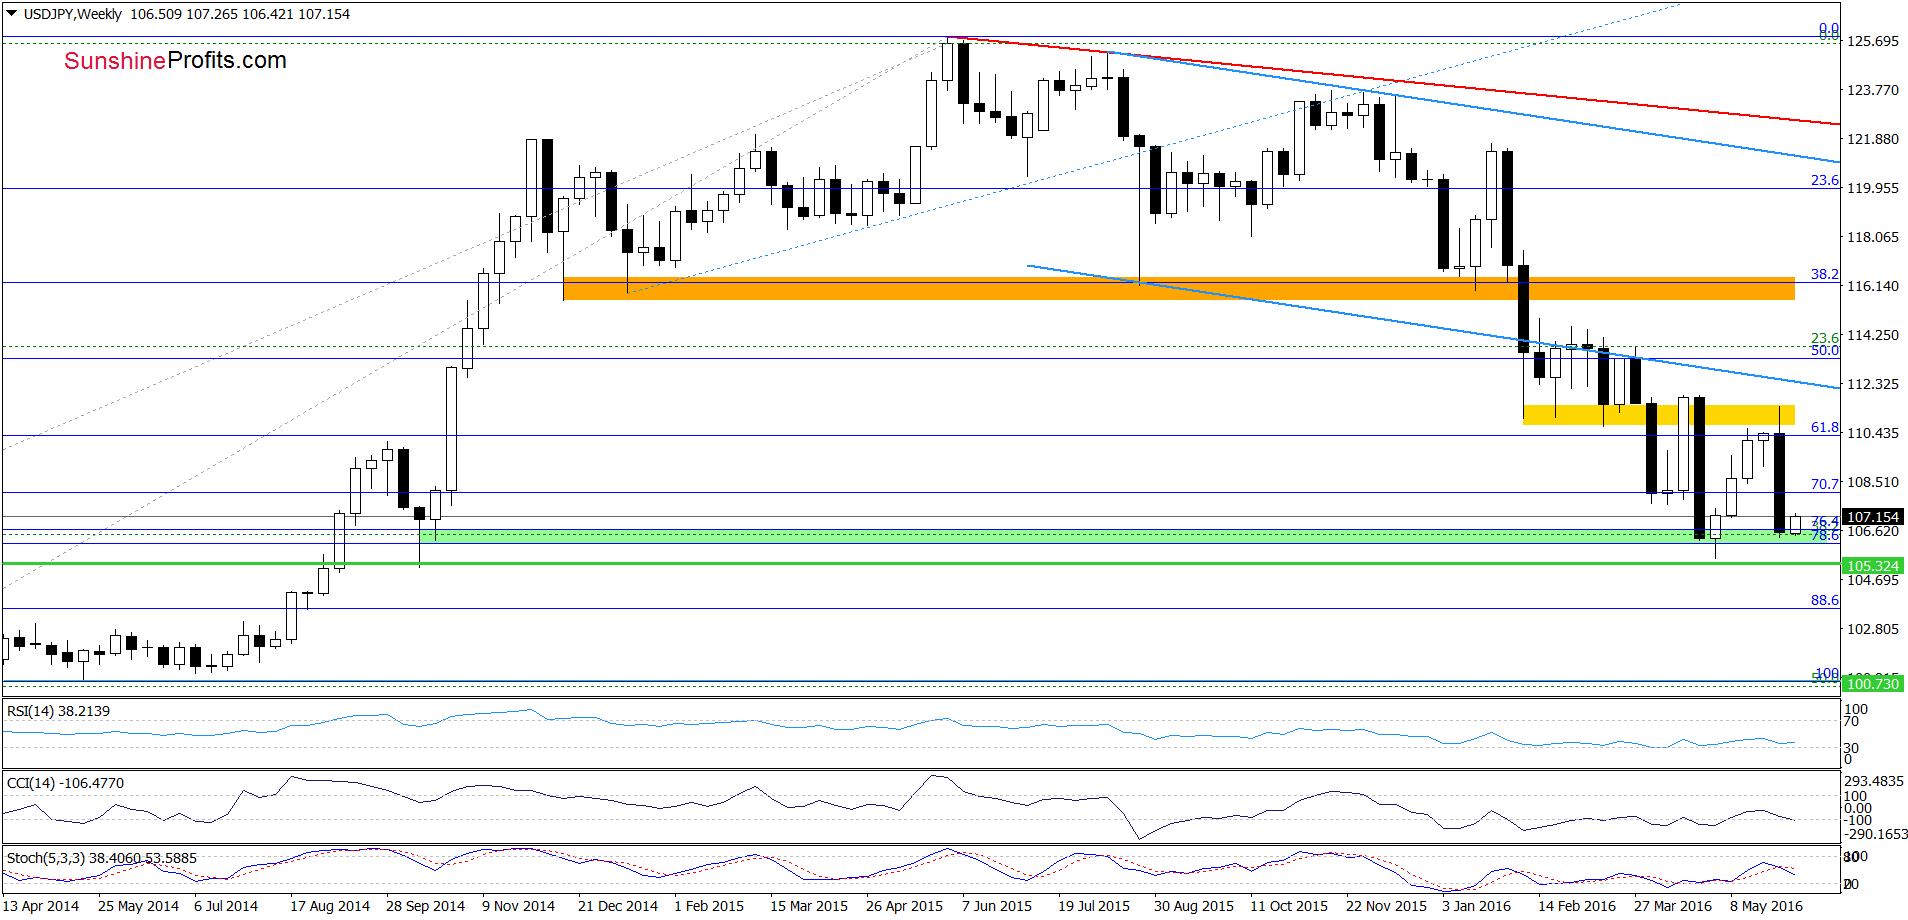
On Tuesday, we wrote:
(…) USD/JPY moved higher in the previous week and reached the yellow resistance zone created by the Feb and Mar lows, which may pause further improvement in the coming week.
As you see the situation developed in line with the above scenario and USD/JPY declined sharply, reaching the recent lows and the green support zone. How did this move affect the very short-term picture? Let’s examine the daily chart and find out.
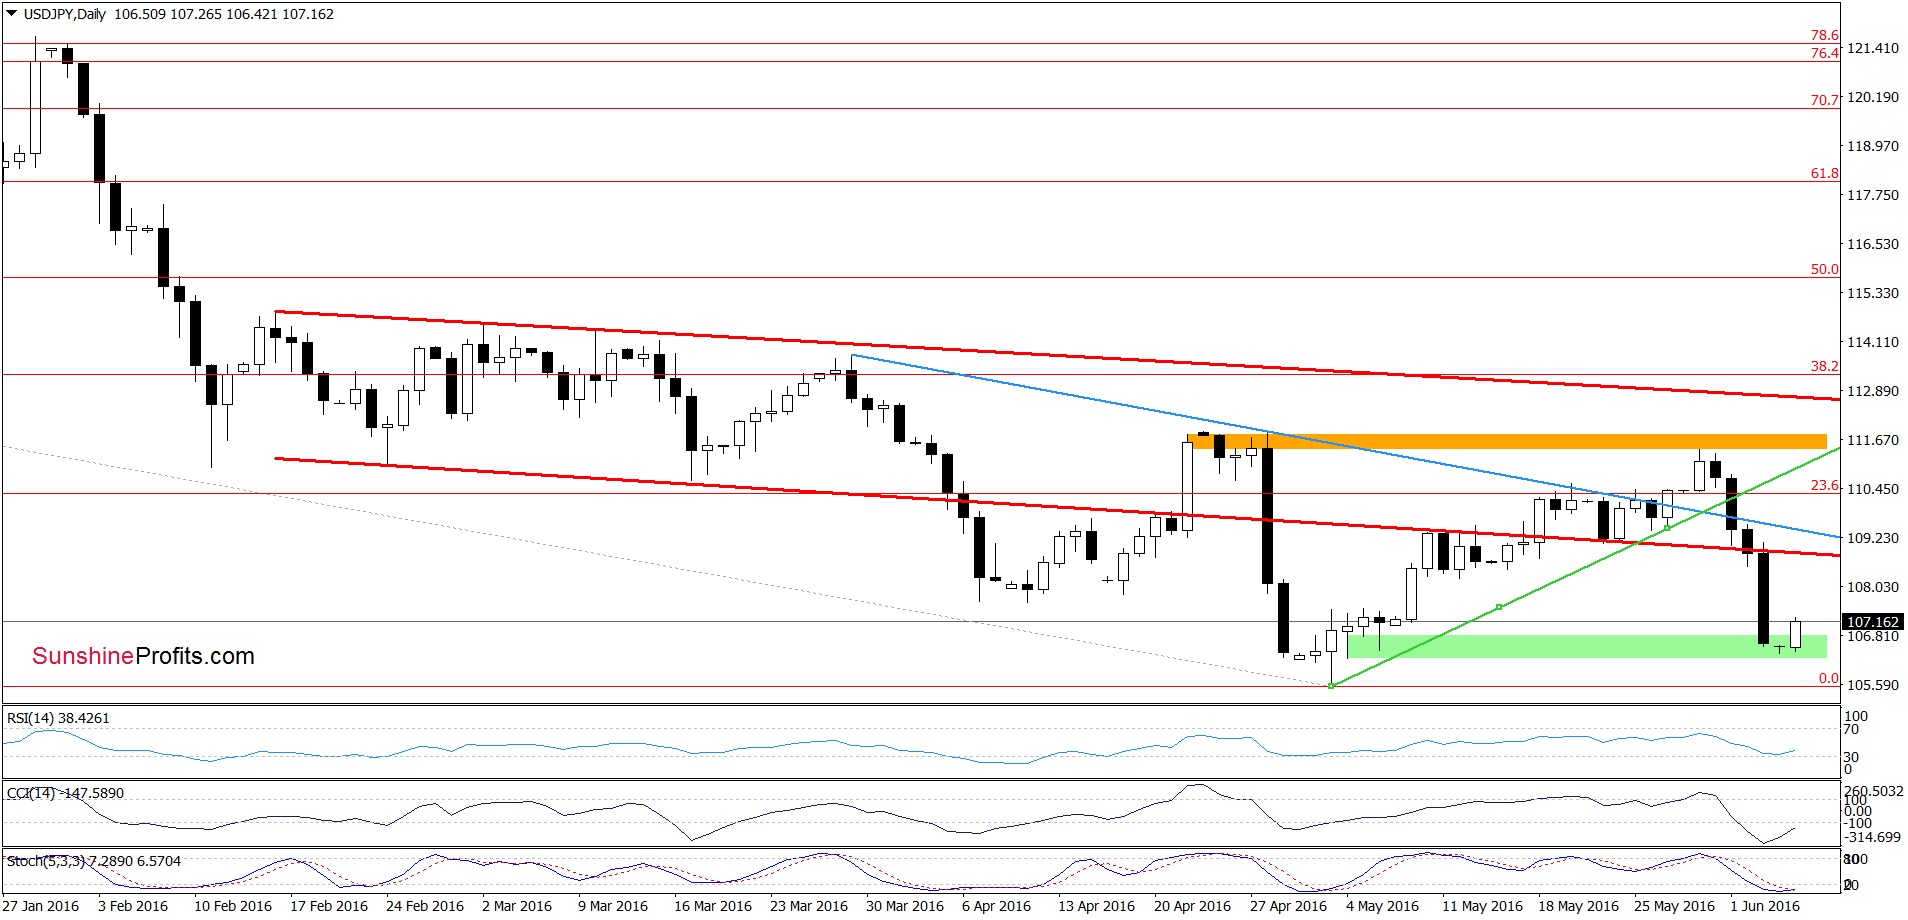
Looking at the daily chart, we see that USD/JPY declined sharply and reached the green zone in the previous week. Earlier today, this support area triggered a rebound, which in combination with the current position of the indicators (they are very close to generating buy signals) and the medium-term picture suggests further improvement in the coming days. If this is the case, we may see a test of the lower red resistance line in the coming days.
Very short-term outlook: mixed with bullish bias
Short-term outlook: mixed
MT outlook: mixed
LT outlook: mixed
Trading position (short-term; our opinion): No positions are justified from the risk/reward perspective at the moment. We will keep you informed should anything change, or should we see a confirmation/invalidation of the above.
USD/CAD
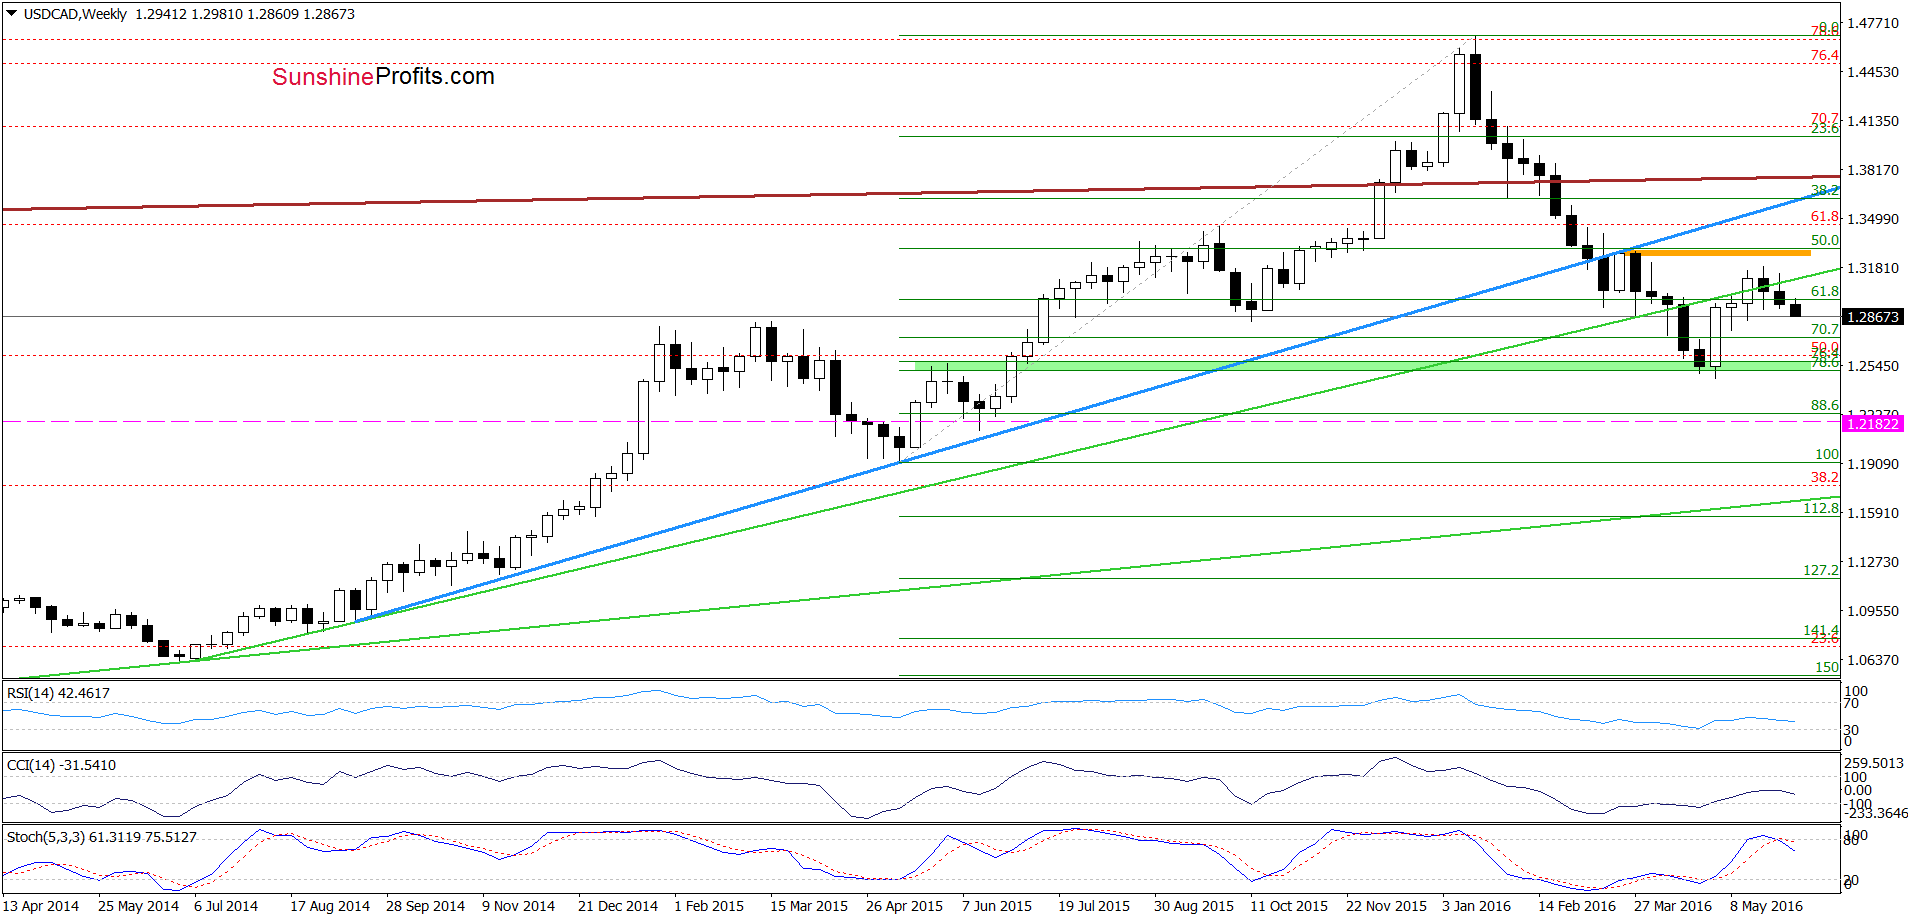
Quoting our last commentary on this currency pair:
(…) USD/CAD came back to the previously-broken green support/resistance line, which may be a verification of earlier breakdown.
From today’s point of view, we see that the situation developed in line with the above scenario and USD/CAD verified earlier breakdown under the green line, which triggered a decline. Earlier today, the pair extended losses, which in combination with a sell signal generated by the Stochastic Oscillator suggests further deterioration in the coming week.
Will the very short-term picture confirm this scenario? Let’s examine the daily chart and find out.
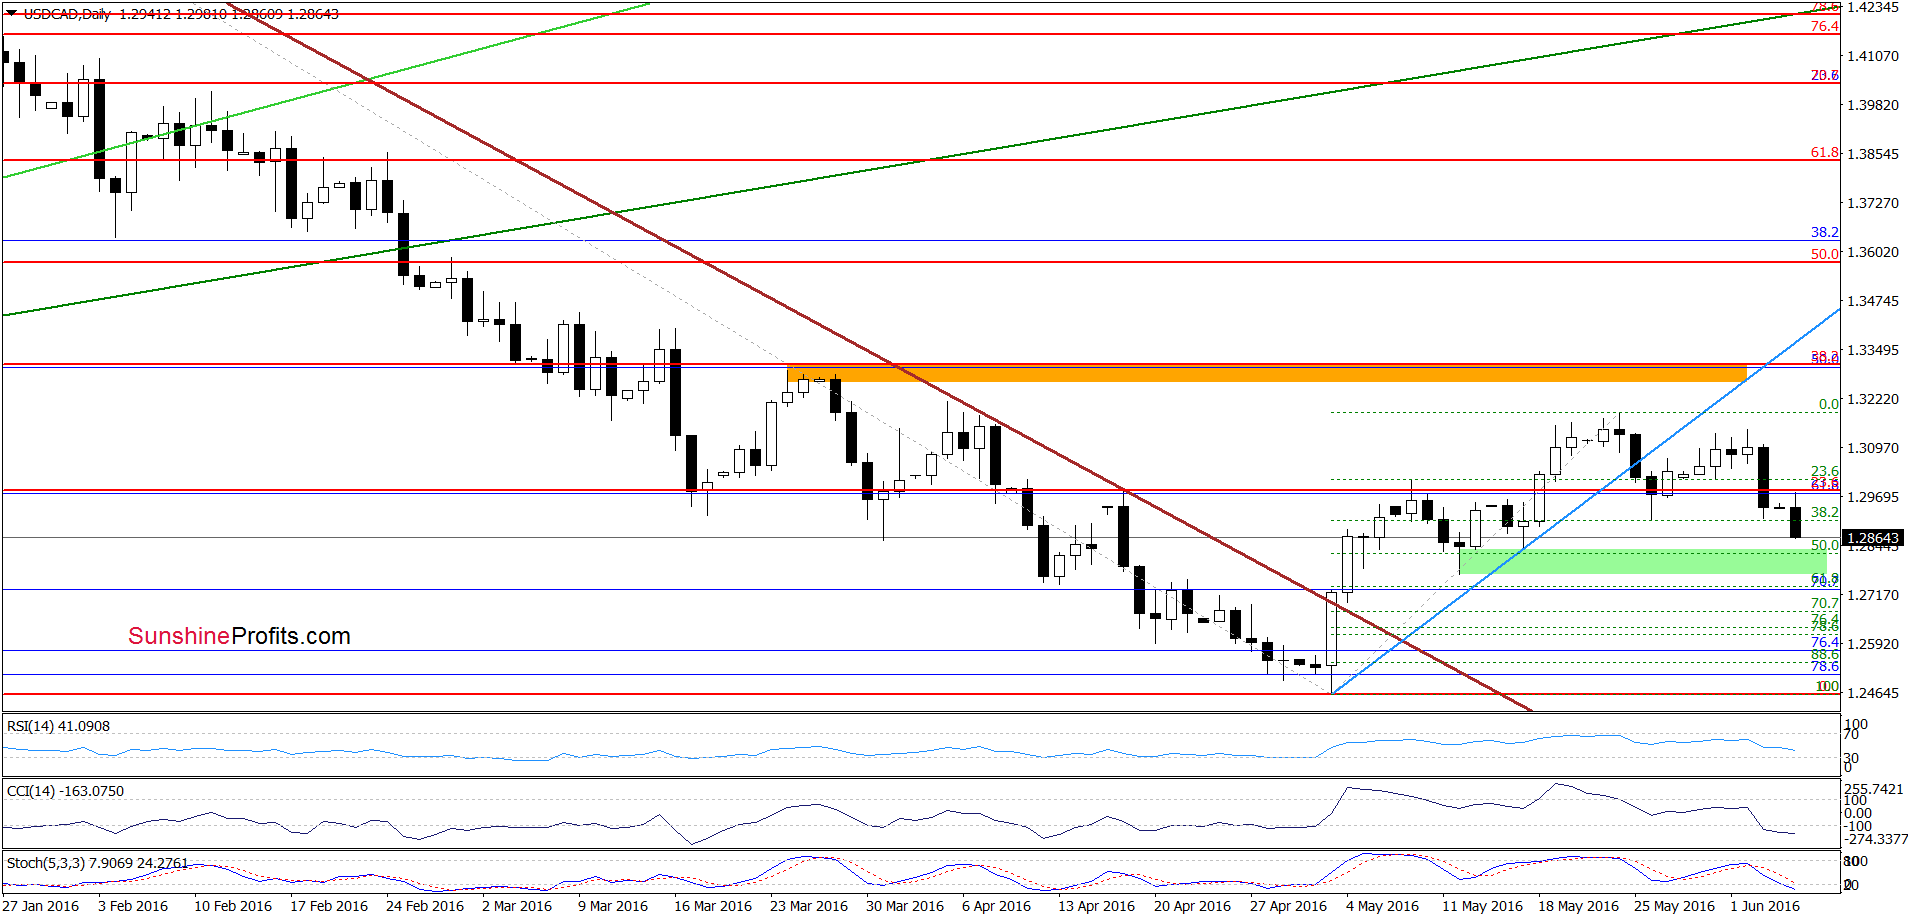
On the daily chart, we see that USD/CAD declined under the 38.2% Fibonacci retracement (based on the recent upward move), which in combination with sell signals generated by the indicators suggests (at least) a test of the green support zone created by the 50% retracement and the mid-May low in the coming days.
Very short-term outlook: bearish
Short-term outlook: mixed
MT outlook: mixed
LT outlook: mixed
Trading position (short-term; our opinion): No positions are justified from the risk/reward perspective. We will keep you informed should anything change, or should we see a confirmation/invalidation of the above.
USD/CHF
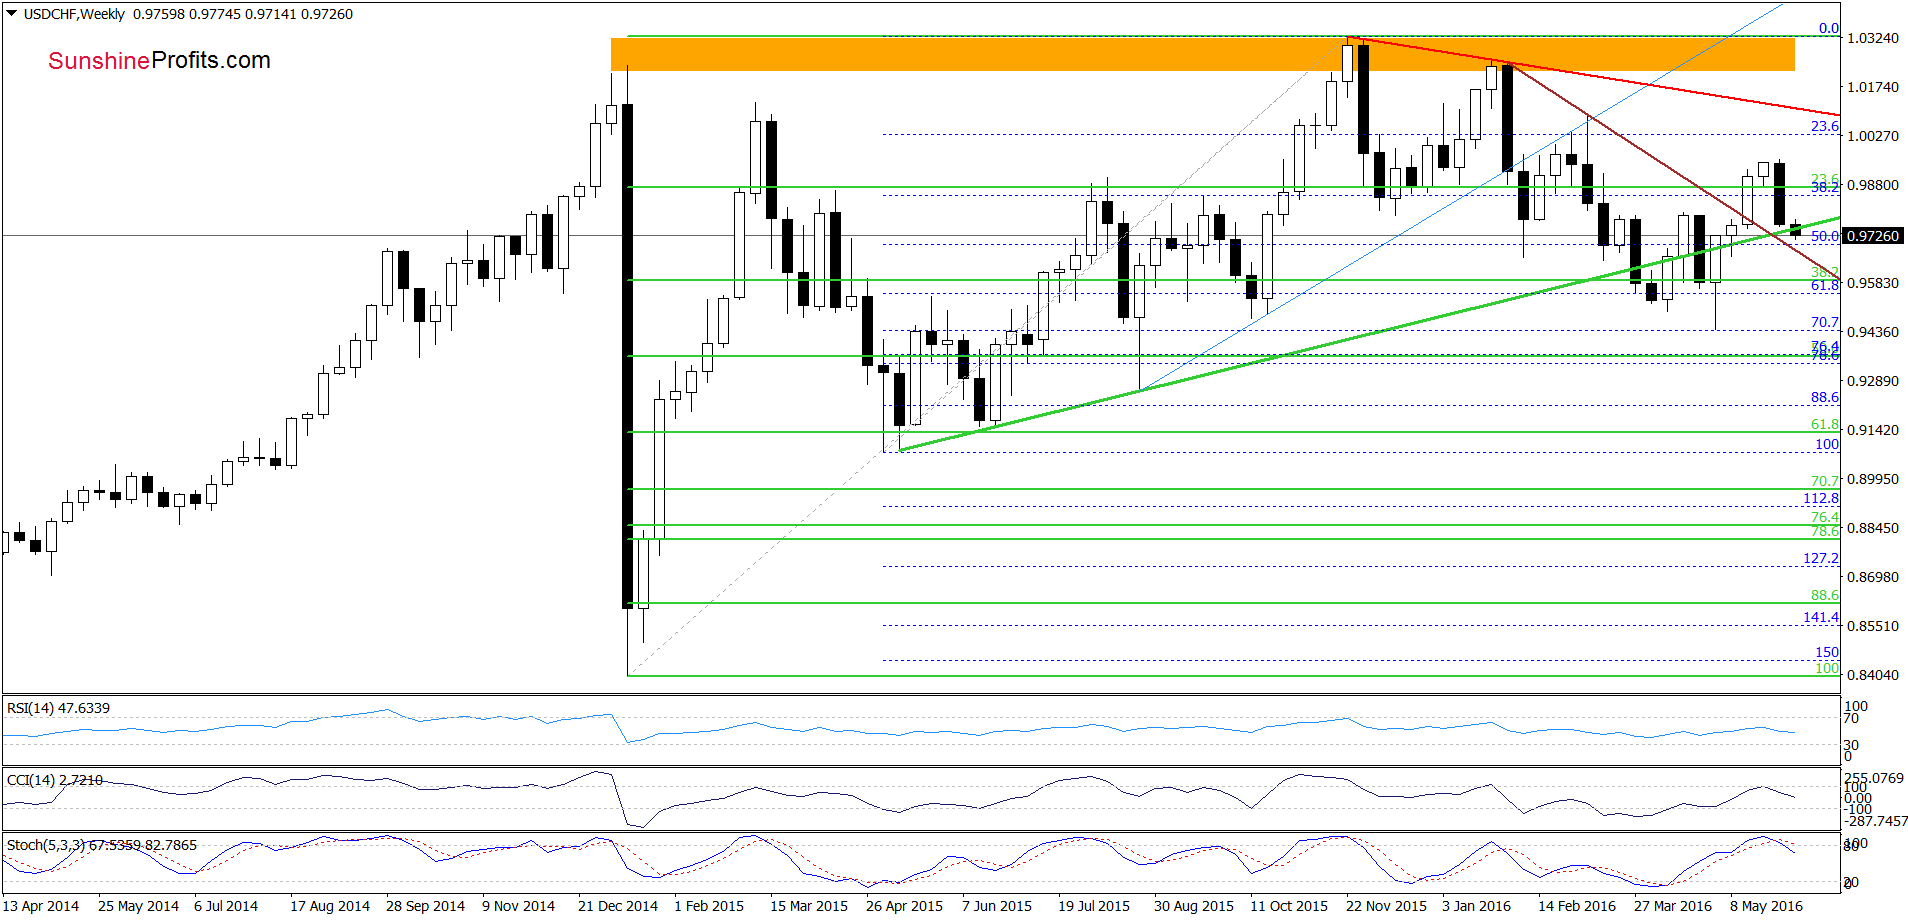
The first thing that catches the eye on the weekly chart is a drop under the green support line. Taking this negative event and sell signals generated by the indicators into account, we think that further deterioration is just around the corner.
Are there any other factors that may encourage currency bears to act? Let’s take a closer look at the daily chart and find out.
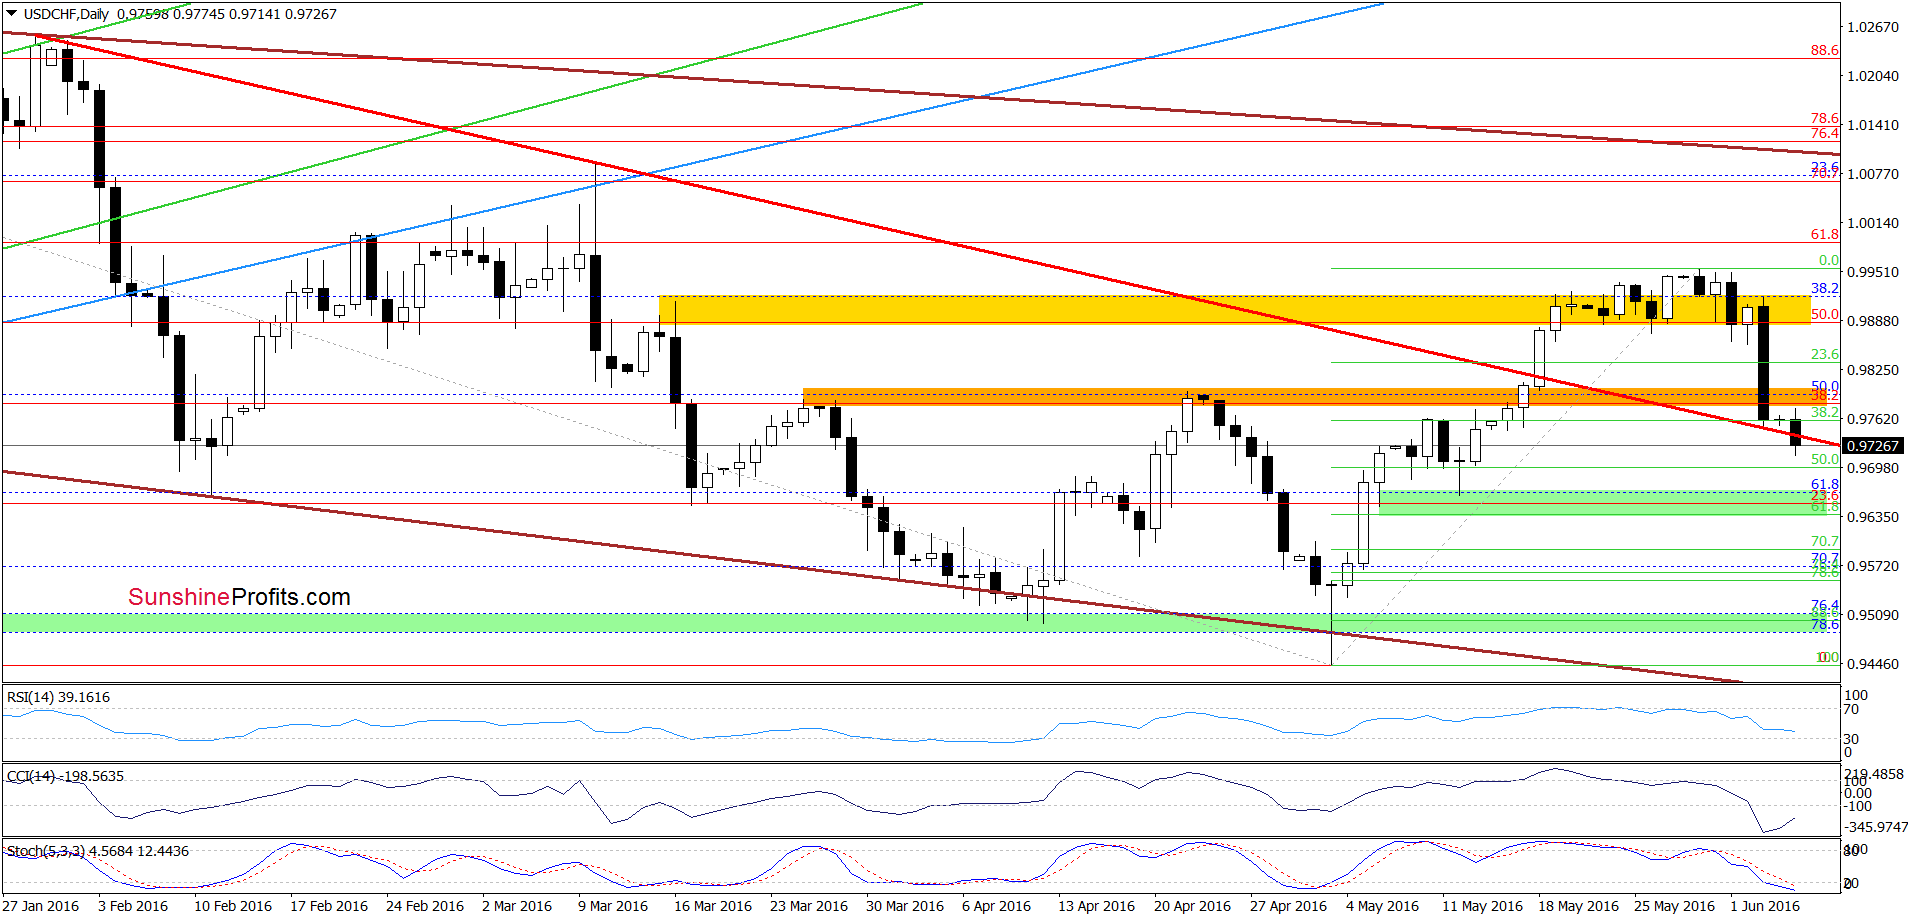
On Tuesday, we wrote the following:
(…) although USD/CHF climbed slightly above the yellow resistance zone once again, currency bulls didn’t manage to hold gained levels, which resulted in reversal and a comeback to the consolidation. Additionally, all indicators generated sell signals, suggesting that lower values of the exchange rate are just around the corner. Therefore, if USD/CHF declines from this area, the initial downside target would be the orange zone, which serves now as the nearest support.
On the daily chart, we see that the situation developed in tune with our Tuesday’s forecast and USD/CHF reached the support zone on Friday. As you see, currency bulls didn’t manage to stop further deterioration in this area, which triggered another downswing earlier today. With this move, the pair slipped under the medium-term red support line (based on the late Jan and Mar highs), which in combination with the medium-term picture and sell signals generated by the indicators suggests a test of the green support zone (created by the 61.8% retracement and the mid-May low) in the coming days.
Very short-term outlook: mixed with bearish bias
Short-term outlook: mixed
MT outlook: mixed
LT outlook: mixed
Trading position (short-term; our opinion): No positions are justified from the risk/reward perspective. We will keep you informed should anything change, or should we see a confirmation/invalidation of the above.
AUD/USD
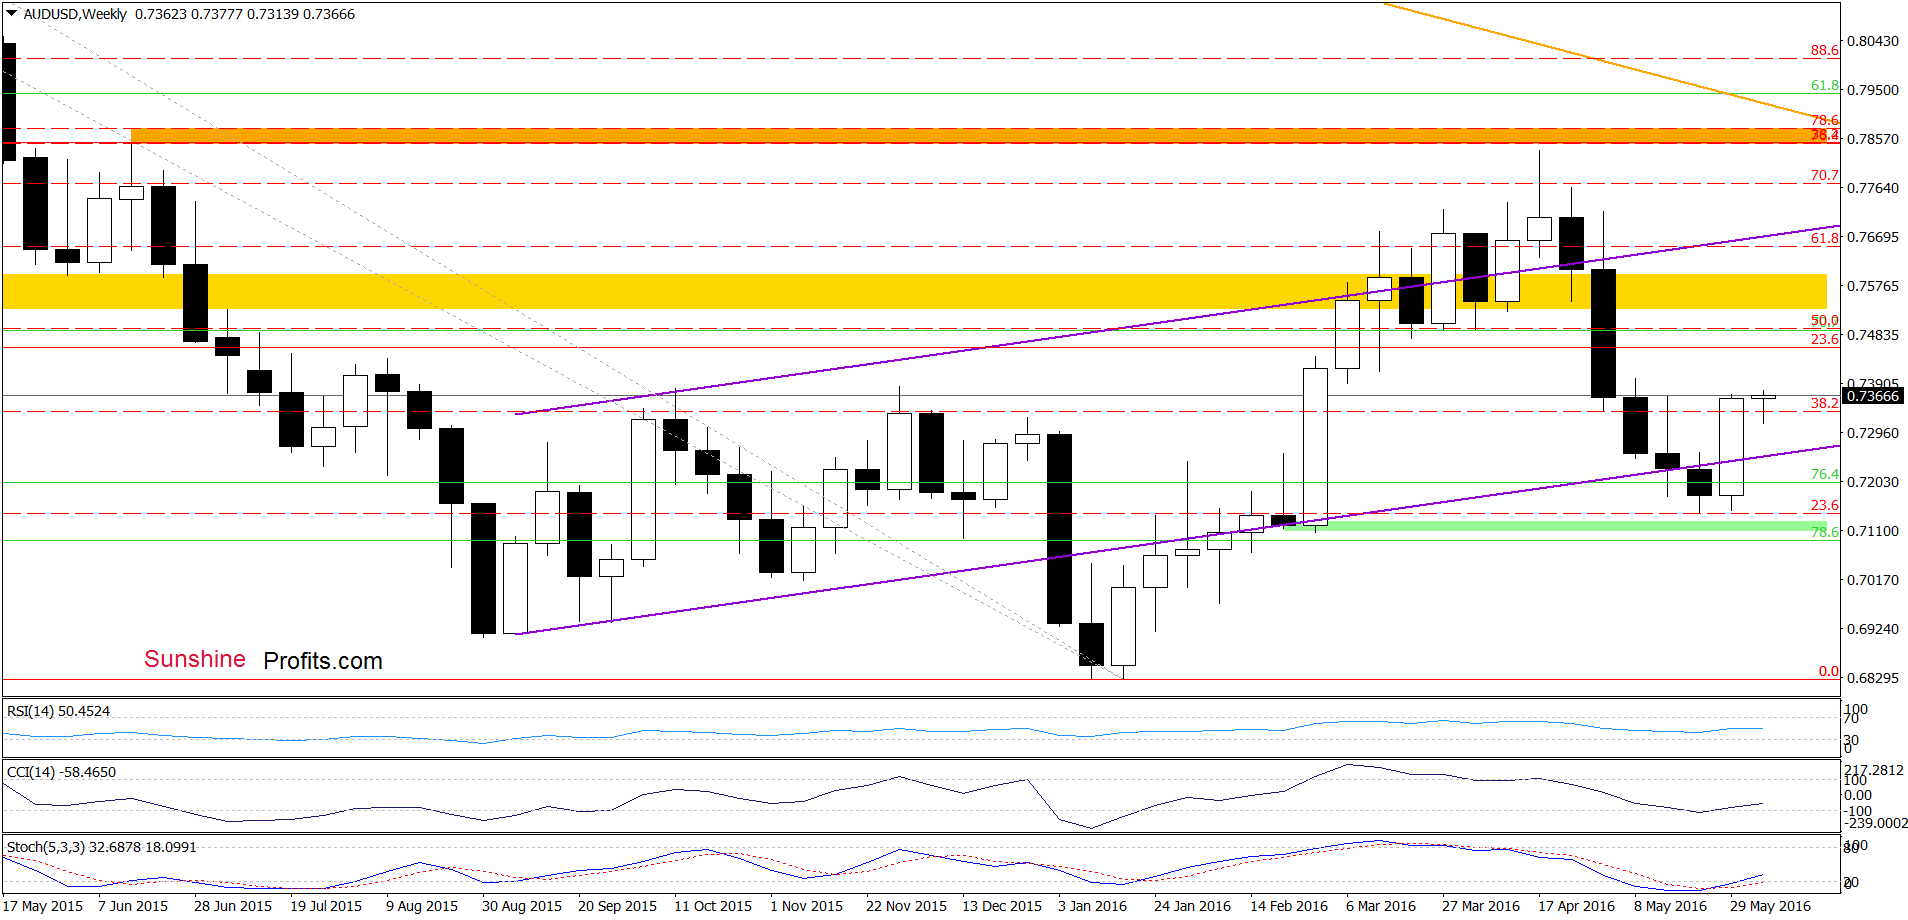
The first thing that catches the eye on the weekly chart is invalidation of the breakdown under the lower border of the purple rising trend channel, which is a positive signal that suggests further improvement in the coming week. This scenario is also supported by the current position of the indicators – the CCI and Stochastic Oscillator generated buy signals, supporting currency bulls.
What impact did this increase have on the very short-term picture? Lets check.
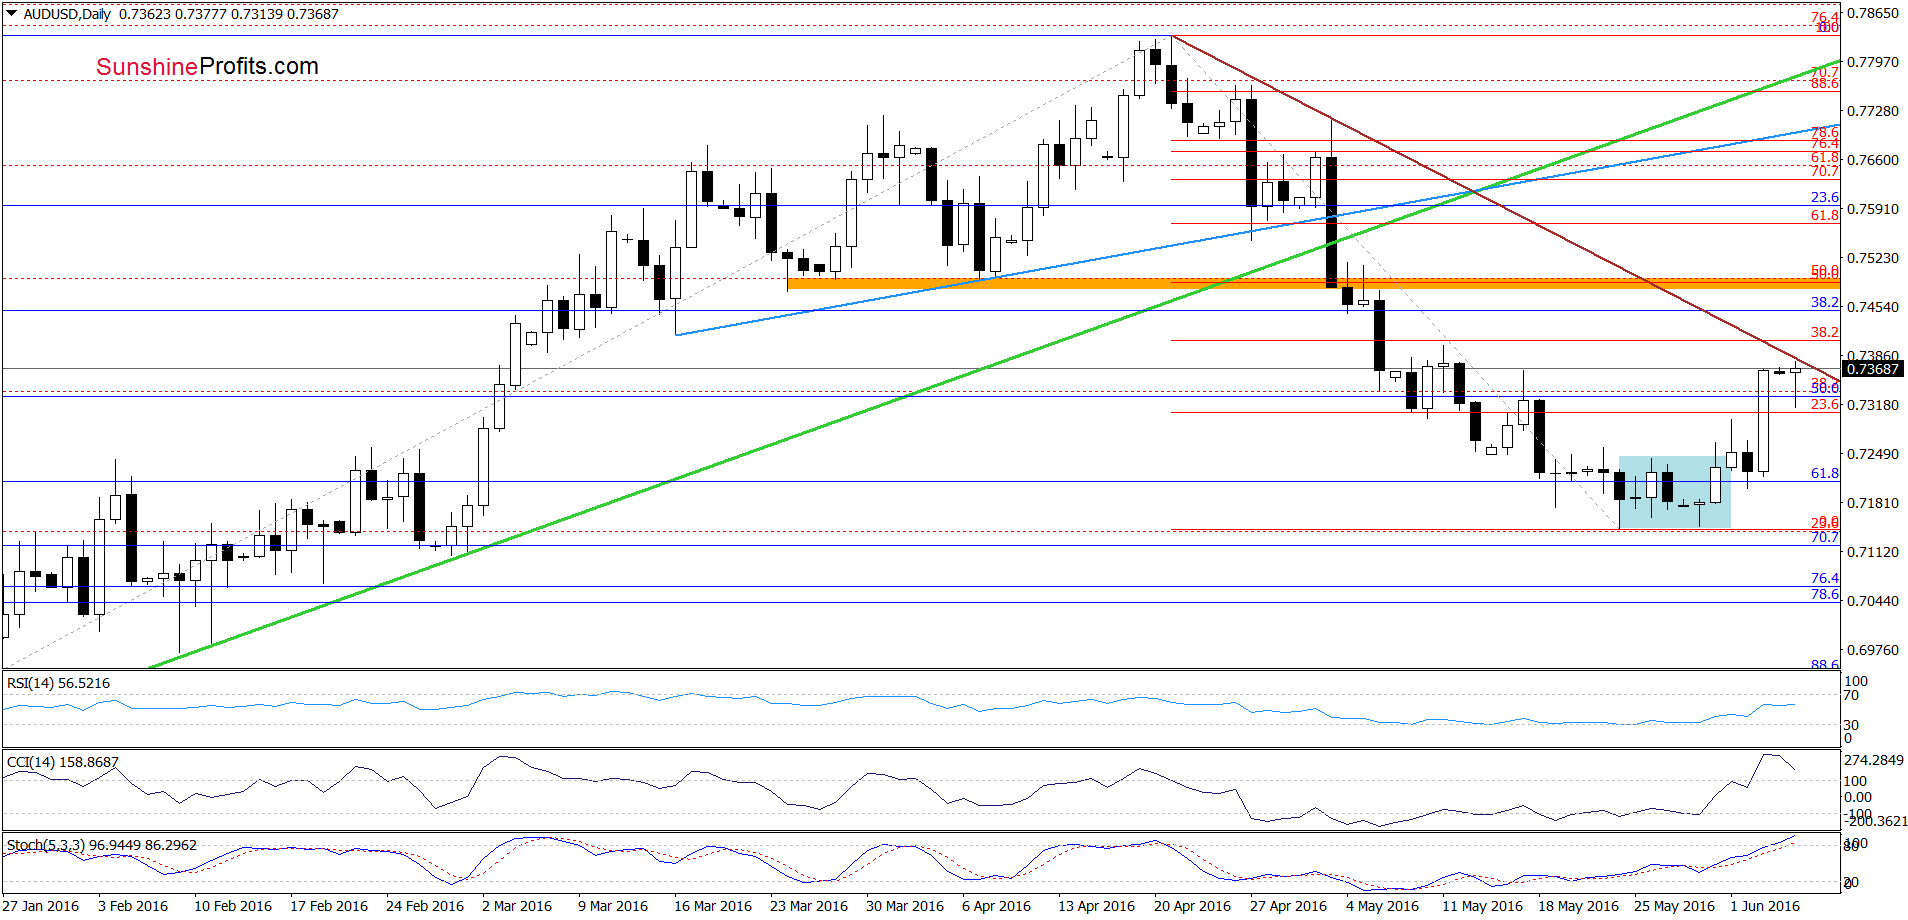
Quoting our last commentary on this currency pair:
(…) AUD/USD extended gains earlier today and came back above the 61.8% Fibonacci retracement (based on the entire Jan-Apr upward move), invalidating earlier breakdown. Taking this positive event into account and combining it with buy signals generated by the indicators we think that further improvement is just around the corner. If this is the case and the exchange rate moves higher from here, the initial upside target would be around 0.7400 (the May 11 peak). Nevertheless, such price action would be more likely if AUD/USD comes back above the lower border of the purple rising trend channel (…)
From today’s point of view, we see that currency bulls pushed the pair higher as we had expected. With this move AUD/USD increased to the brown declining resistance line (based on the Apr and May highs) and approached our initial upside target (the May 11 peak), which may stop further improvement – especially when we factor in the current position of the CCI and Stochastic Oscillator (both indicators are overbought and close to generating sell signals). If this is the case and the pair declines from here, the initial downside target would be around 0.7242, where the upper border of the blue consolidation is.
Very short-term outlook: mixed with bearish bias
Short-term outlook: mixed
MT outlook: mixed
LT outlook: mixed
Trading position (short-term; our opinion): No positions are justified from the risk/reward perspective. We will keep you informed should anything change, or should we see a confirmation/invalidation of the above.
Thank you.
Nadia Simmons
Forex & Oil Trading Strategist
Przemyslaw Radomski, CFA
Founder, Editor-in-chief
Gold & Silver Trading Alerts
Forex Trading Alerts
Oil Investment Updates
Oil Trading Alerts

