

Earlier today, the preliminary reading of the euro zone composite purchasing managers’ index showed a drop to a 16-month low of 52.9 in May, which pushed the euro lower against the greenback and resulted in invalidation of earlier small breakout above the resistance line. What happened at the same time with our other currency pairs?
In our opinion the following forex trading positions are justified - summary:
- EUR/USD: none
- GBP/USD: short (stop-loss order at 1.4785; initial downside target at 1.4220)
- USD/JPY: none
- USD/CAD: none
- USD/CHF: none
- AUD/USD: none
EUR/USD
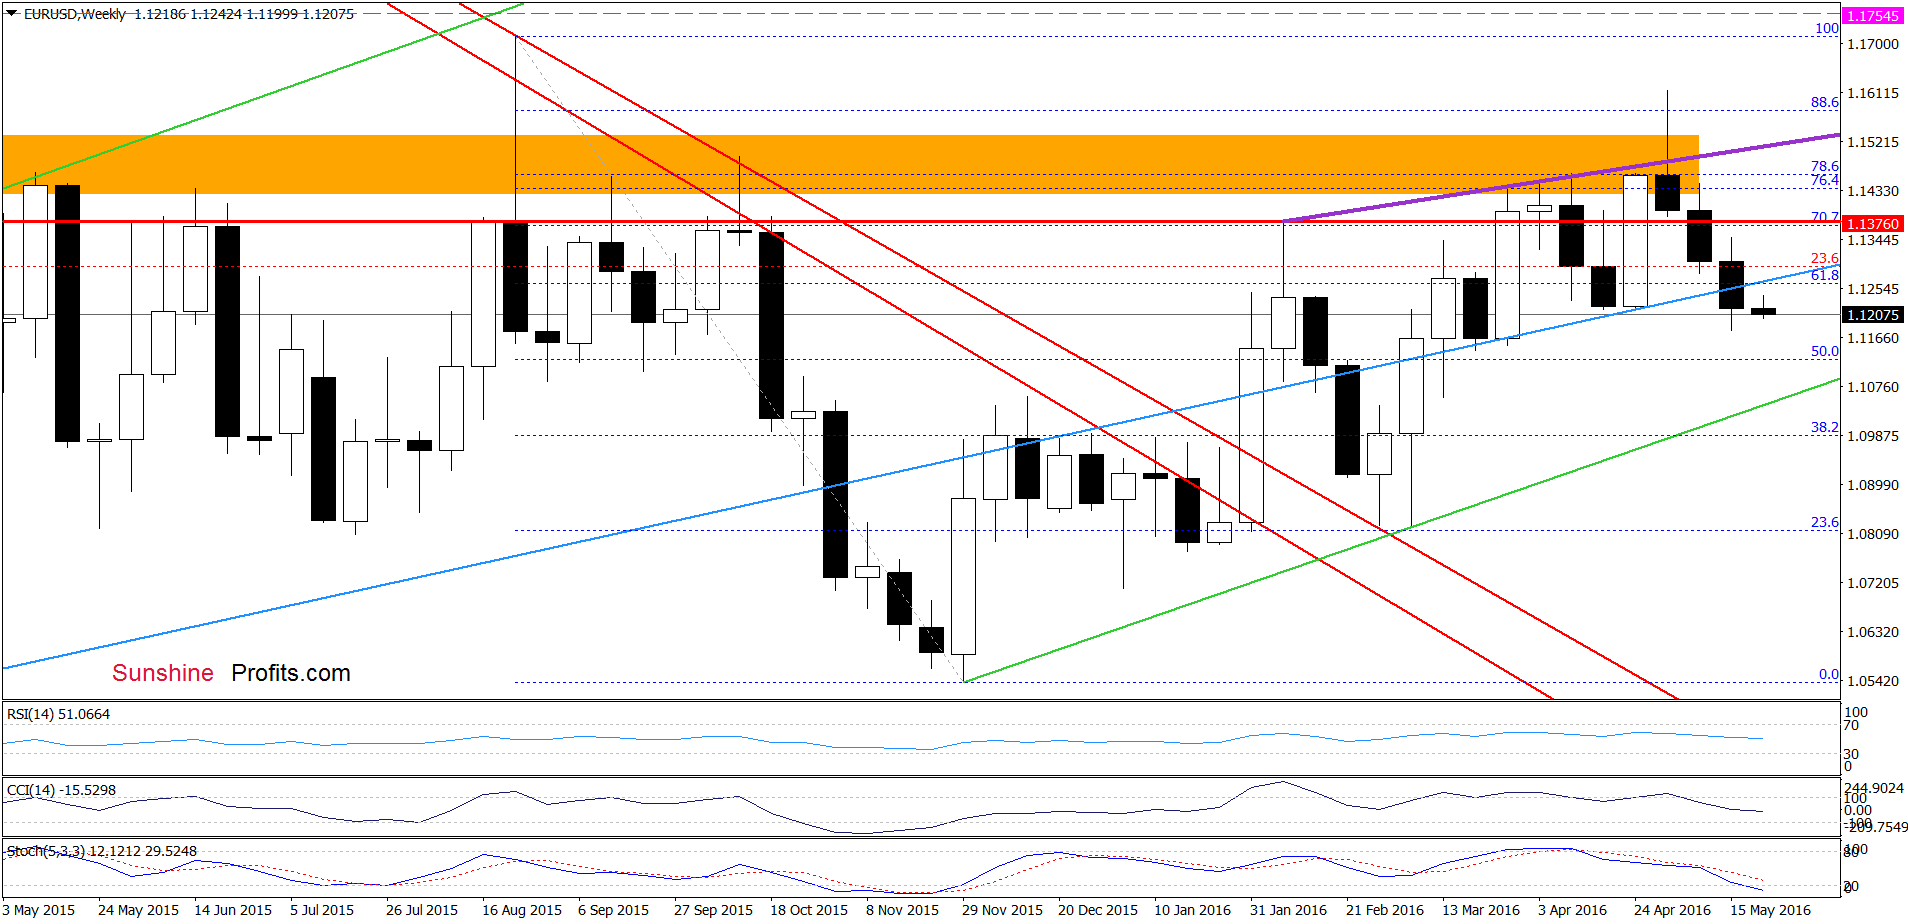
On the weekly chart, we see that the situation in the medium-term hasn’t changed much as EUR/USD is still trading under the previously-broken support/resistance line based on the March and Apr 2015 lows. Today, we’ll focus on the very short-term changes.
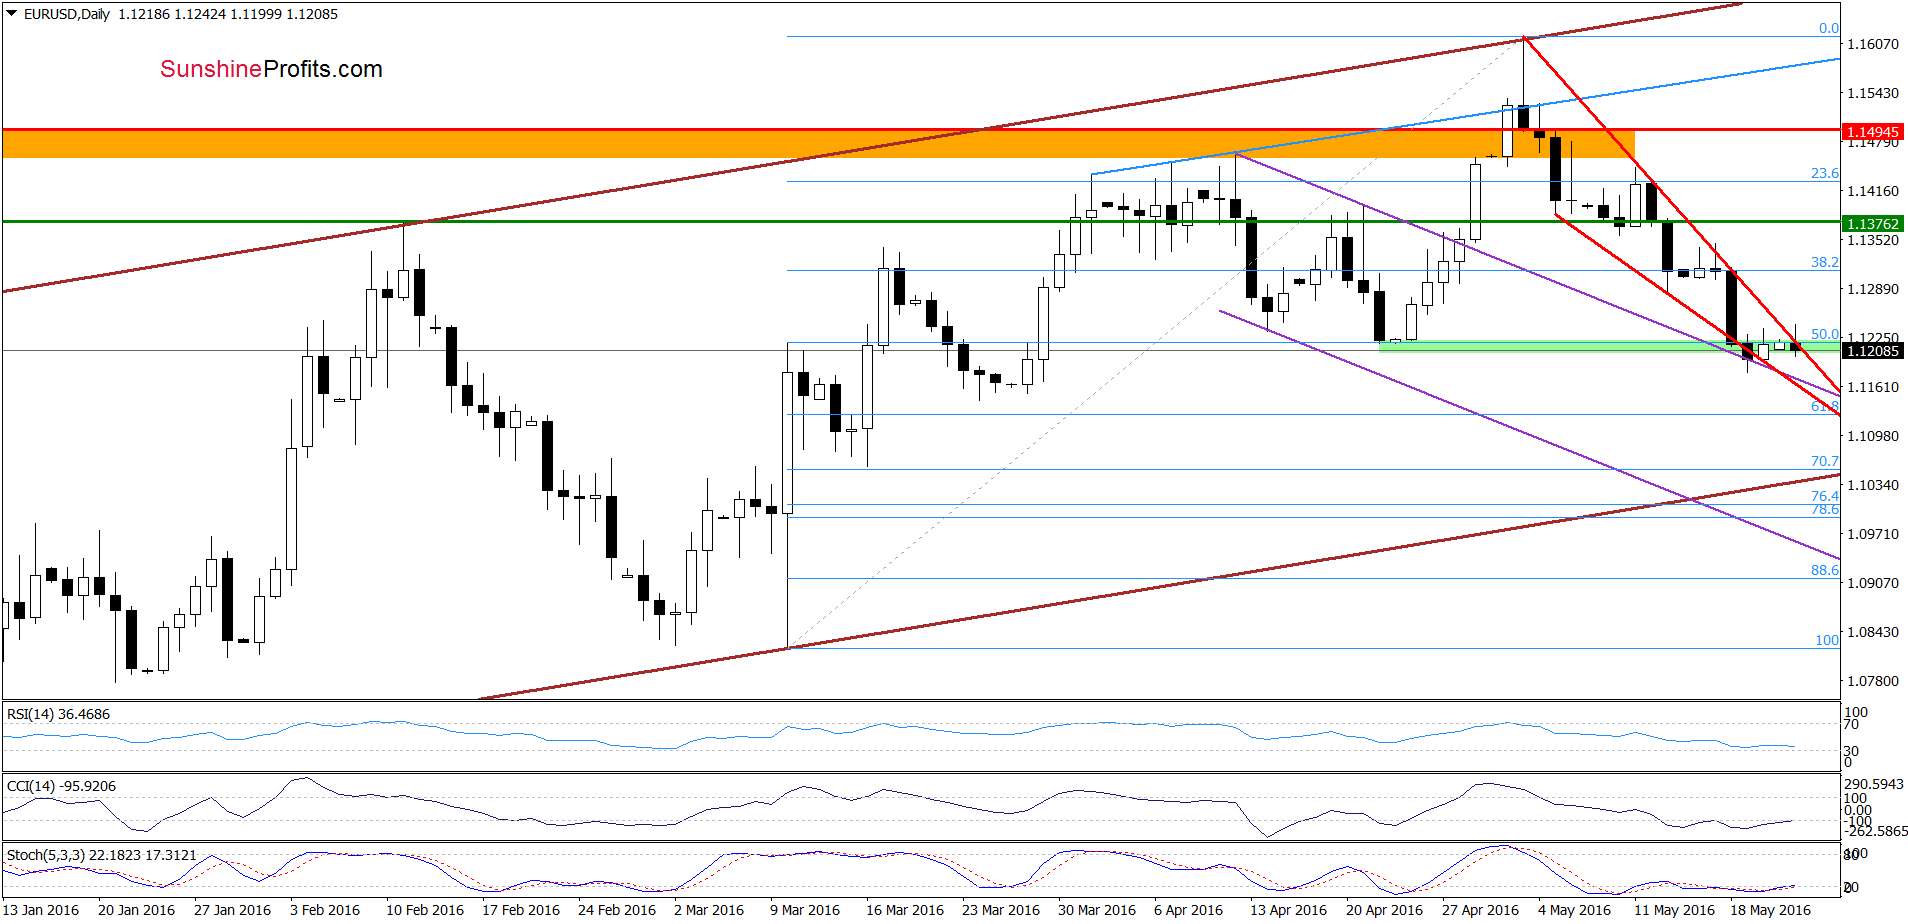
From today’s point of view, we see that EUR/USD remains in a narrow range inside the red declining wedge. Earlier today, currency bulls tried to push the pair above the upper line of the formation, but they failed, which resulted in a small pullback. Despite this move, the green support zone continues to keep declines in check, which in combination with buy signals generated by the CCI and Stochastic Oscillator suggests another attempt to move higher in the coming week.
Very short-term outlook: mixed with bullish bias
Short-term outlook: mixed
MT outlook: mixed
LT outlook: mixed
Trading position (short-term; our opinion): No positions are justified from the risk/reward perspective. We will keep you informed should anything change, or should we see a confirmation/invalidation of the above.
GBP/USD
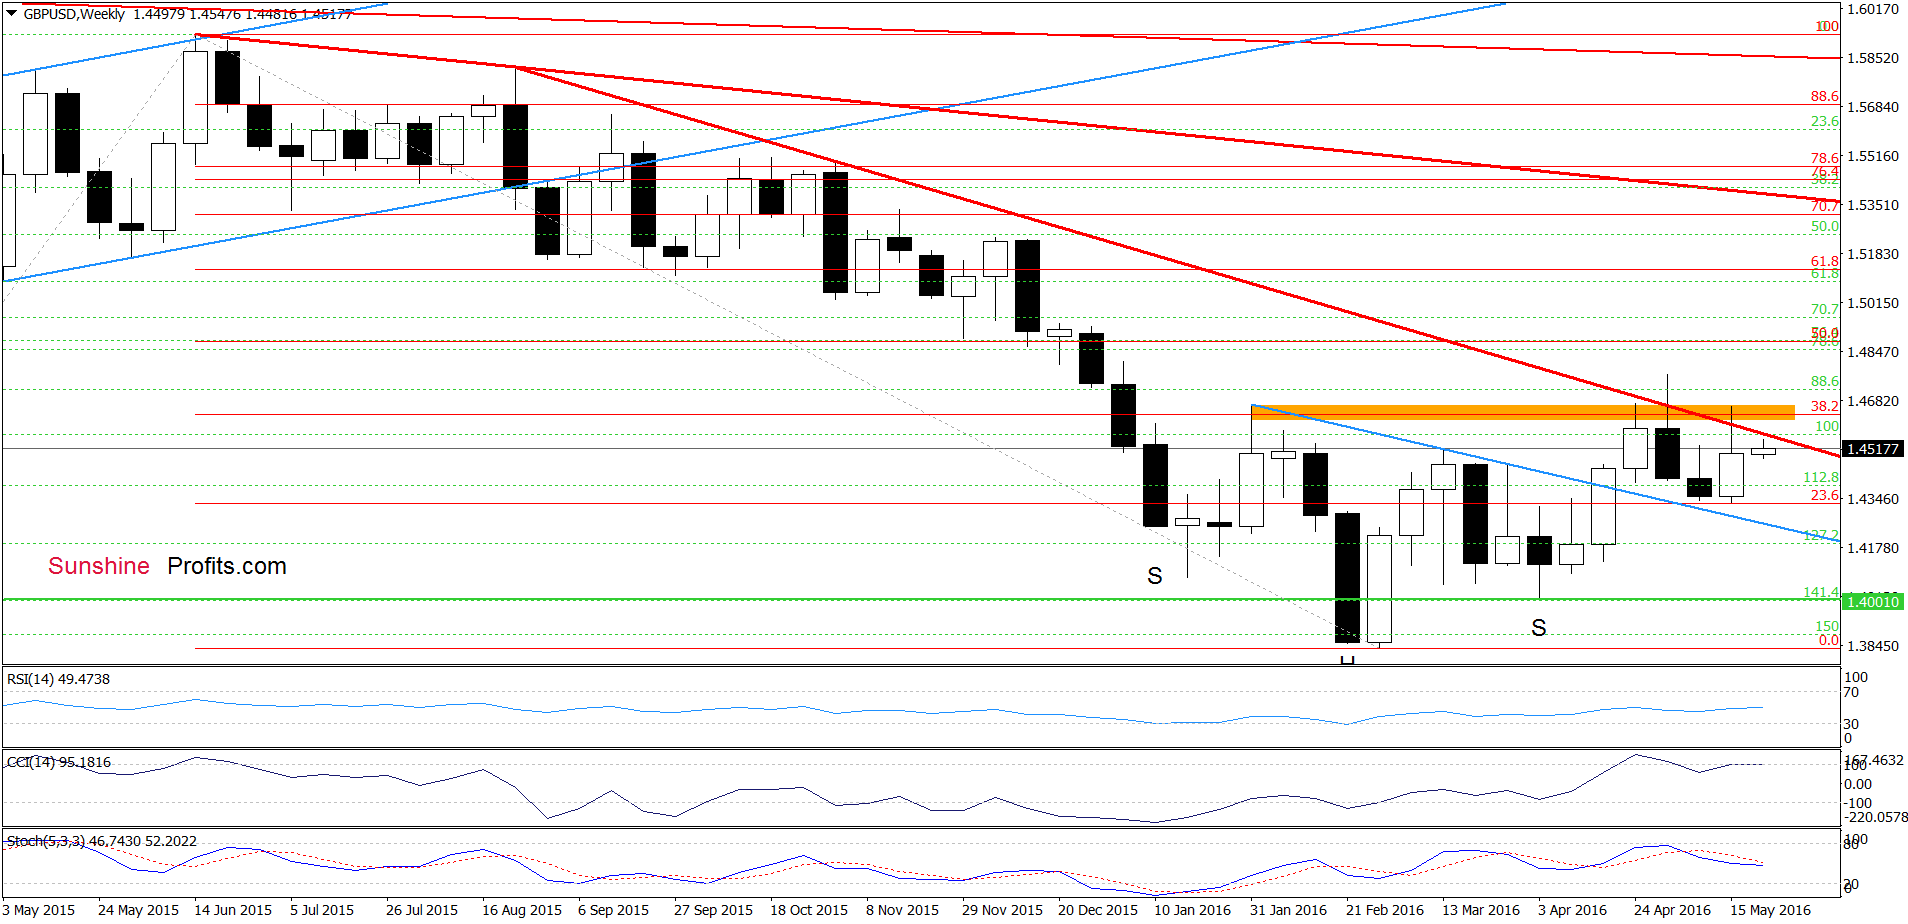
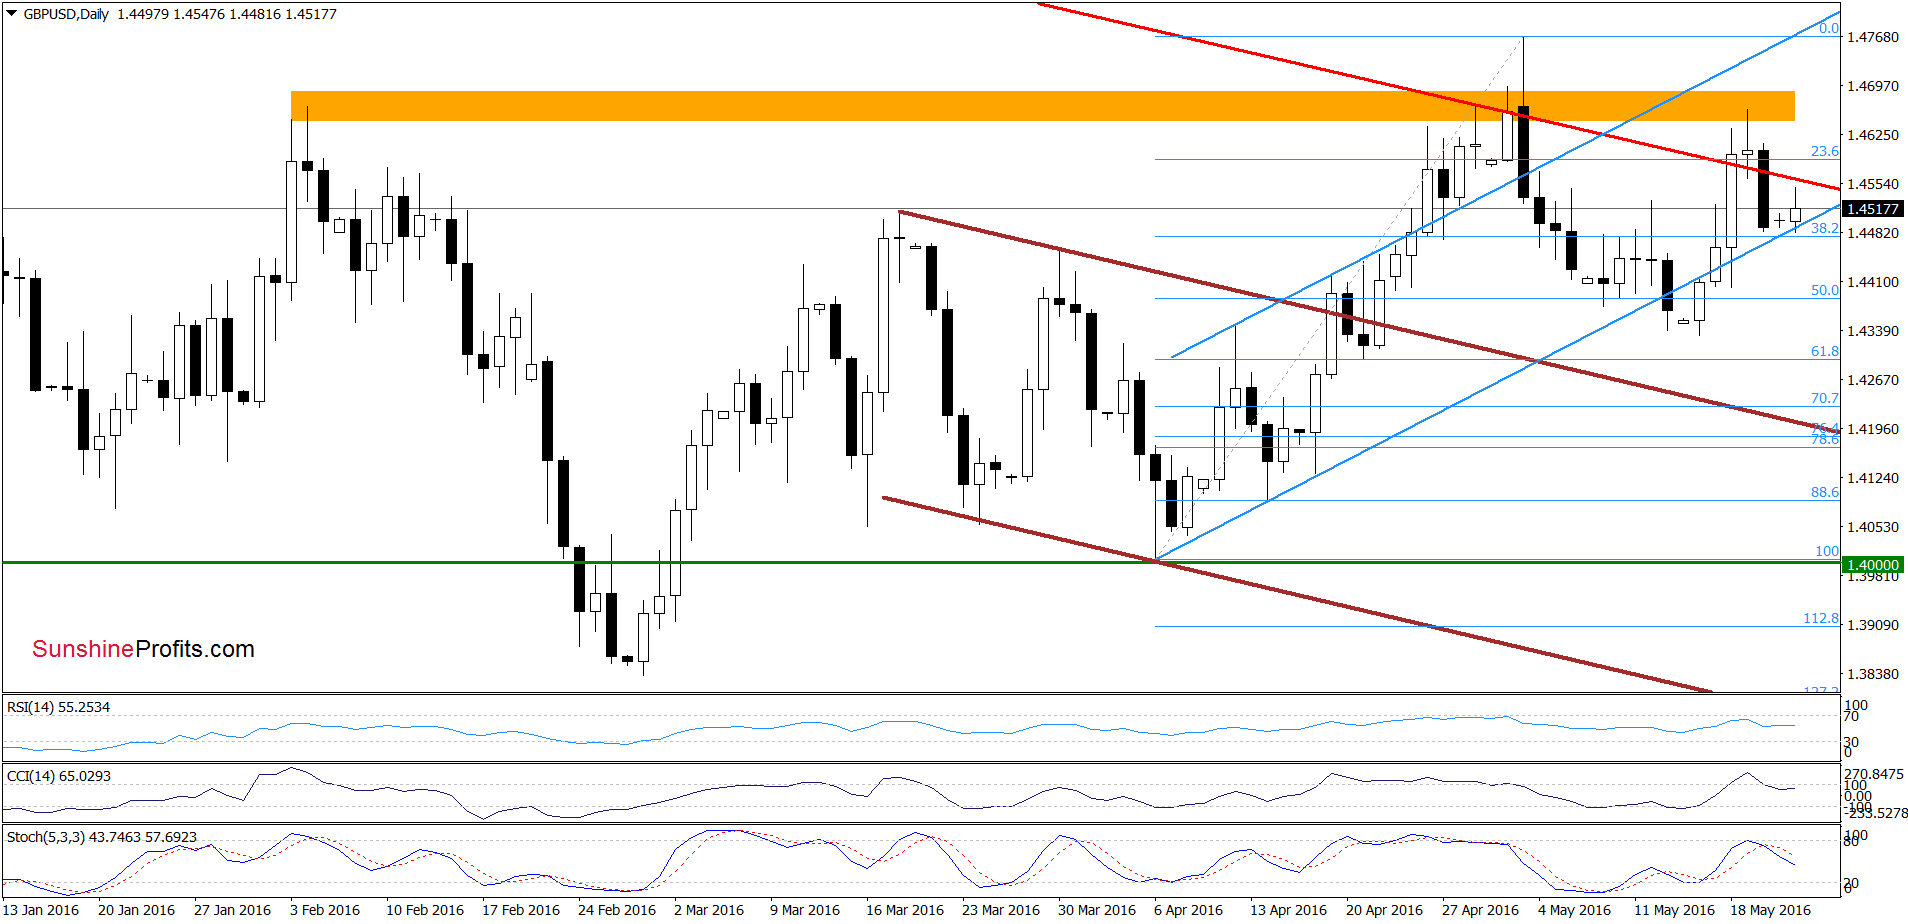
On the daily chart, we see that GBP/USD dropped under the long-term red declining resistance line (seen more clearly on the weekly chart), which triggered a sharp decline on Friday. In this way, the pair invalidated earlier breakout above this line, which is a negative signal that suggests further deterioration – similarly to what we saw at the beginning of the month (back then similar invalidation triggered further declines). Additionally, the CCI and Stochastic Oscillator generated sell signals, supporting currency bears. Taking all the above into account, we think that re-opening short positions is justified from the risk/reward perspective at the moment.
Very short-term outlook: bearish
Short-term outlook: bearish
MT outlook: mixed with bearish bias
LT outlook: mixed
Trading position (short-term; our opinion): Short positions (with a stop-loss order at 1.4785 and initial downside target at 1.4220) are justified from the risk/reward perspective at the moment. We will keep you informed should anything change, or should we see a confirmation/invalidation of the above.
USD/JPY
Quoting our previous commentary on this currency pair:
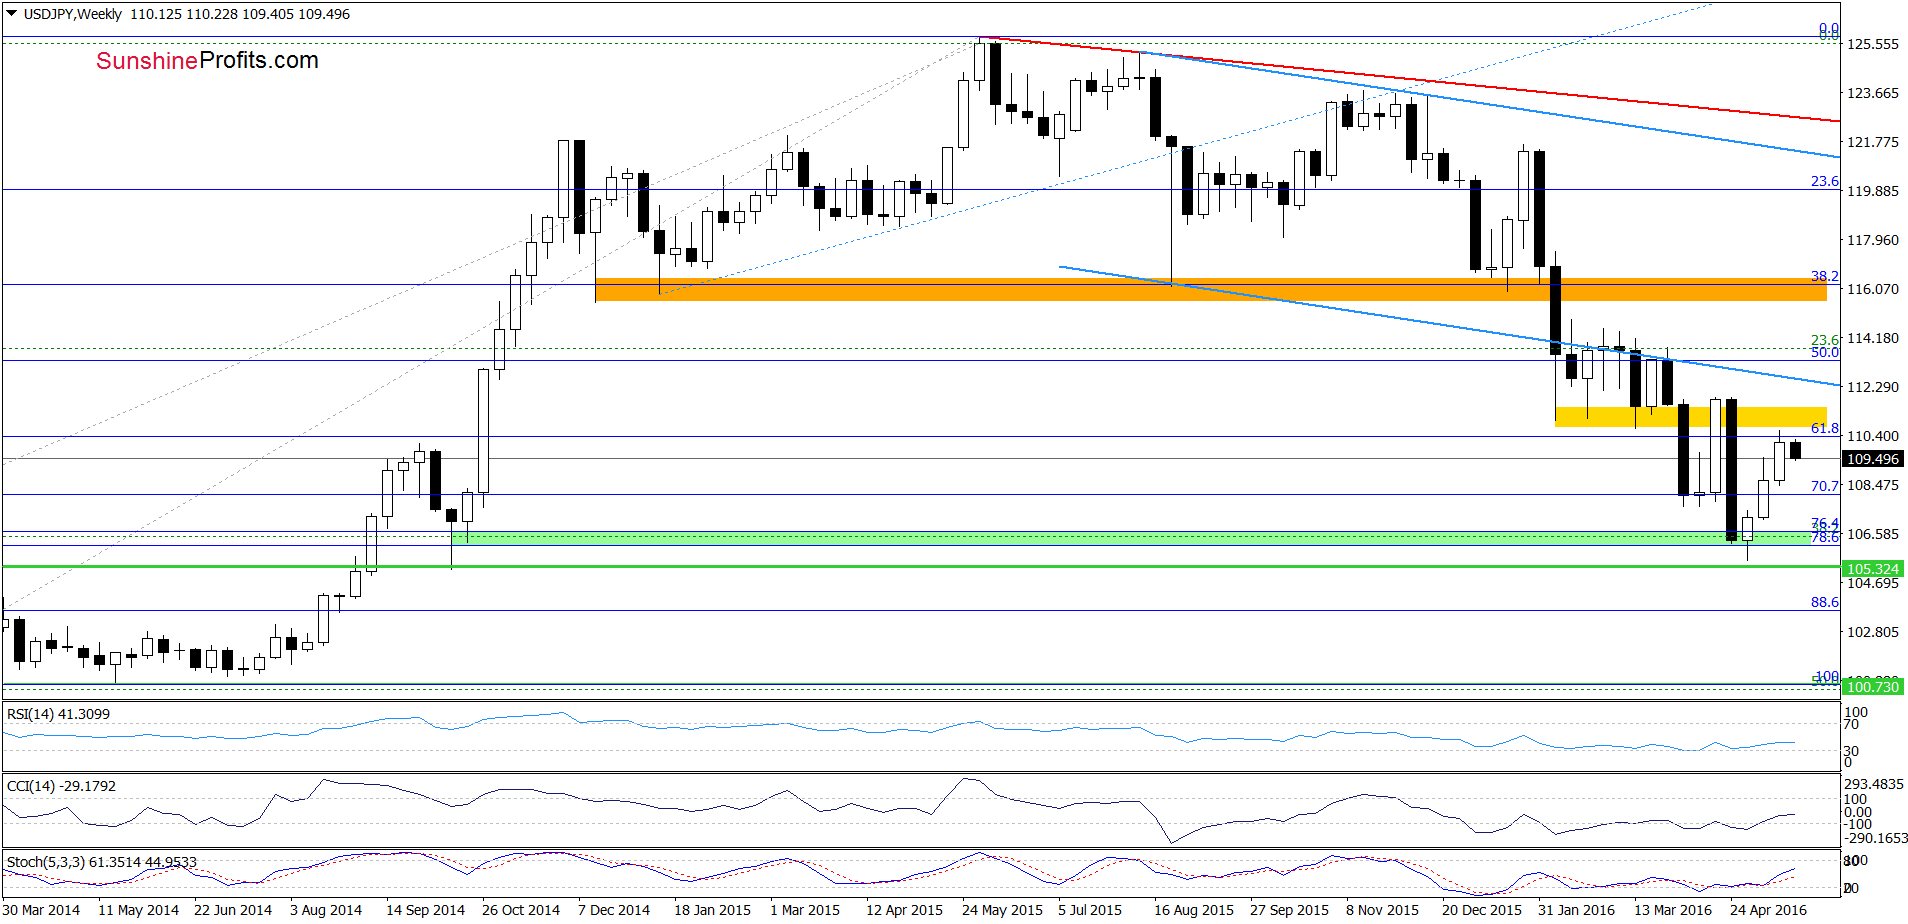
(…) USD/JPY extended gains and (…) climbed to the 23.6% Fibonacci retracement based on the entire Jun 2015-May 2016 downward move. (…) in this area is also blue resistance line based on the previous highs, which in combination with the current position of the indicators (the CCI and Stochastic Oscillator are overbought) may encourage currency bears to act in the coming days. (…) the recent upward move approached USD/JPY to the yellow resistance zone created by the Feb and March lows, which may pause further rally in the coming week.
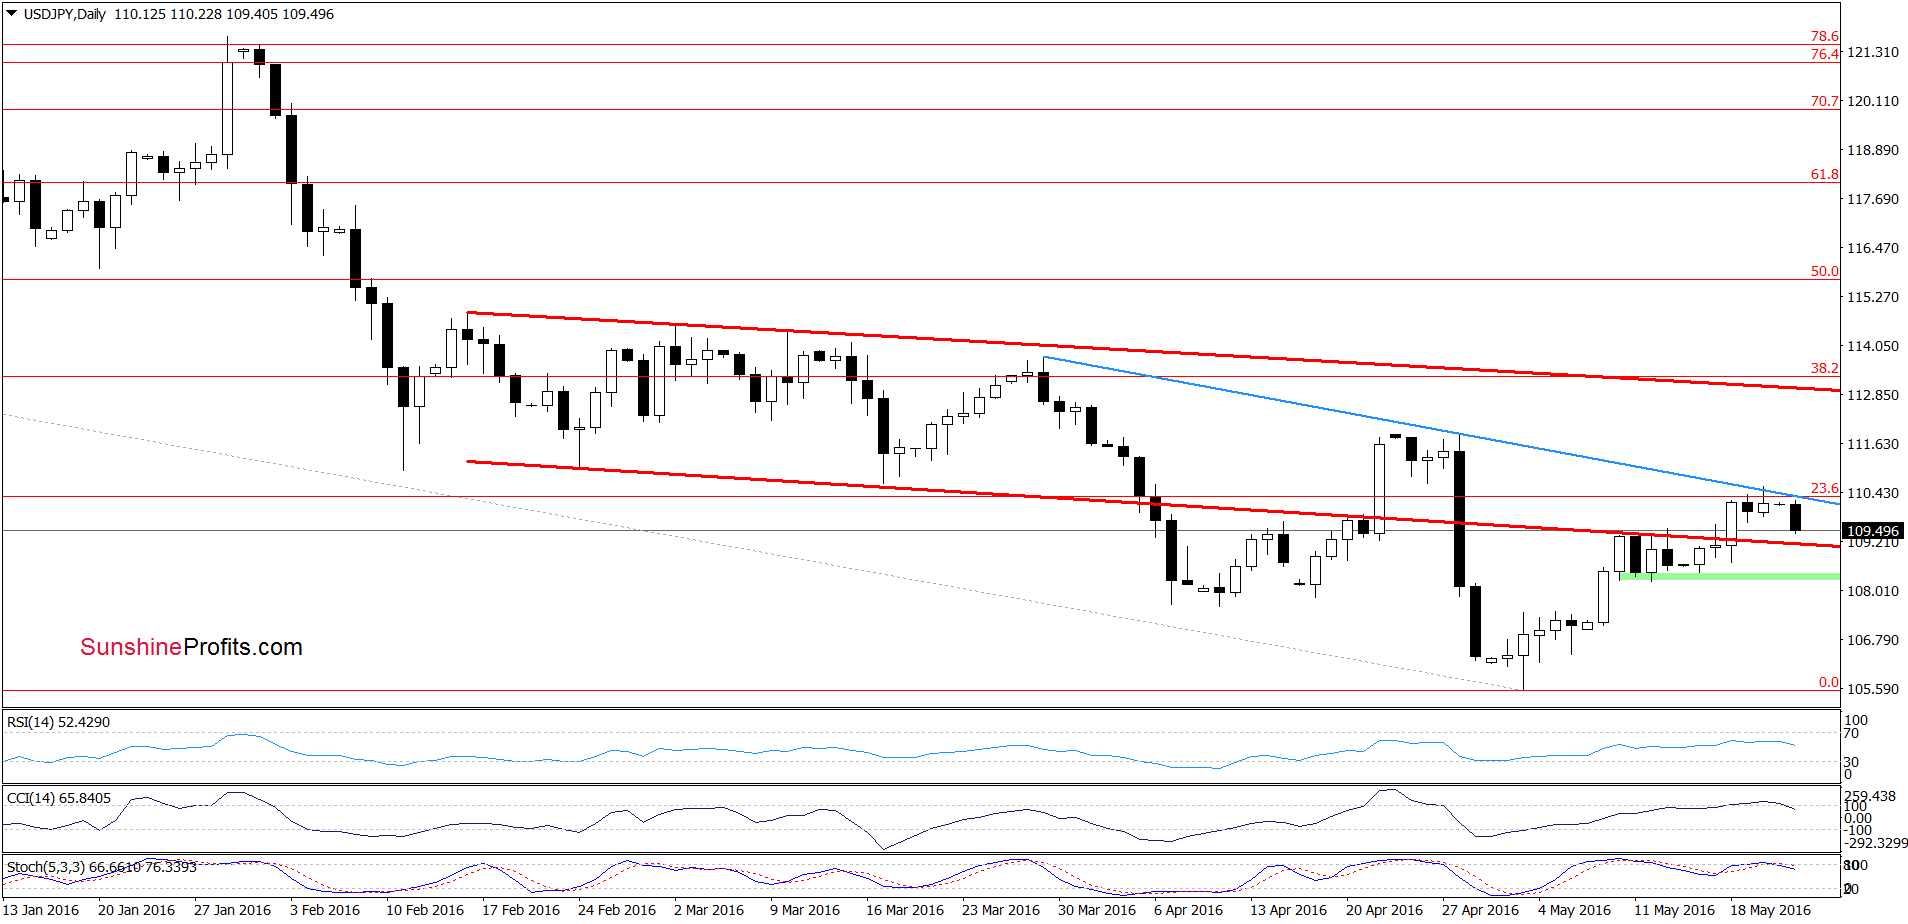
From today’s point of view, we see that the situation developed in line with the above scenario and USD/JPY moved lower earlier today. Additionally, the CCI and Stochastic Oscillator generated sell signals, which suggests further deterioration in the coming days. Therefore, if the pair drops under the previously-broken red line, we’ll likely see (at least) a test of the green support zone created by the mid-May lows (around 108.21-108.47)
Very short-term outlook: mixed with bearish bias
Short-term outlook: mixed
MT outlook: mixed
LT outlook: mixed
Trading position (short-term; our opinion): No positions are justified from the risk/reward perspective at the moment. We will keep you informed should anything change, or should we see a confirmation/invalidation of the above.
USD/CAD
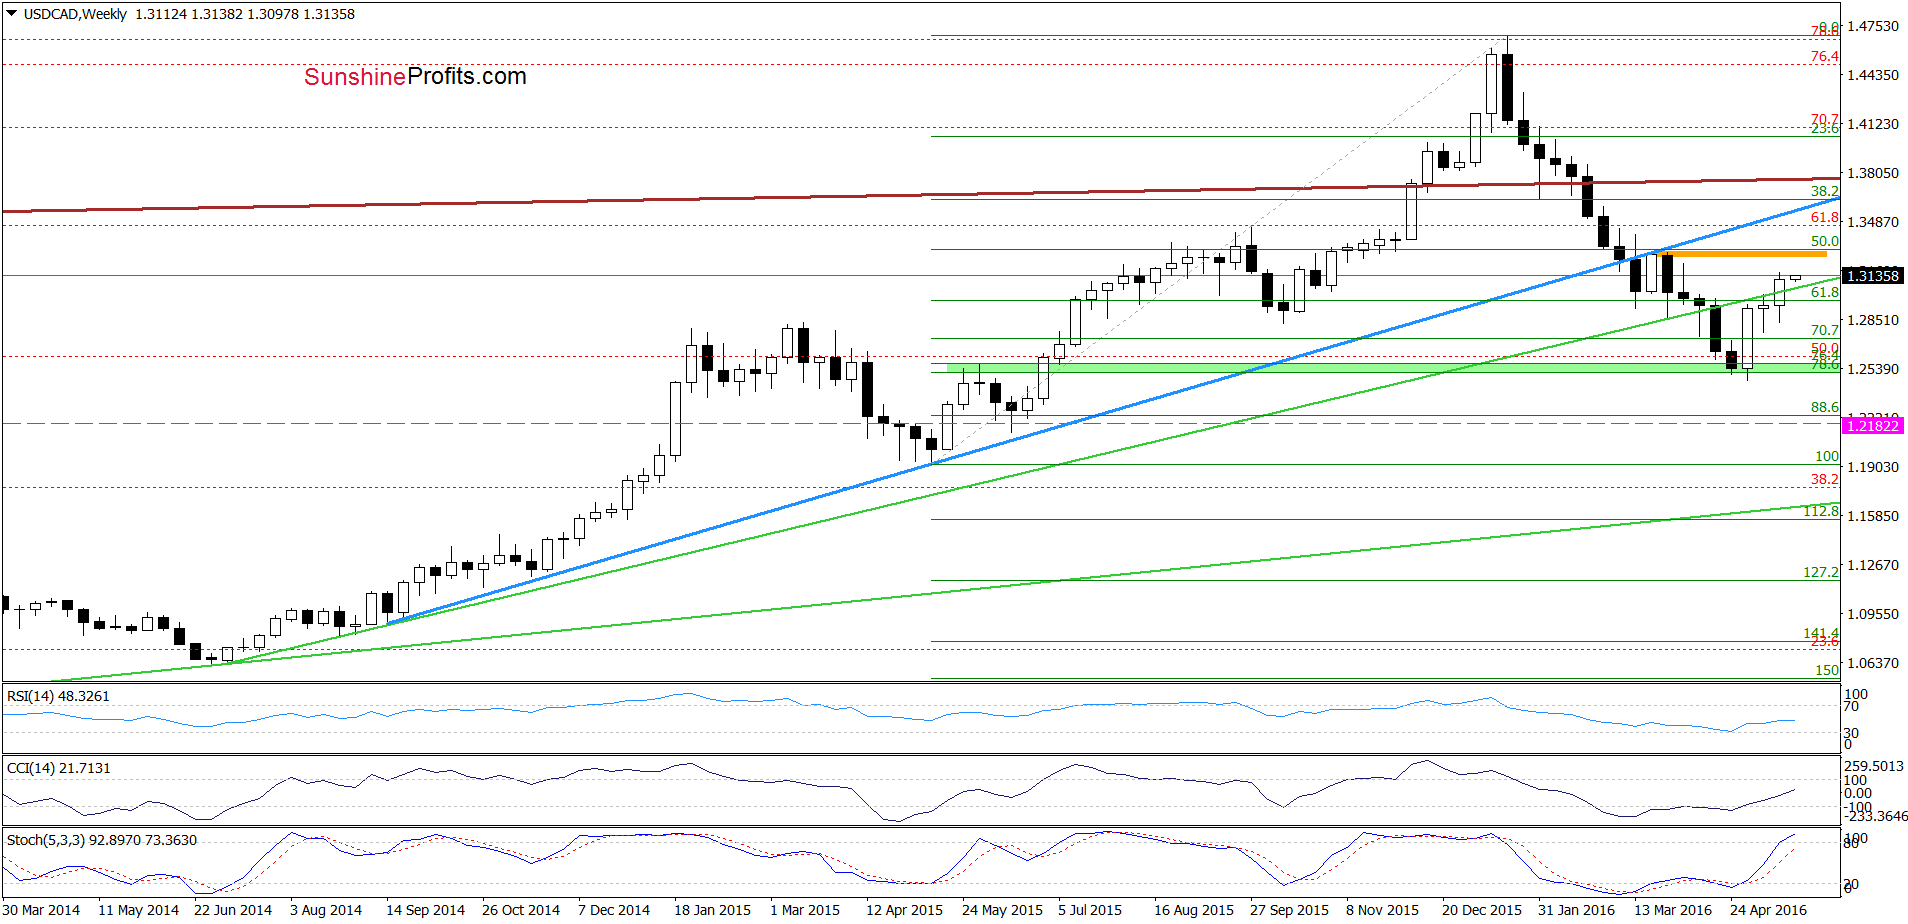
The first thing that catches the eye on the weekly chart is comeback above the previously-broken green support/resistance line, which is a positive signal that suggests further improvement and a test of the orange resistance zone created by the late-Mar highs (around 1.3283-1.3294) in the coming week.
Will the very short-term picture confirm this pro-growth scenario? Let’s check.
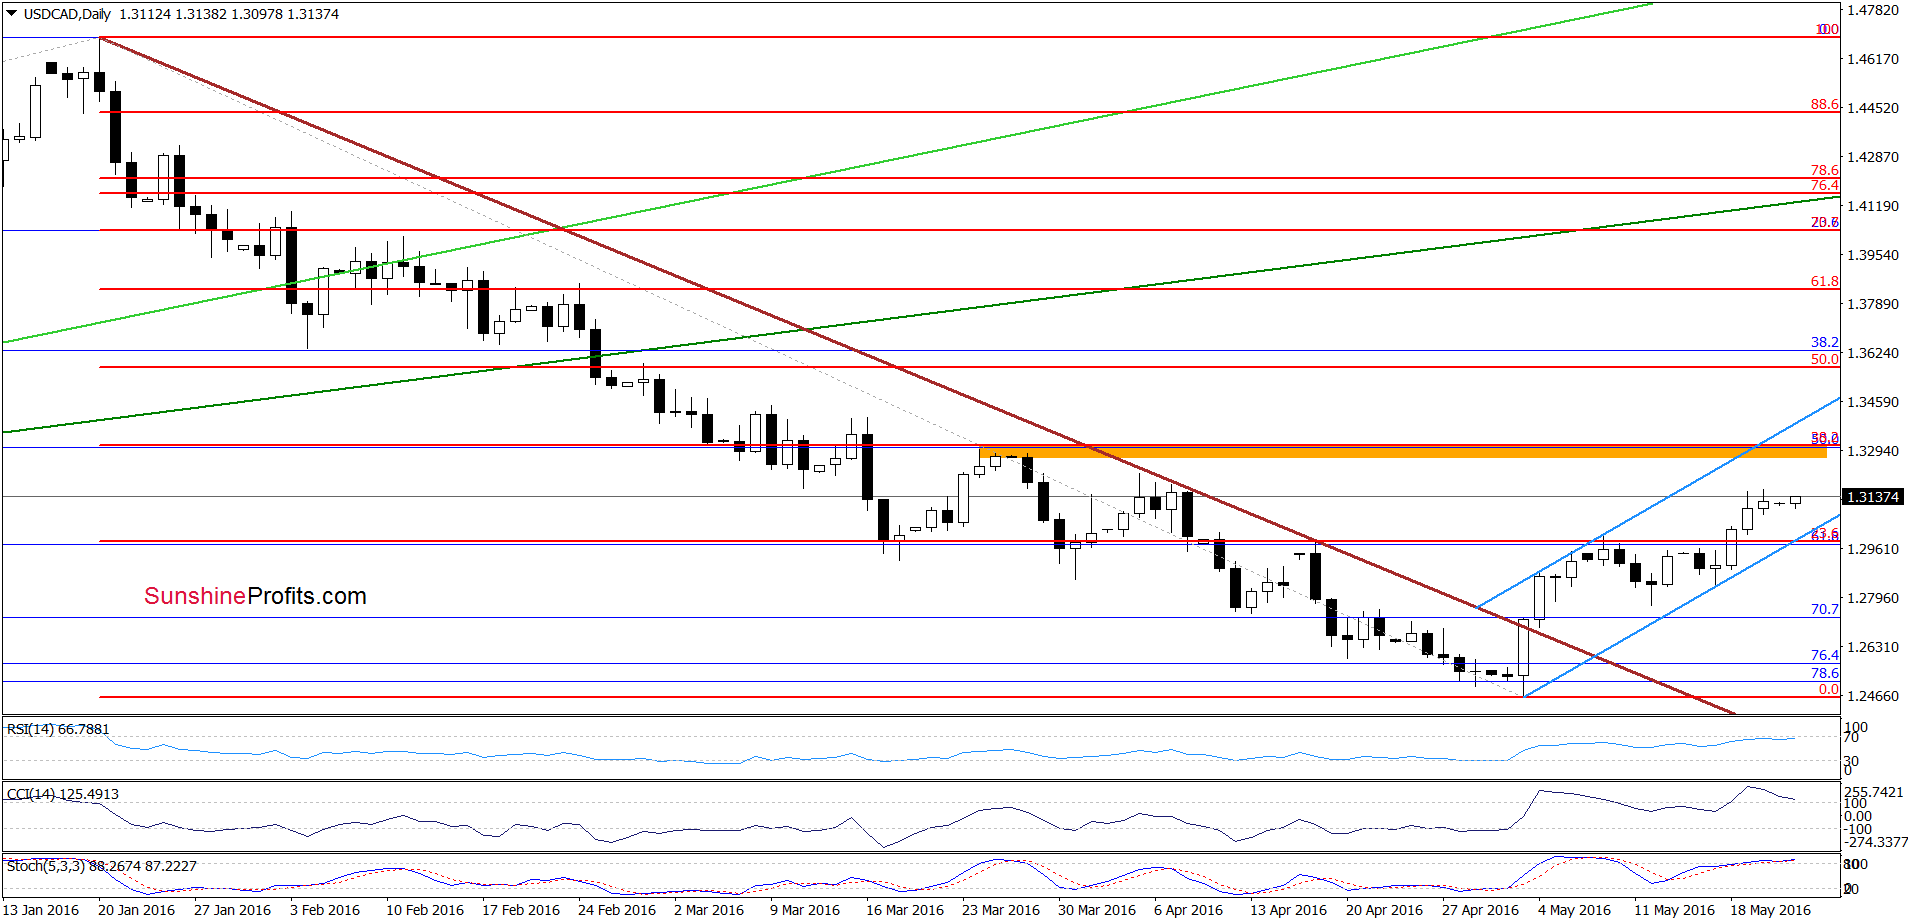
Looking at the daily chart, we see that USD/CAD broke above the resistance zone created by the 23.6% Fibonacci retracement (based on the entire Jan-May decline), the barrier of 1.3000 and the previous peak, which resulted in increase to the Apr highs. If this area is broken, we’ll see a test of the orange resistance zone created by the late-Mar highs and the 38.2% Fibonacci retracement. However, taking into account the current position of the indicators (the CCI and Stochastic Oscillators are overbought, while the RSI approached the level of 70), we think that this area will be strong enough to stop further improvement and trigger a correction n the coming days.
Very short-term outlook: mixed
Short-term outlook: mixed with bearish bias
MT outlook: mixed
LT outlook: mixed
Trading position (short-term; our opinion): No positions are justified from the risk/reward perspective. We will keep you informed should anything change, or should we see a confirmation/invalidation of the above.
USD/CHF
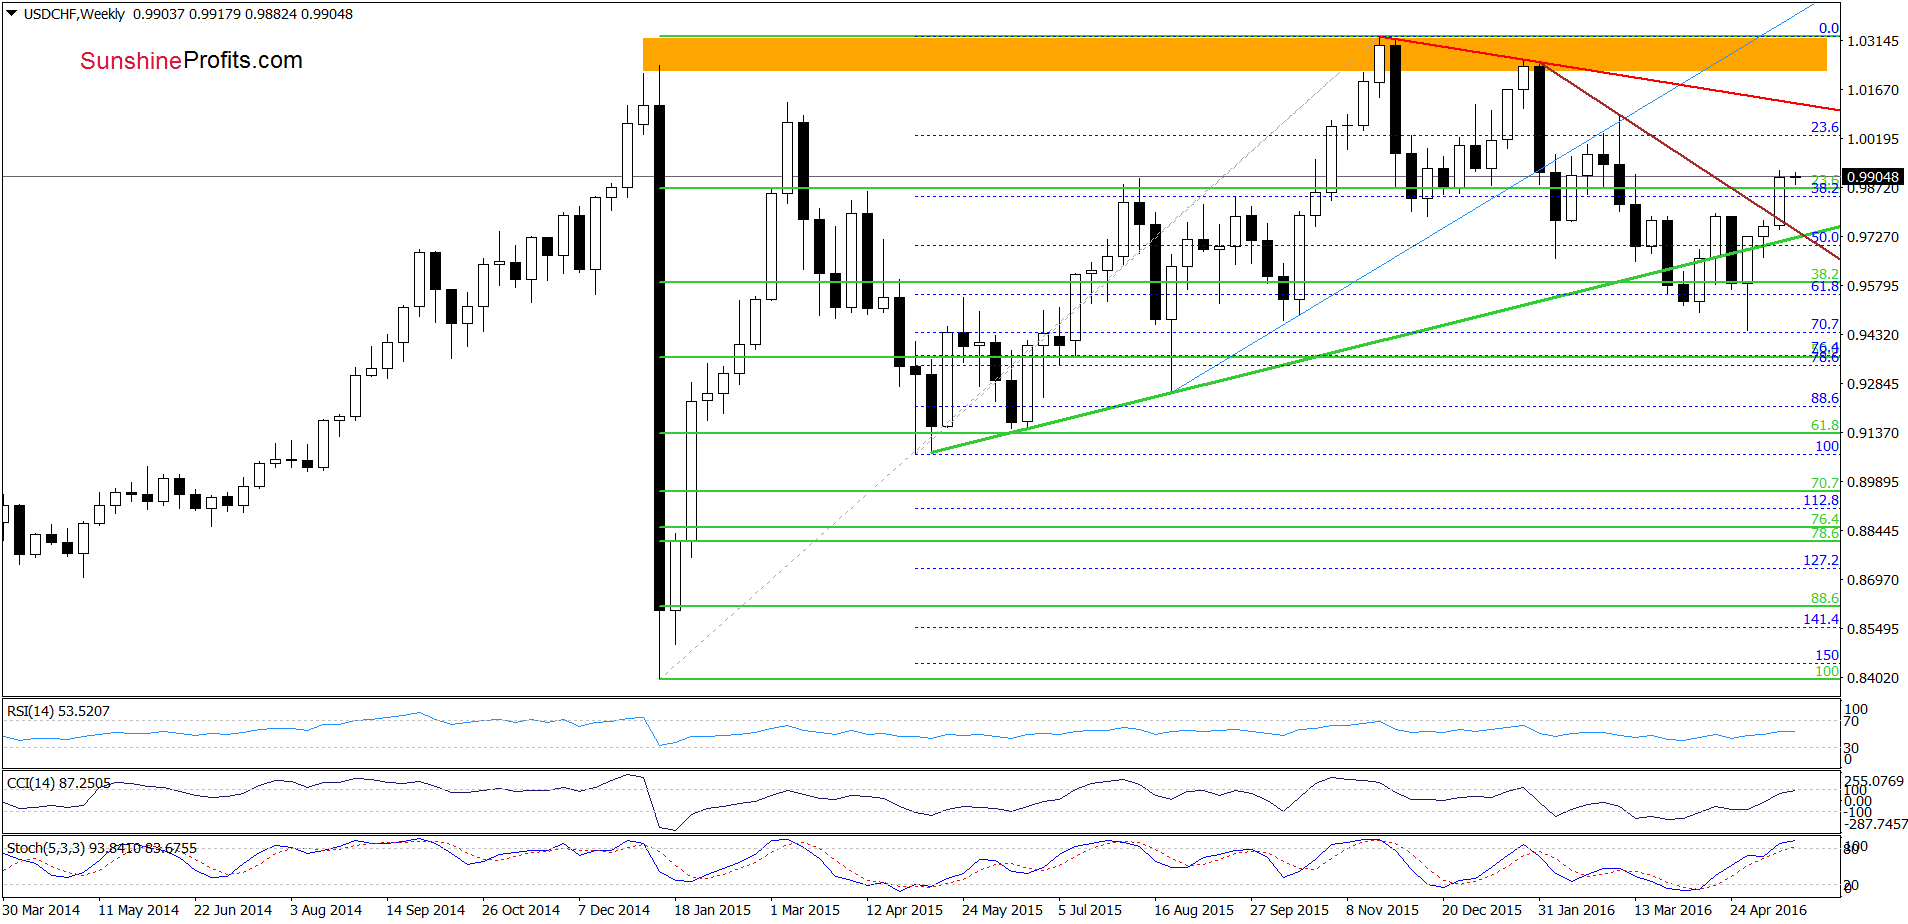
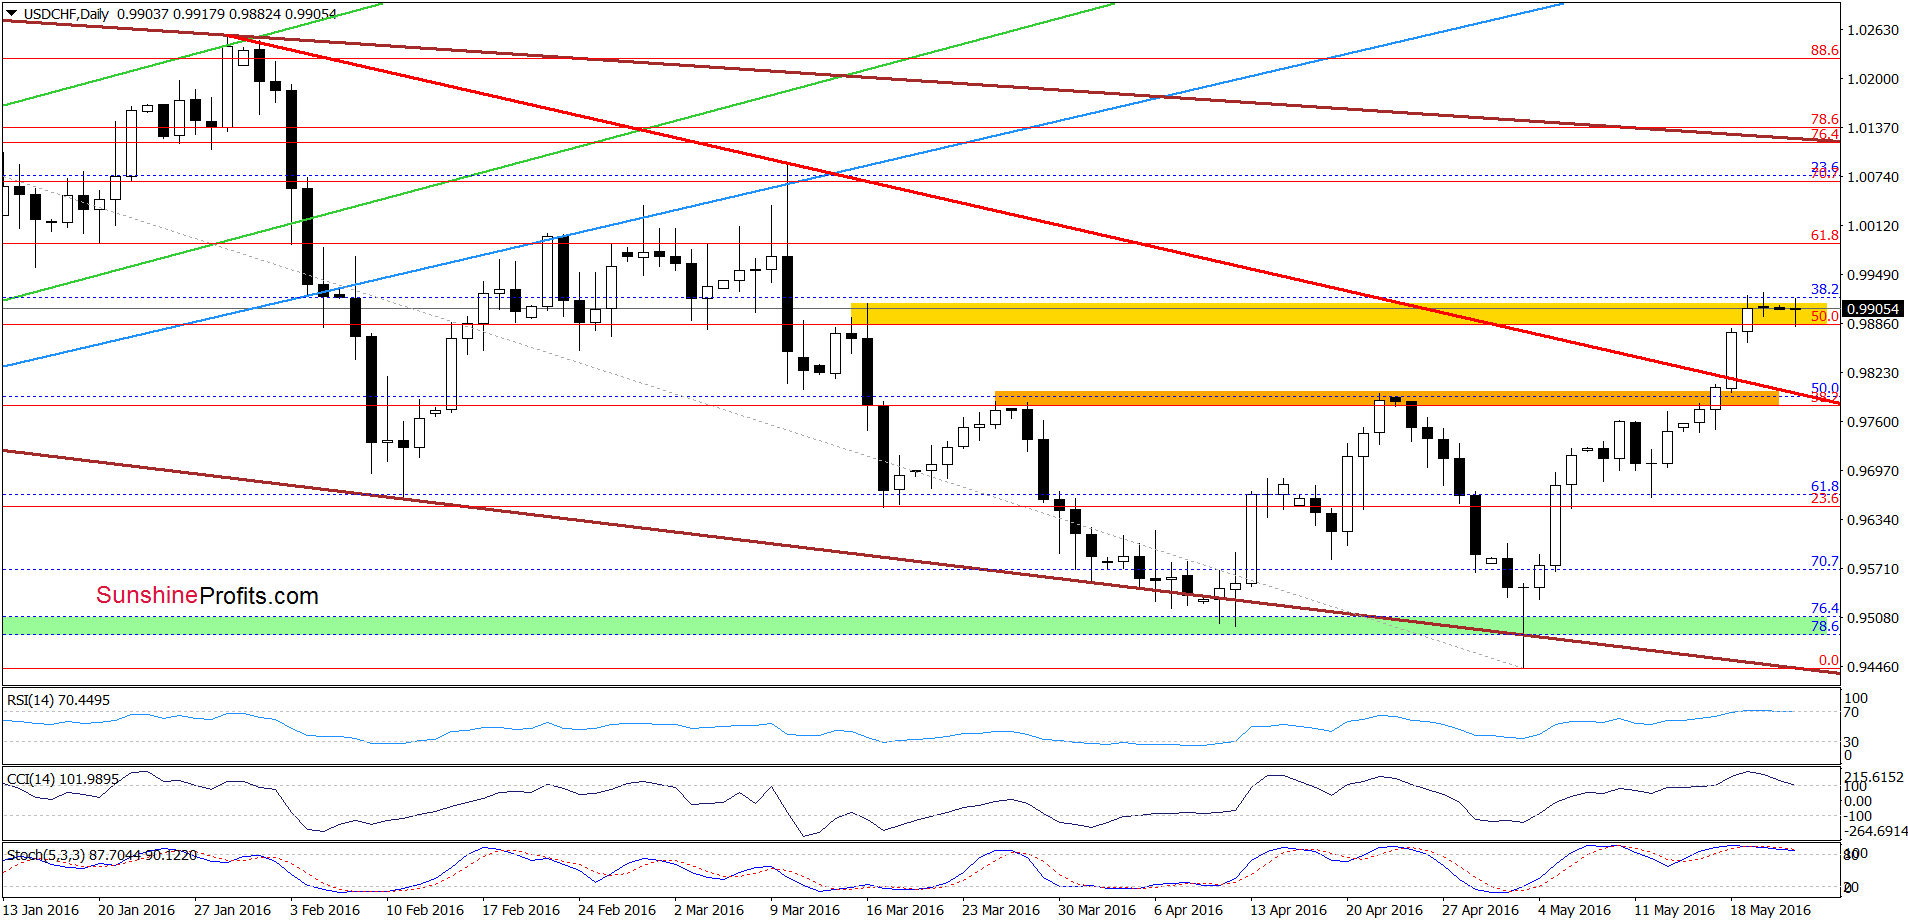
On the above charts, we see that the overall situation hasn’t changed much since our Friday’s commentary as USD/CHF is consolidating in the yellow resistance zone created by the 50% retracement and the mid-March highs. What’s next? The current position of all indicators suggests that reversal and lower values of the exchange rate in the coming week are very likely. Therefore, if we see such price action and USD/CHF declines from this area, the initial downside target would be around 0.9793, where the previously-broken red declining line (based on the Jan and Mar highs) and the orange zone are.
Very short-term outlook: mixed
Short-term outlook: mixed
MT outlook: mixed
LT outlook: mixed
Trading position (short-term; our opinion): No positions are justified from the risk/reward perspective. We will keep you informed should anything change, or should we see a confirmation/invalidation of the above.
AUD/USD
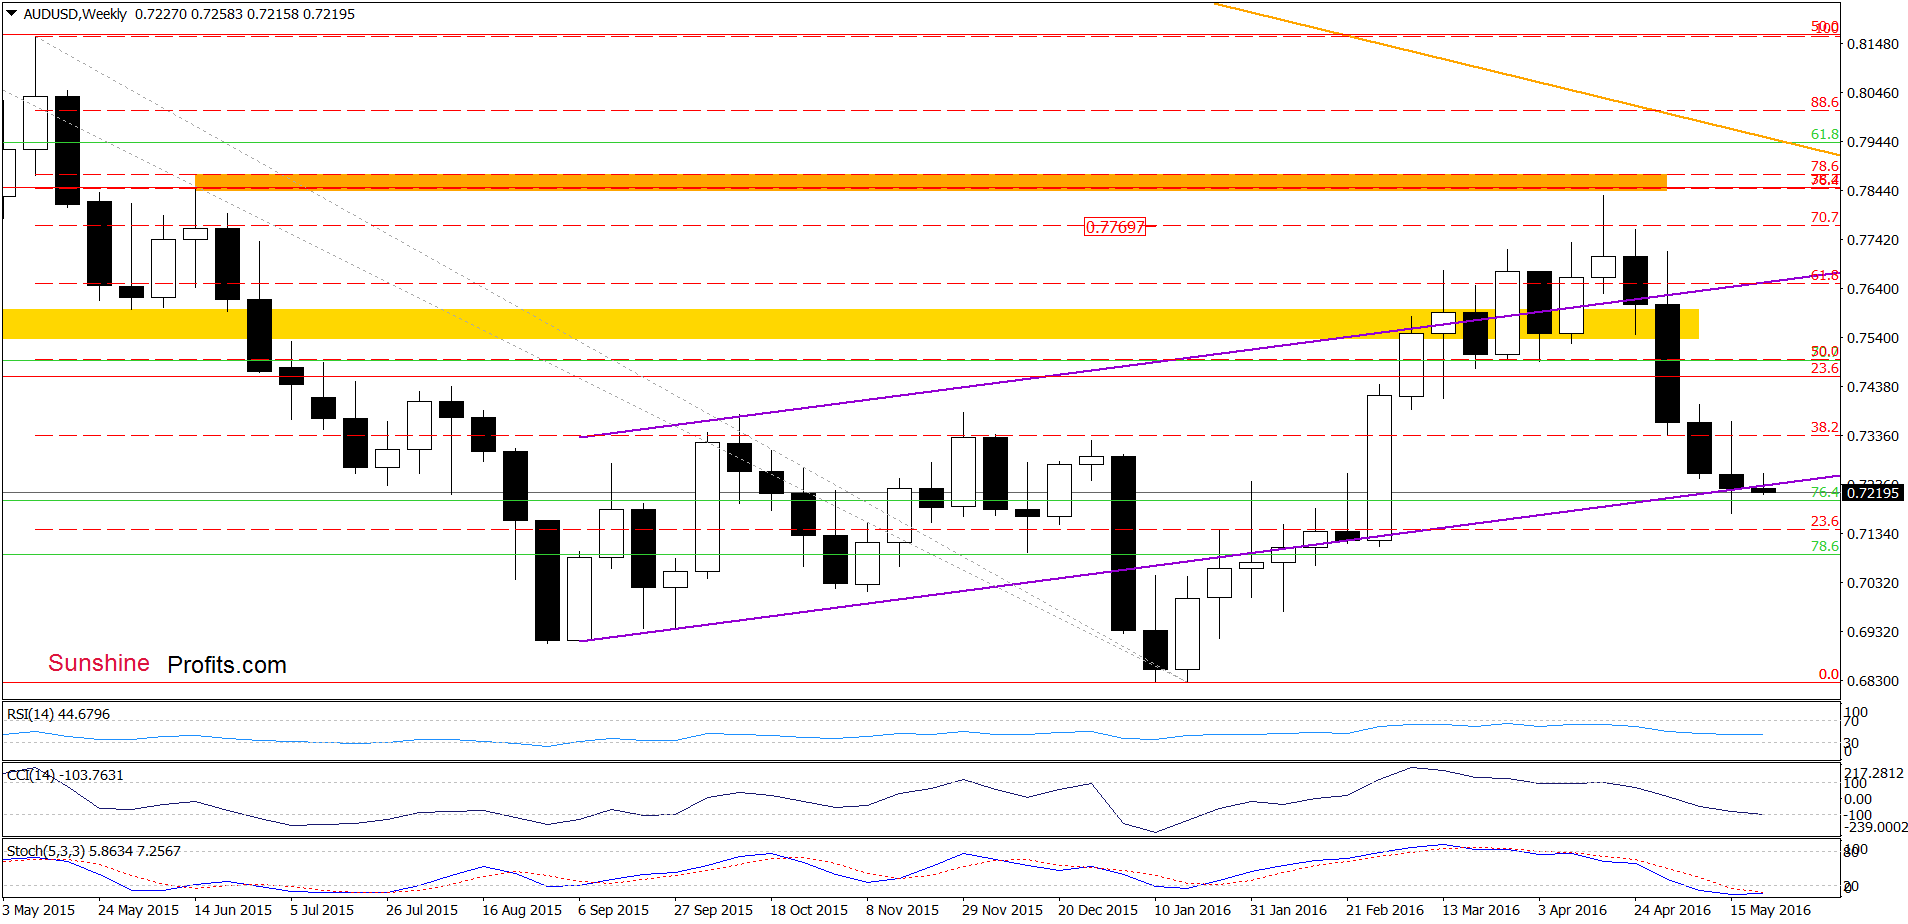
On the weekly chart, we see that AUD/USD extended losses and slipped under the lower border of the purple rising trend channel, which is a bearish signal that suggests further deterioration in the coming days. Nevertheless, the week just started and the breakdown is not confirmed. Additionally, the CCI and Stochastic Oscillator are oversold, which increases the probability of reversal in the coming days.
Will the very short-term picture give us more clues that support this scenario? Let’s check.
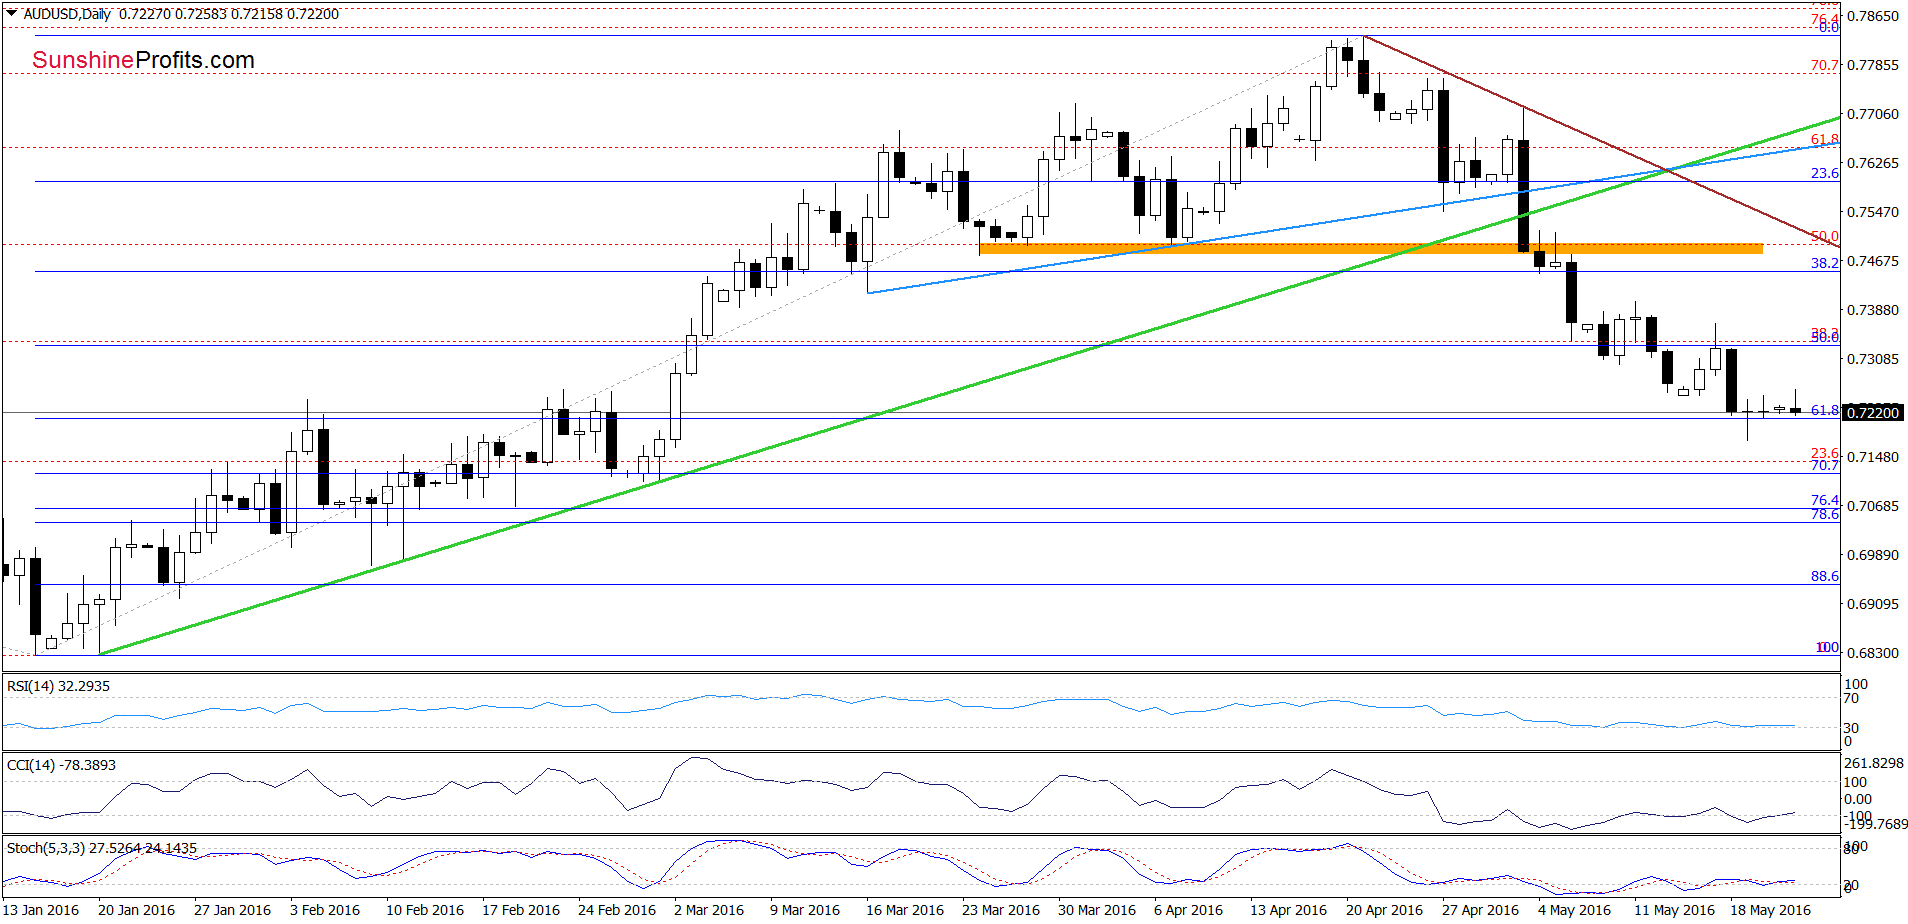
From this perspective, we see that the situation hasn’t changed much since Thursday as AUD/USD is consolidating around the 61.8% Fibonacci retracement based on the entire Jan-Apr upward move. Taking this fact into account and combining it with the current position of daily and weekly indicators, it seems that the space for declines is limited and reversal is just around the corner. Therefore, if the exchange rate reverses, the initial upside target would be around 0.7400 (the May 11 peak).
Very short-term outlook: mixed with bullish bias
Short-term outlook: mixed
MT outlook: mixed
LT outlook: mixed
Trading position (short-term; our opinion): No positions are justified from the risk/reward perspective. We will keep you informed should anything change, or should we see a confirmation/invalidation of the above.
Thank you.
Nadia Simmons
Forex & Oil Trading Strategist
Przemyslaw Radomski, CFA
Founder, Editor-in-chief
Gold & Silver Trading Alerts
Forex Trading Alerts
Oil Investment Updates
Oil Trading Alerts

