

Earlier today, the Federal Reserve of New York showed that its Empire State manufacturing activity index declined to -9.02 in May, missing analysts’ forecasts and disappointing market participants. As a result, the USD Index gave up some gains and slipped below 94.50. What impact did this drop have on our six currency pairs?
In our opinion the following forex trading positions are justified - summary:
- EUR/USD: short (stop-loss order at 1.1754; initial downside target at 1.1222)
- GBP/USD: short (stop-loss order at 1.4819; initial downside target at 1.4303)
- USD/JPY: none
- USD/CAD: long (stop-loss order at 1.2182; initial upside target at 1.3000)
- USD/CHF: none
- AUD/USD: none
EUR/USD
On Friday, we wrote the following:
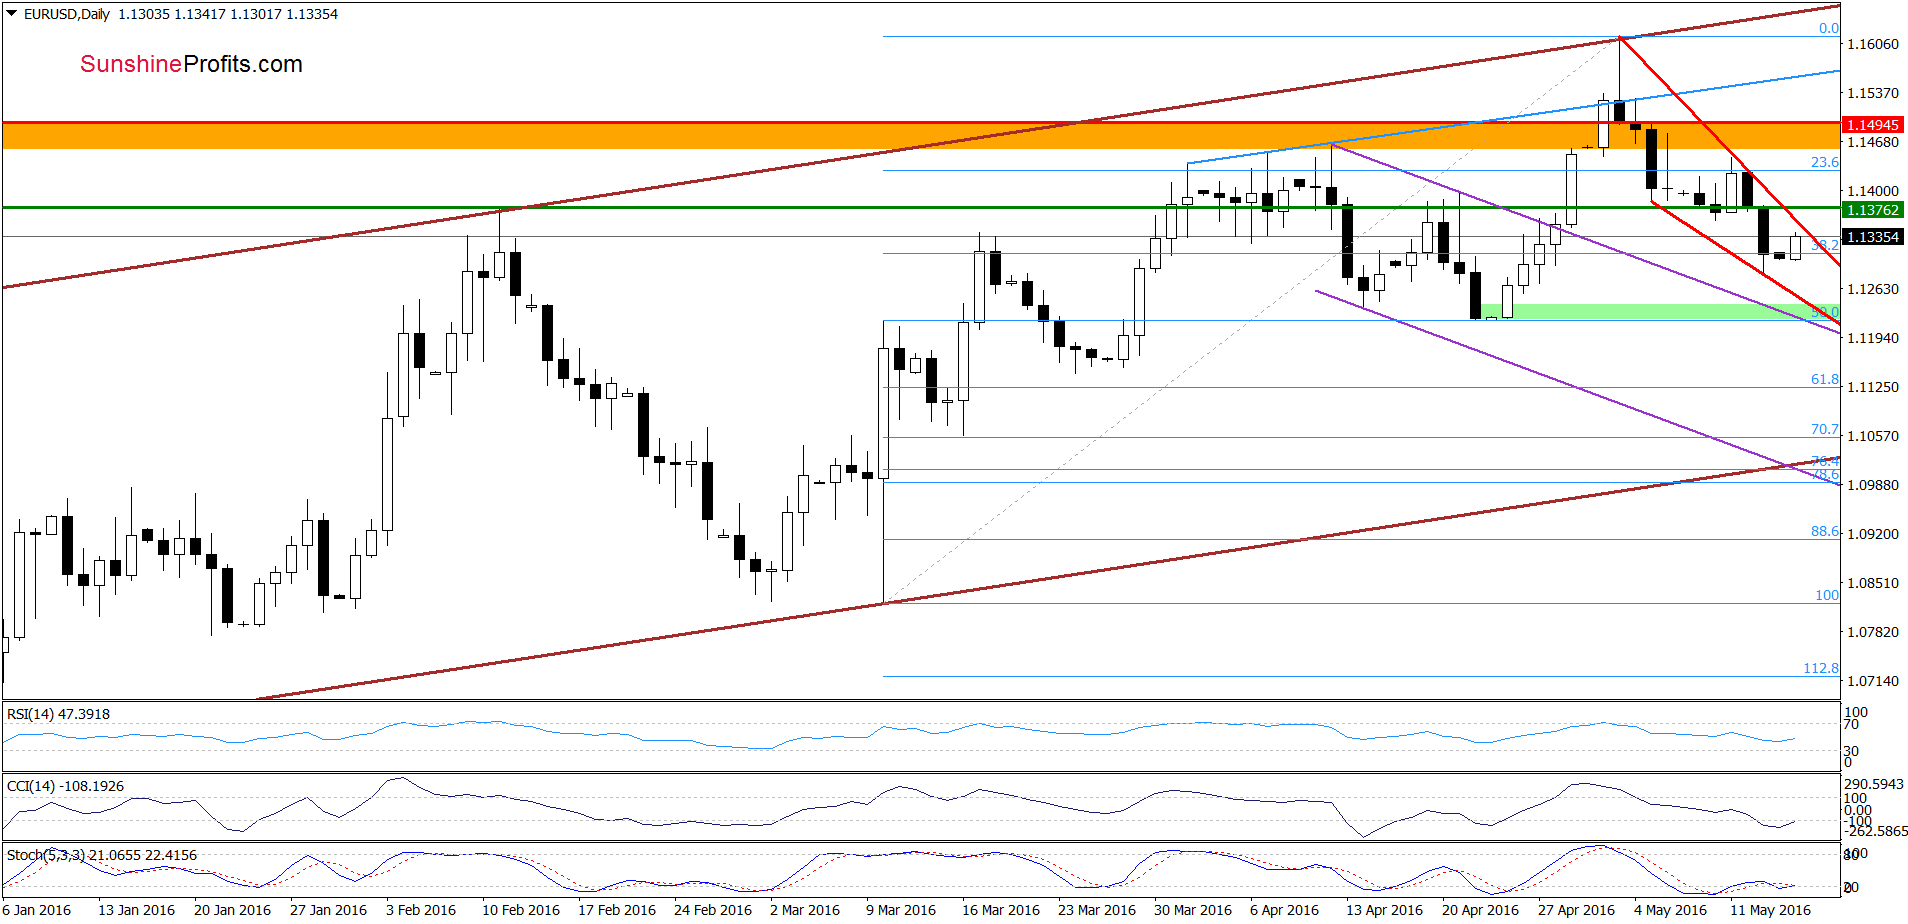
(…) EUR/USD slipped under the green horizontal support line based on the Feb high earlier today. This means that (…) If (…) the exchange rate extends declines, the next downside target would be the 32.8% Fibonacci retracement (based on the March-May rally) around 1.1313.
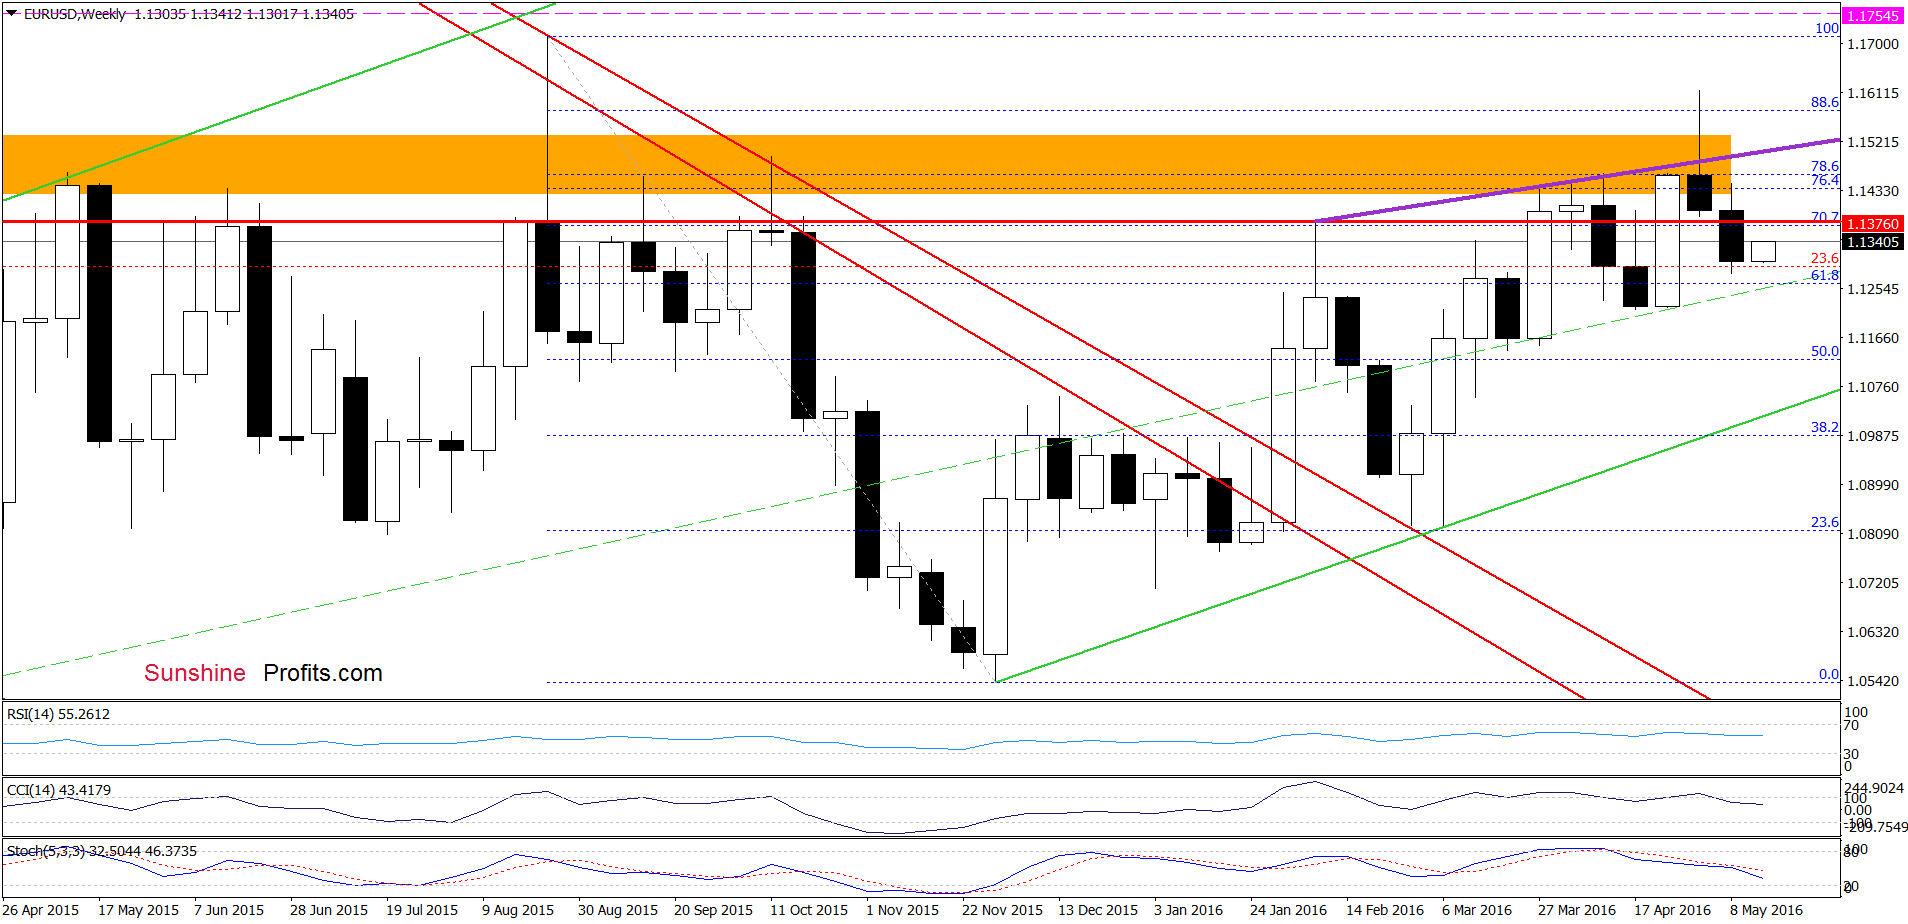
Looking at the daily chart, we see that the situation developed in line with the above scenario and EUR/USD reached our next downside target on Friday. Earlier today, the above-mentioned Fibonacci retracement encouraged currency bulls to act, which triggered a rebound. Despite this move, the exchange rate is still trading under the Feb, Apr and May highs and well below the blue and purple resistance lines, while sell signals generated by the weekly indicators are still in play. Additionally, the pair remains in the red declining wedge, which suggests that as long as there won’t be breakout above the upper red resistance line another attempt to move lower is very likely. If this is the case, and EUR/USD extends declines, we’ll likely see a test of the green support zone created by the previously-broken upper border of the purple declining trend channel, the 50% Fibonacci retracement and the bottom of the previous correction (around 1.1217-1.1241) in the coming week.
Very short-term outlook: bearish
Short-term outlook: bearish
MT outlook: mixed with bearish bias
LT outlook: mixed
Trading position (short-term; our opinion): Short positions (with a stop-loss order at 1.1754 and the initial downside target at 1.1222) are justified from the risk/reward perspective. We will keep you informed should anything change, or should we see a confirmation/invalidation of the above.
GBP/USD
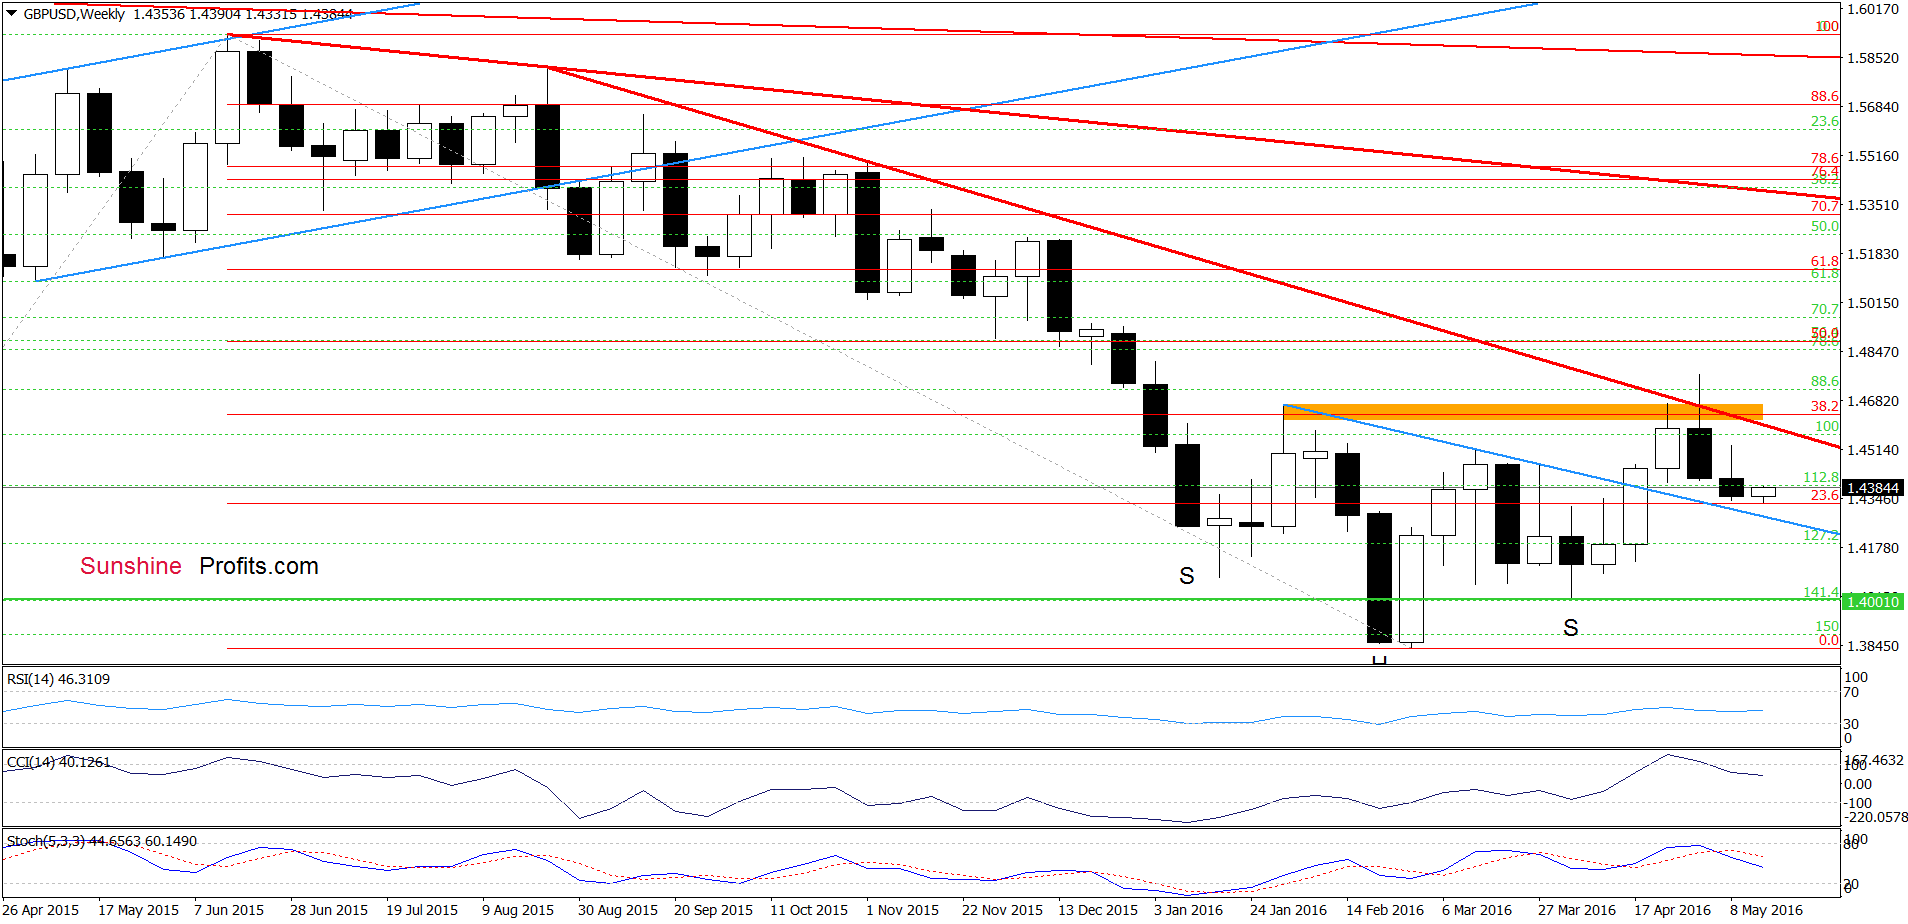
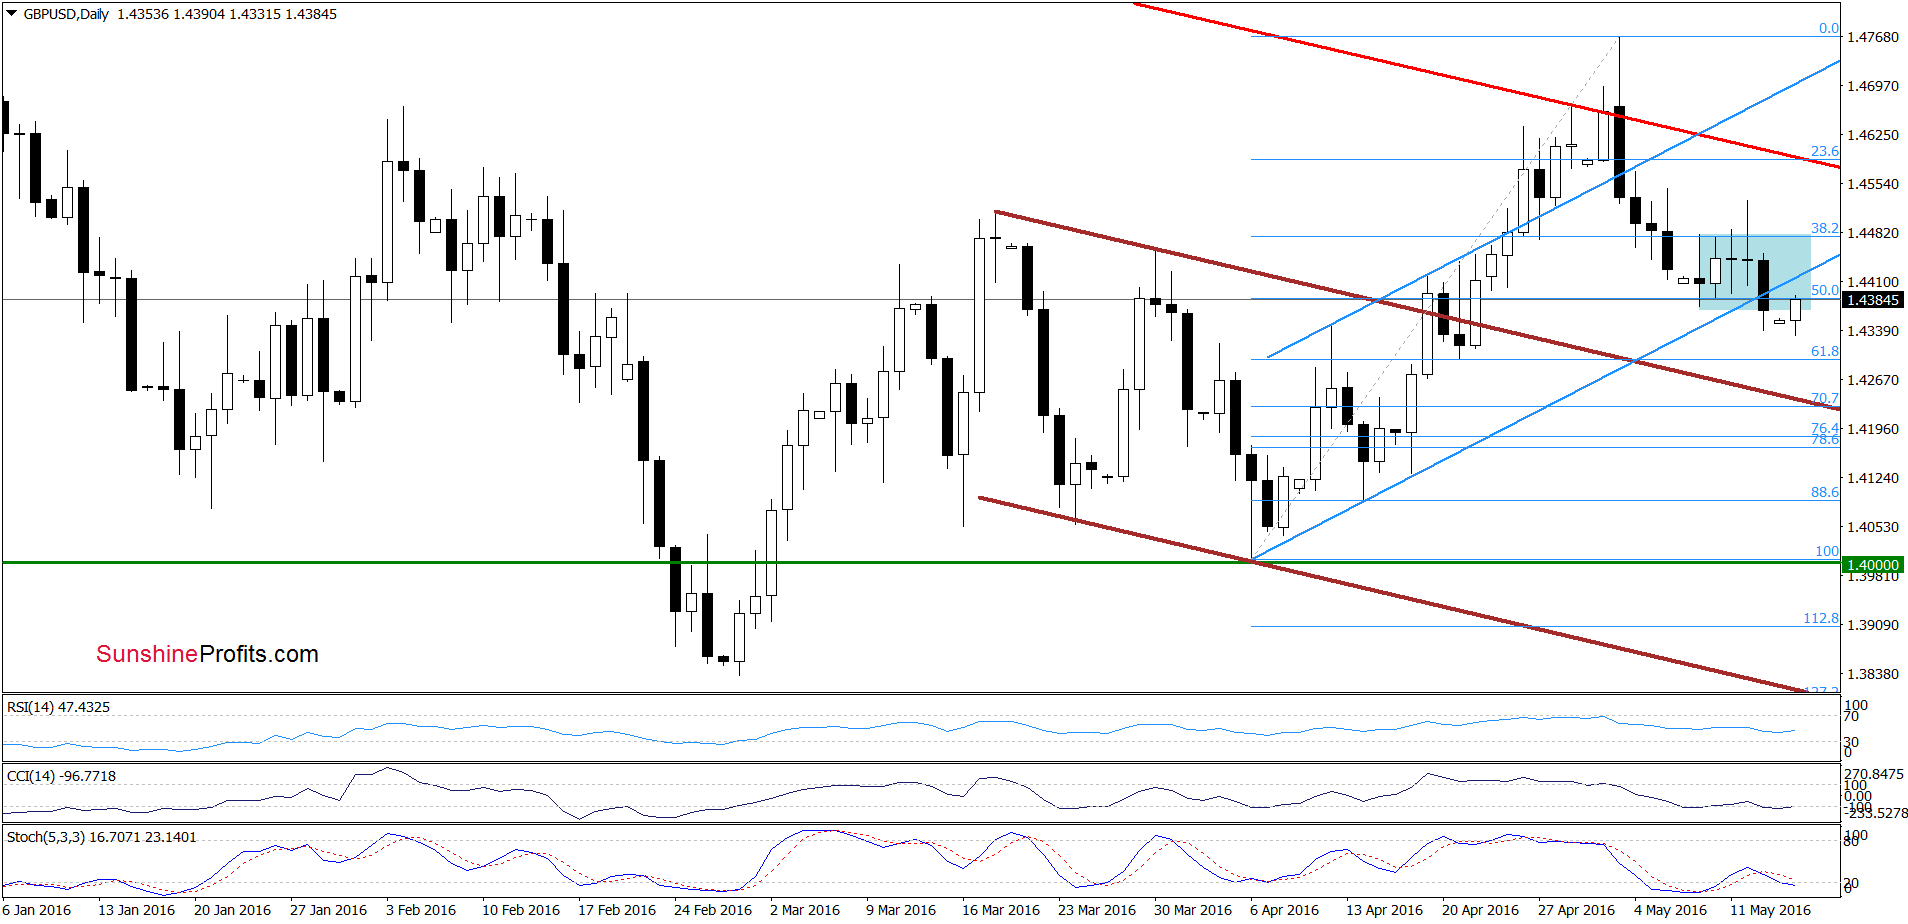
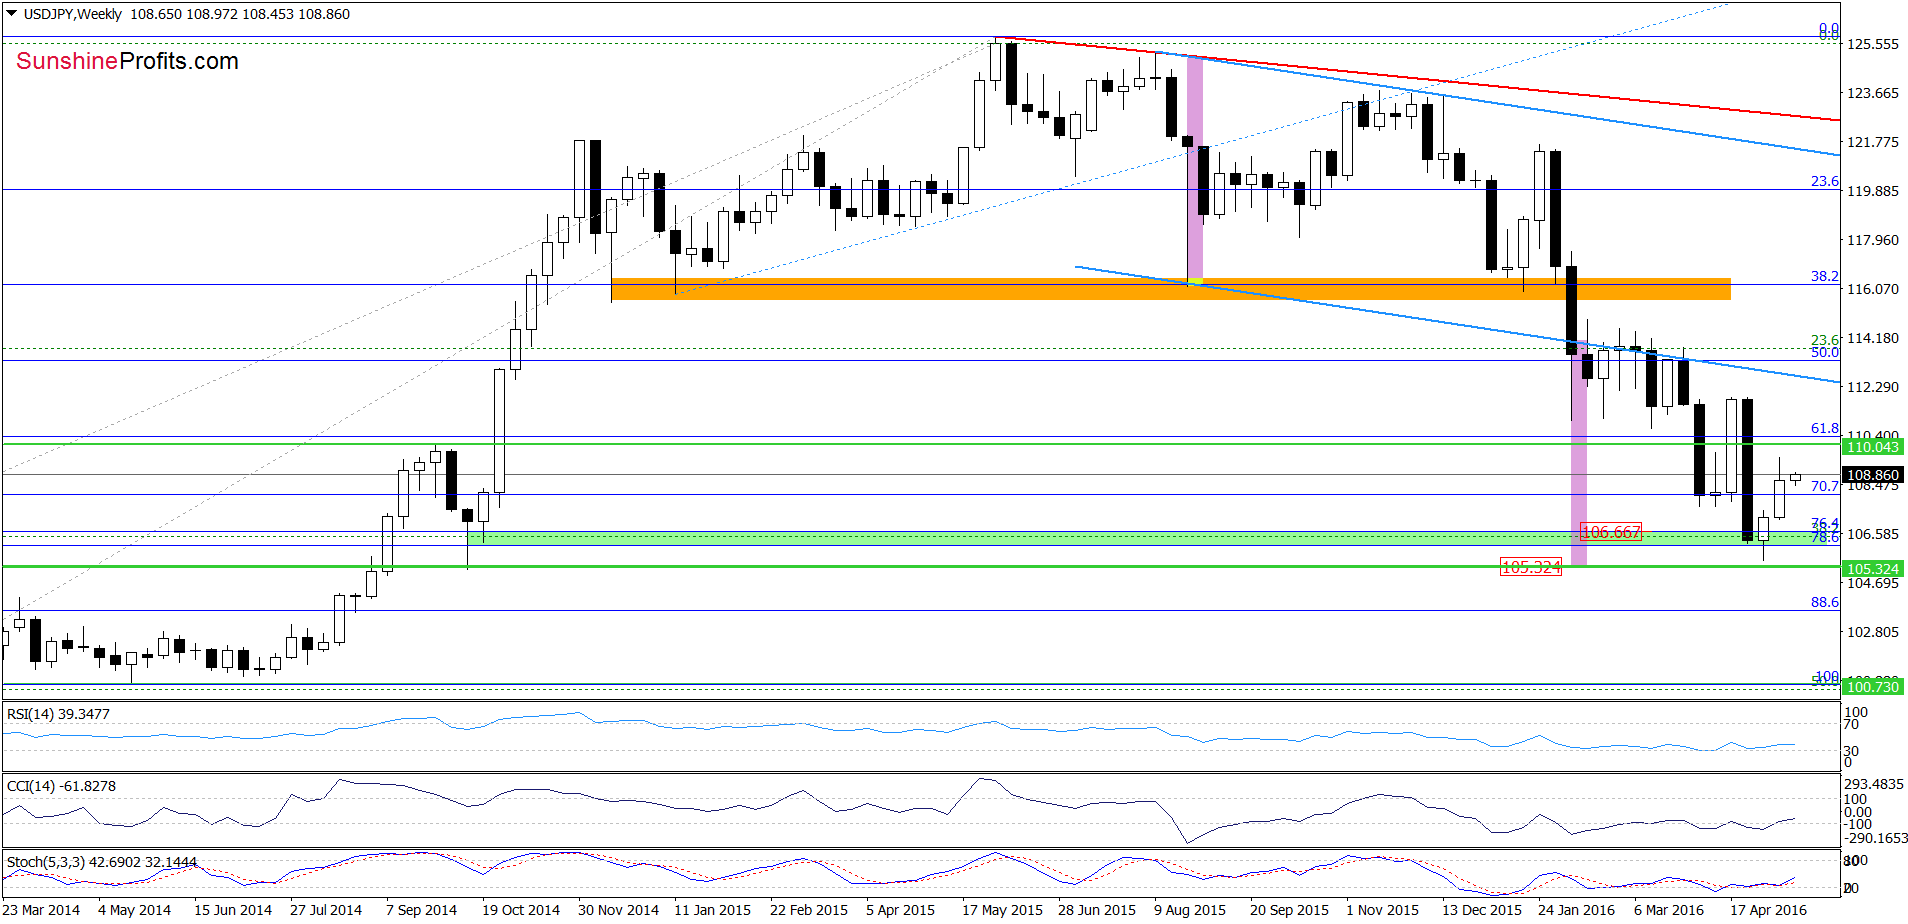
As you see on the daily chart, GBP/USD declined and broke below the lower border of the blue consolidation on Friday. With this downswing the pair also slipped under the 50% Fibonacci retracement and the short-term blue support line based on the previous lows. Earlier today, currency bulls managed to push the exchange rate higher, but GBP/USD remains under the blue line, which suggests that today’s upswing could be just a verification of Friday’s breakdown under this support. If this is the case, the pair will reverse and decline in the coming days. if we see such price action, GBP/USD will likely test the previously-broken neck line of reverse head and shoulders formation (marked on the weekly chart) and the 61.8% Fibonacci retracement in the coming week.
Very short-term outlook: bearish
Short-term outlook: mixed with bearish bias
MT outlook: mixed with bearish bias
LT outlook: mixed
Trading position (short-term; our opinion): Short positions (with a stop-loss order at 1.48.19 and the initial downside target at 1.4303) are justified from the risk/reward perspective at the moment. We will keep you informed should anything change, or should we see a confirmation/invalidation of the above.
USD/JPY
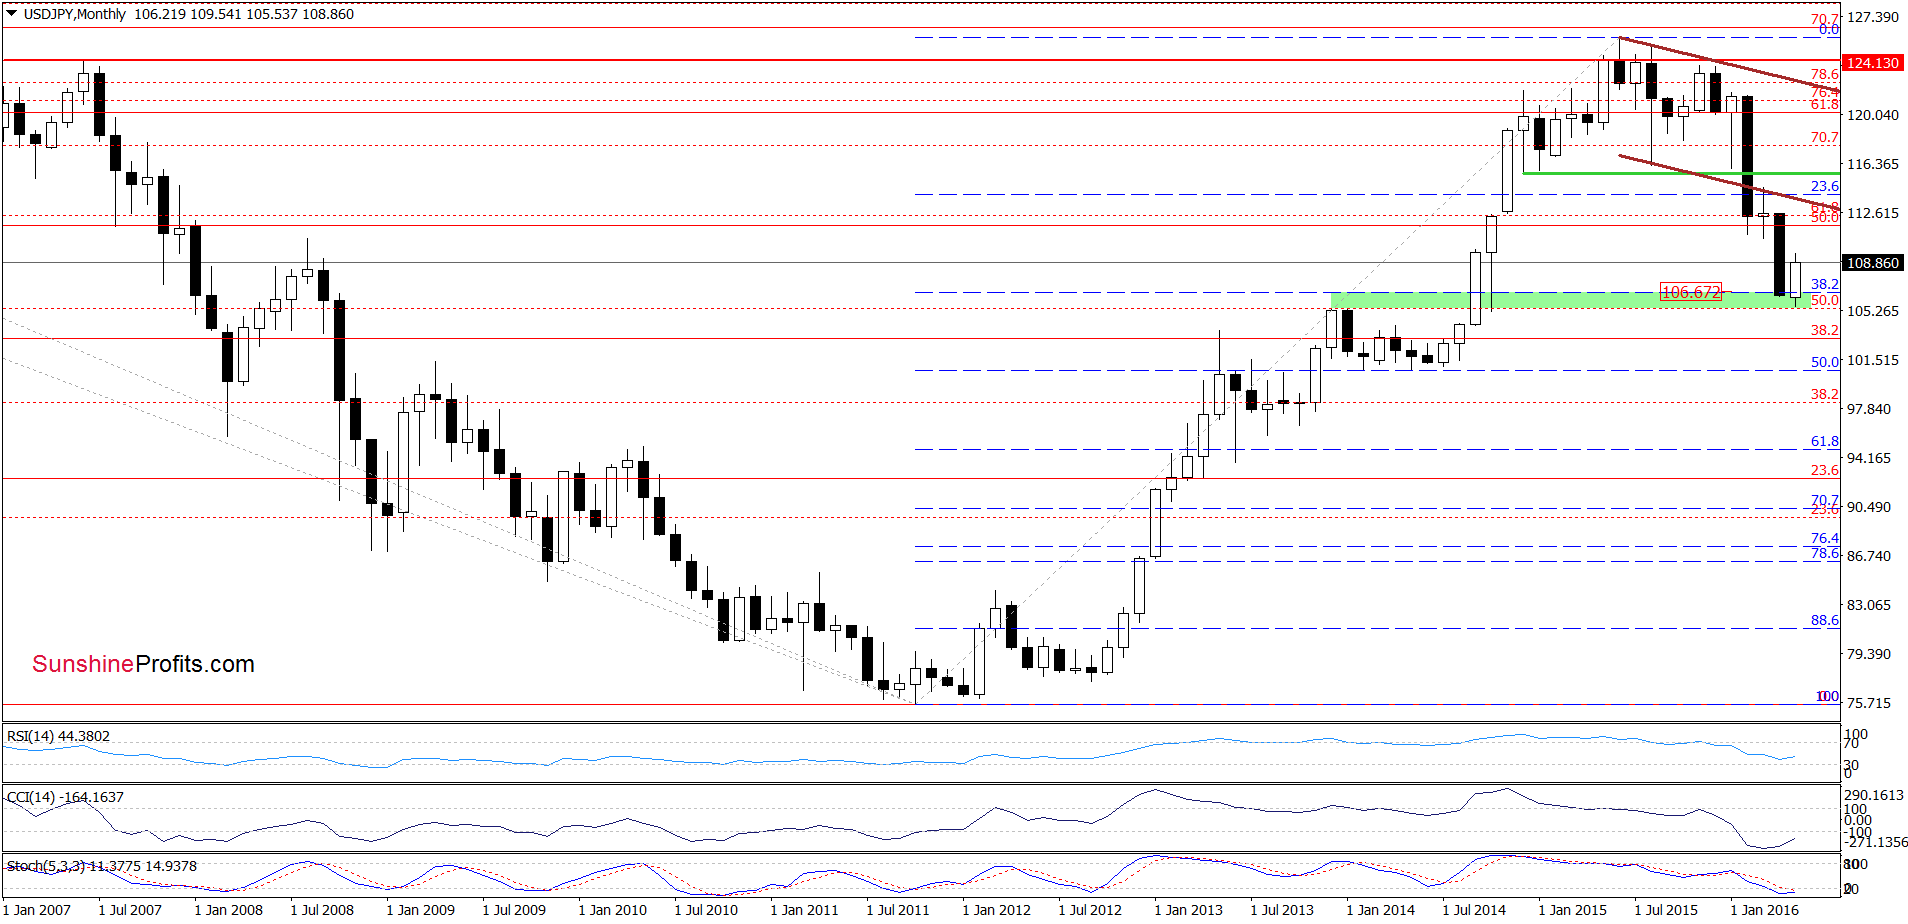
From today’s point of view, we see that the overall situation in the long- and medium-term perspective hasn’t changed much as USD/JPY is still trading above the 38.2% Fibonacci retracement (based on the entire Jun-May downward move) and the green zone created by the Fibonacci retracements (based on the Feb 2014-Jun 2015 rally). Today, we’ll focus on the very short-term changes.
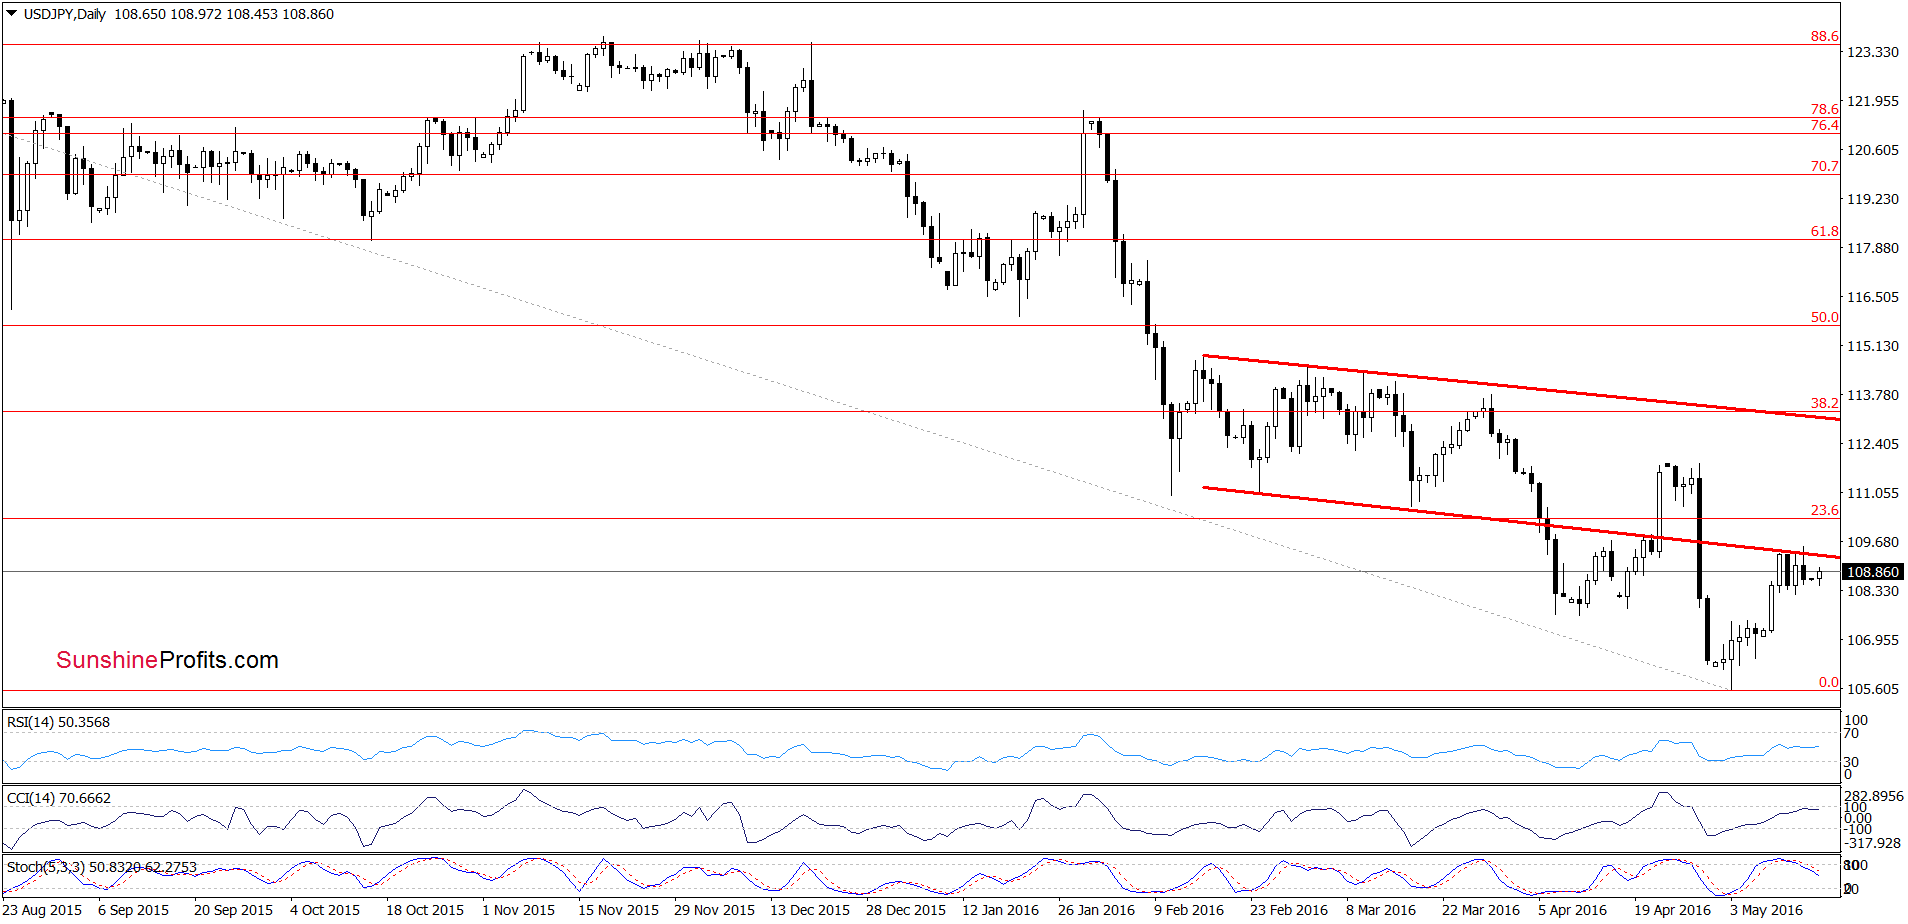
On the daily chart, we see that USD/JPY is still consolidating under the lower red resistance line, which in combination with a sell signal generated by the Stochastic Oscillator suggests that currency bears will try to push the pair lower in the coming week. If this is the case and the pair moves lower from current levels, the initial downside target would be around 108.01, where the 38.2% Fibonacci retracement (based on the recent upward move) is.
Very short-term outlook: mixed
Short-term outlook: mixed with bullish bias
MT outlook: mixed
LT outlook: mixed
Trading position (short-term; our opinion): No positions are justified from the risk/reward perspective at the moment. We will keep you informed should anything change, or should we see a confirmation/invalidation of the above.
USD/CAD
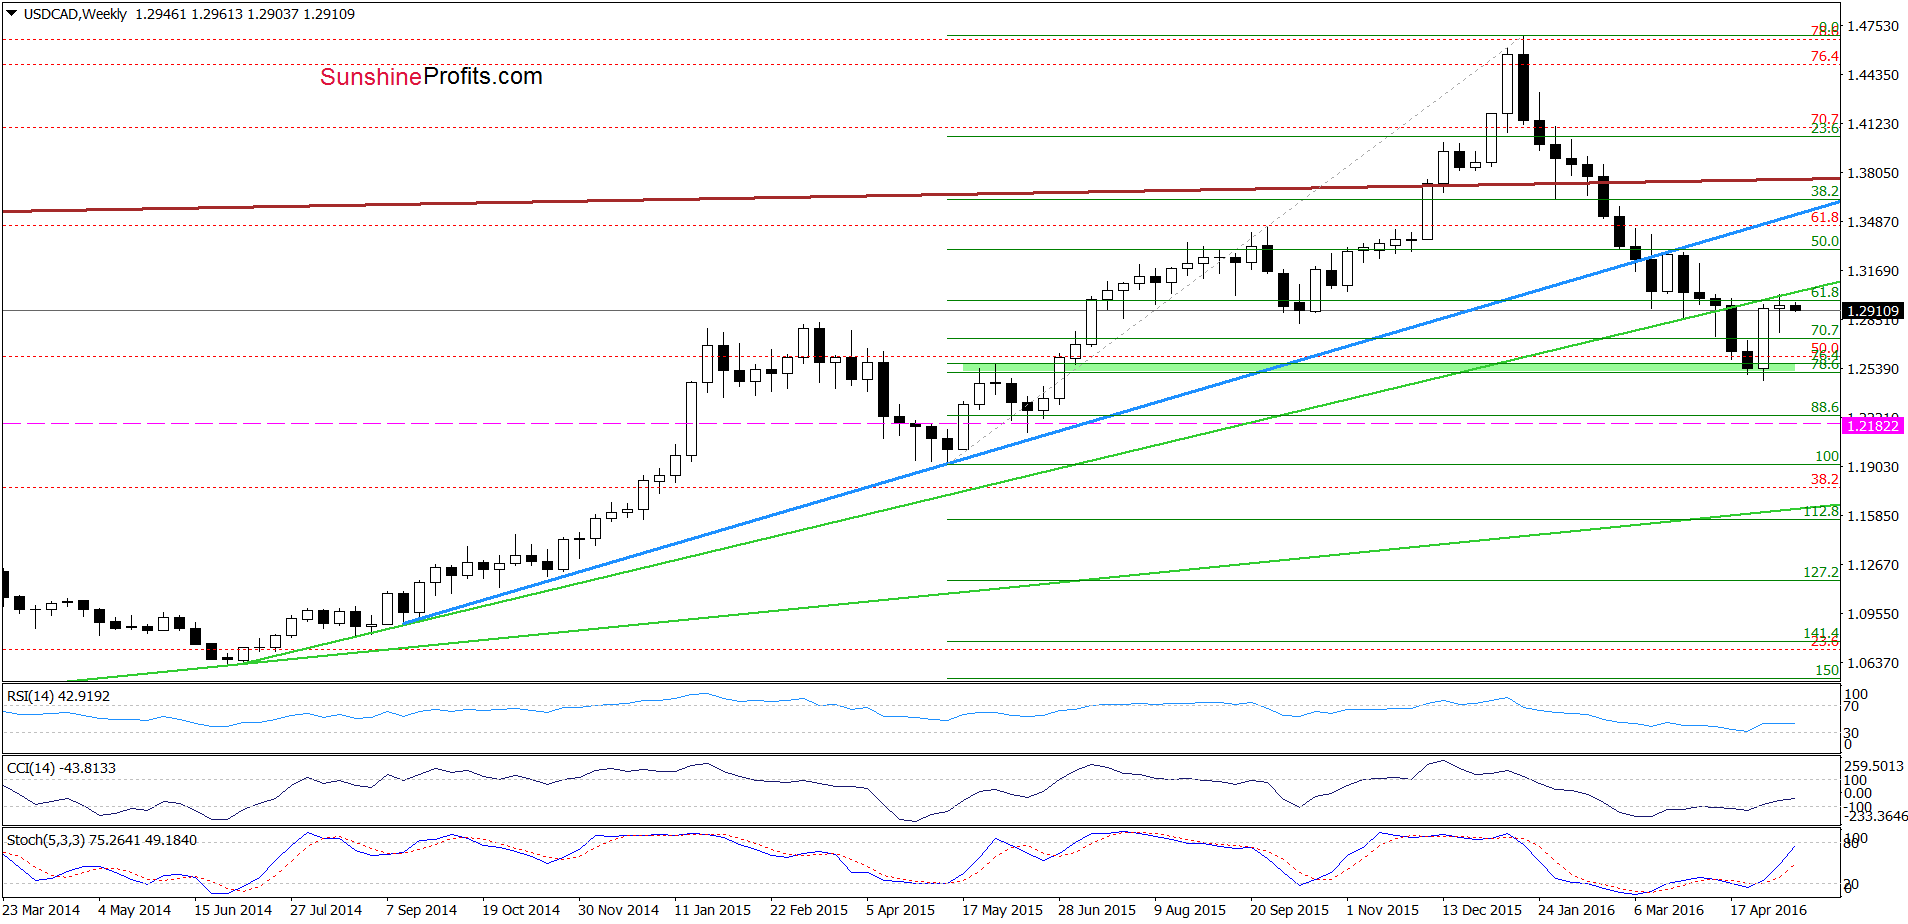
Looking at the medium-term chart, we see that the previously-broken green support/resistance line continues to keep gains in check. Nevertheless, the current position f the indicators suggests that further improvement is just around the corner. Will the very short-term picture confirm this pro-growth scenario? Let’s check.
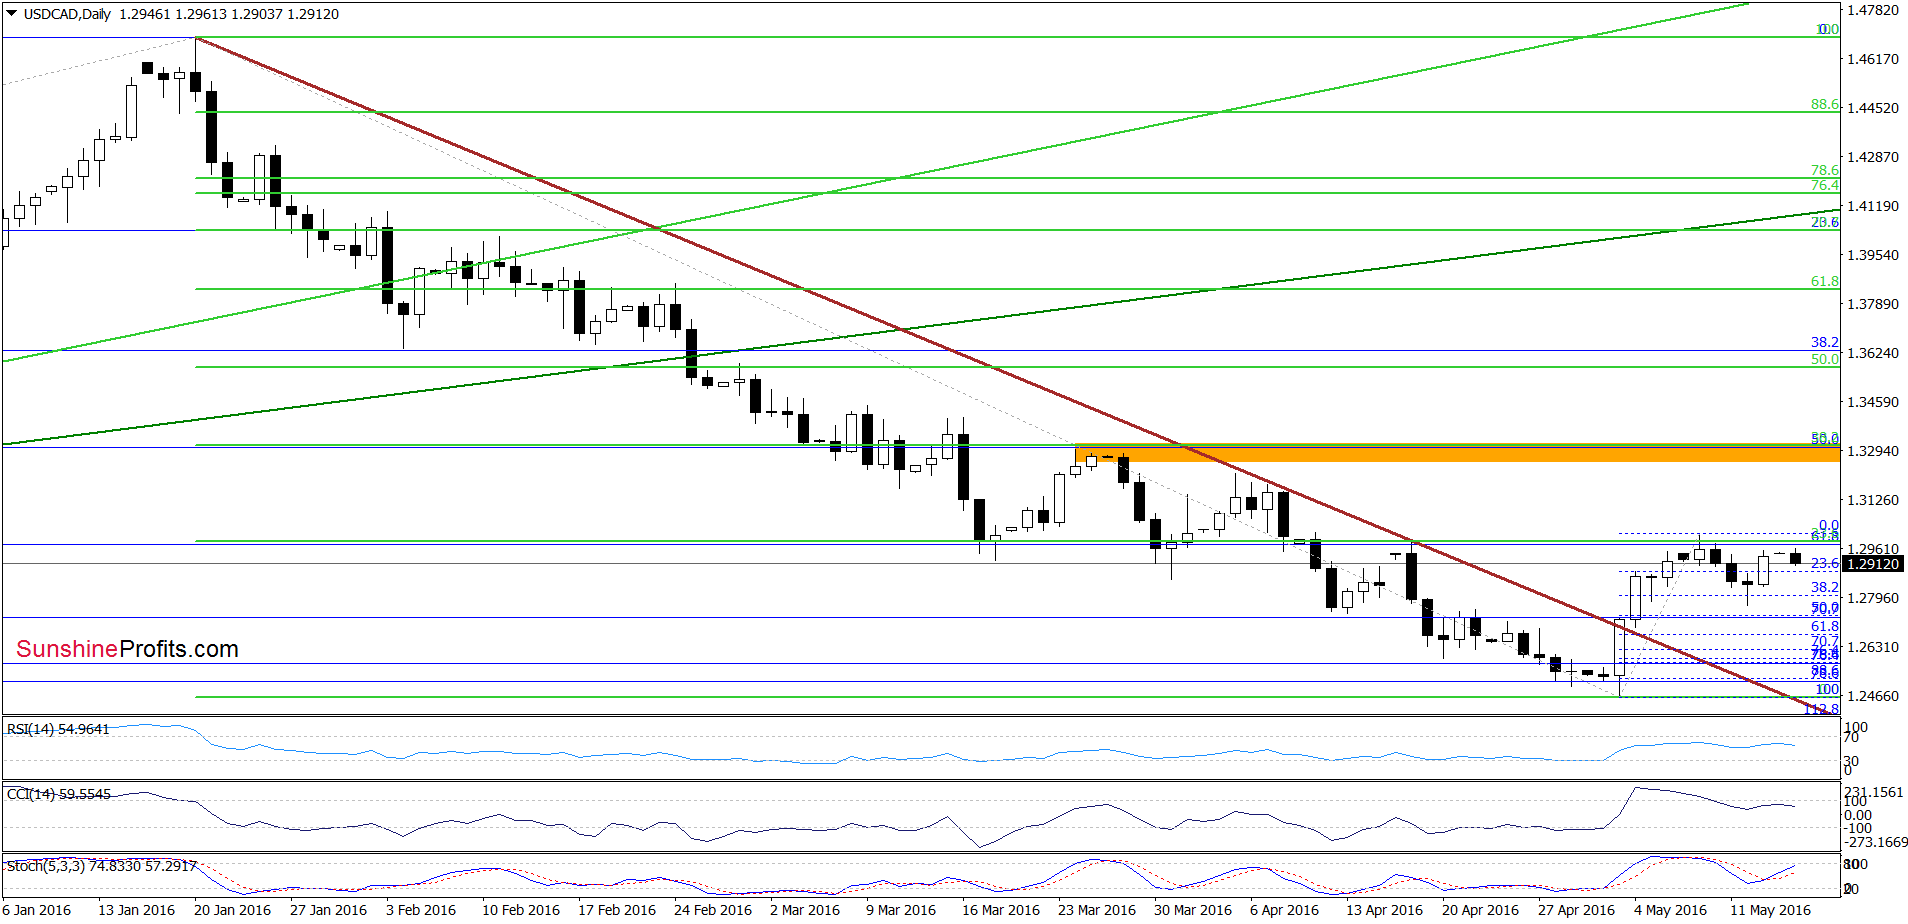
Looking at the daily chart, we see that the 38.2% Fibonacci retracement based on the May’s upward move triggered a rebound on Friday. With this move USD/CAD re-approached the 23.6% Fibonacci retracement (based on the entire Jan-May decline), the barrier of 1.3000 and the previous high, which could encourage currency bears to act once again. Nevertheless, shallow pullback and buy signal generated by the Stochastic Oscillator suggest that another attempt to move higher is just around the corner. However, further rally will be more reliable if we see a breakout above these resistance levels.
Very short-term outlook: bullish
Short-term outlook: mixed with bullish bias
MT outlook: mixed
LT outlook: mixed
Trading position (short-term; our opinion): Long positions (with a stop-loss order at 1.2182 and the next upside target at 1.3155) are justified from the risk/reward perspective. We will keep you informed should anything change, or should we see a confirmation/invalidation of the above.
USD/CHF
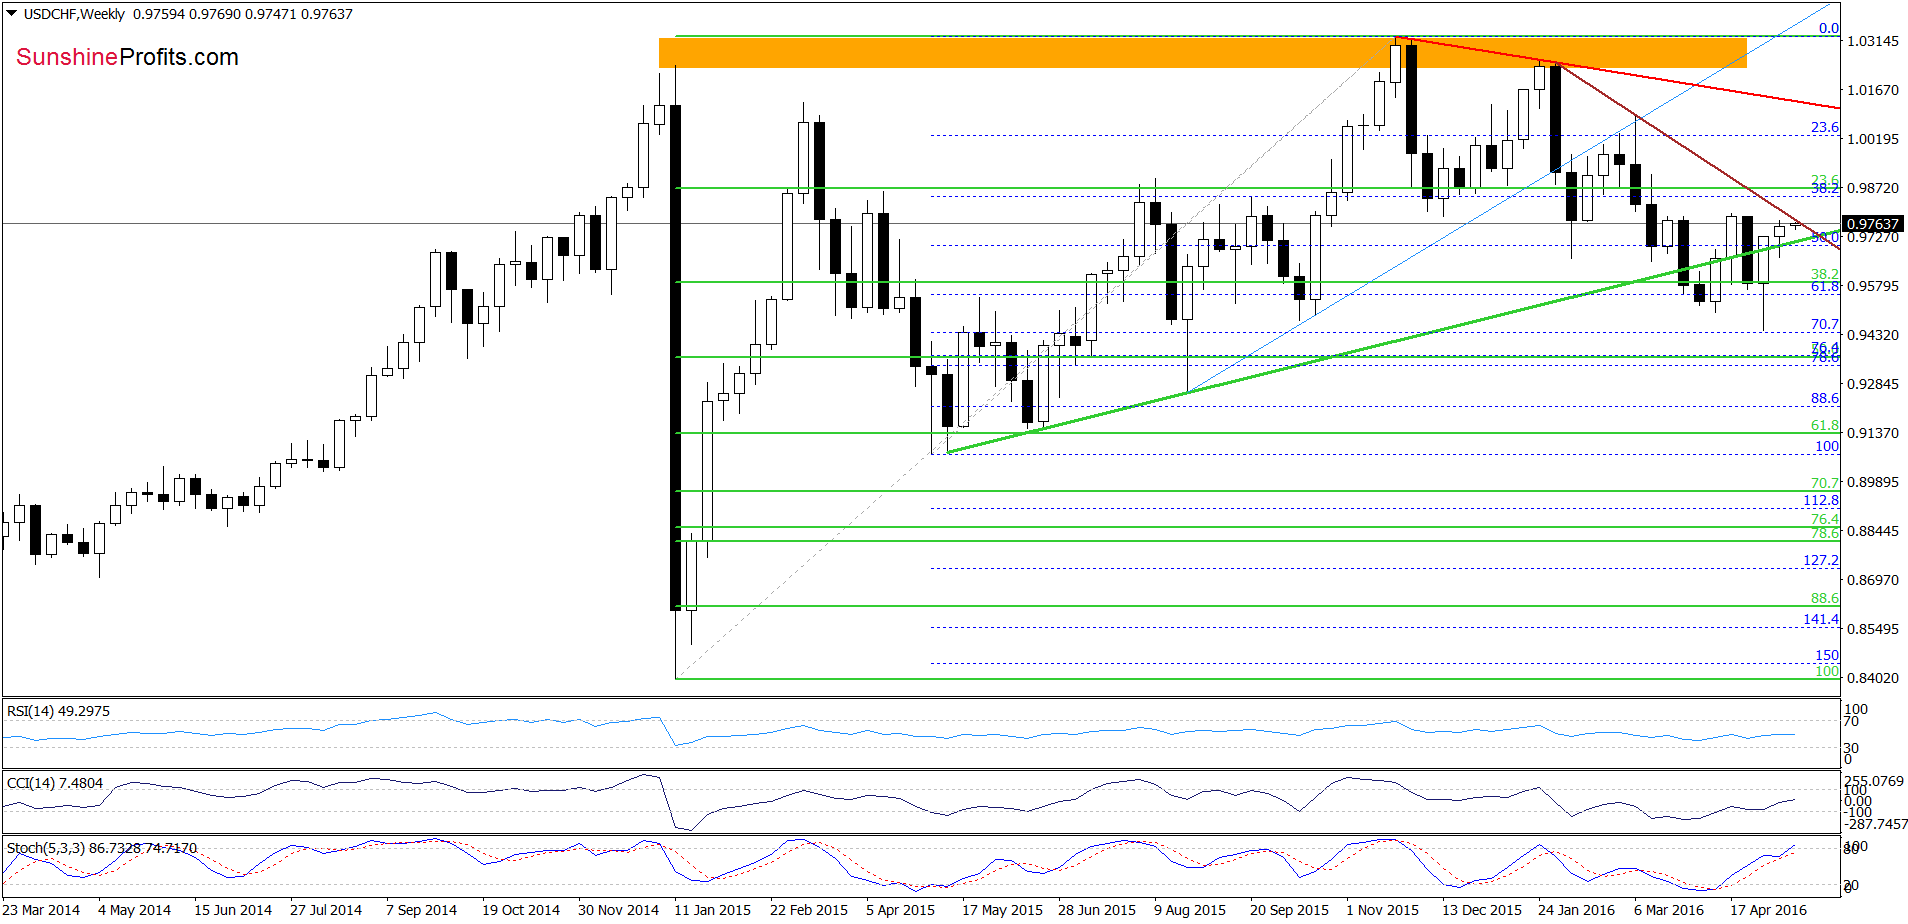
On the weekly chart, we see that USD/CHF extended gains and closed the previous week above the previously-broken green support/resistance line, invalidating earlier breakdown. Although this is a positive signal that suggests further improvement, the pair remains under the brown resistance line based on the previous highs, which could encourage currency bears to act in the coming days.
Are there any other factors that can support this scenario? Let’s examine the daily chart and find out.
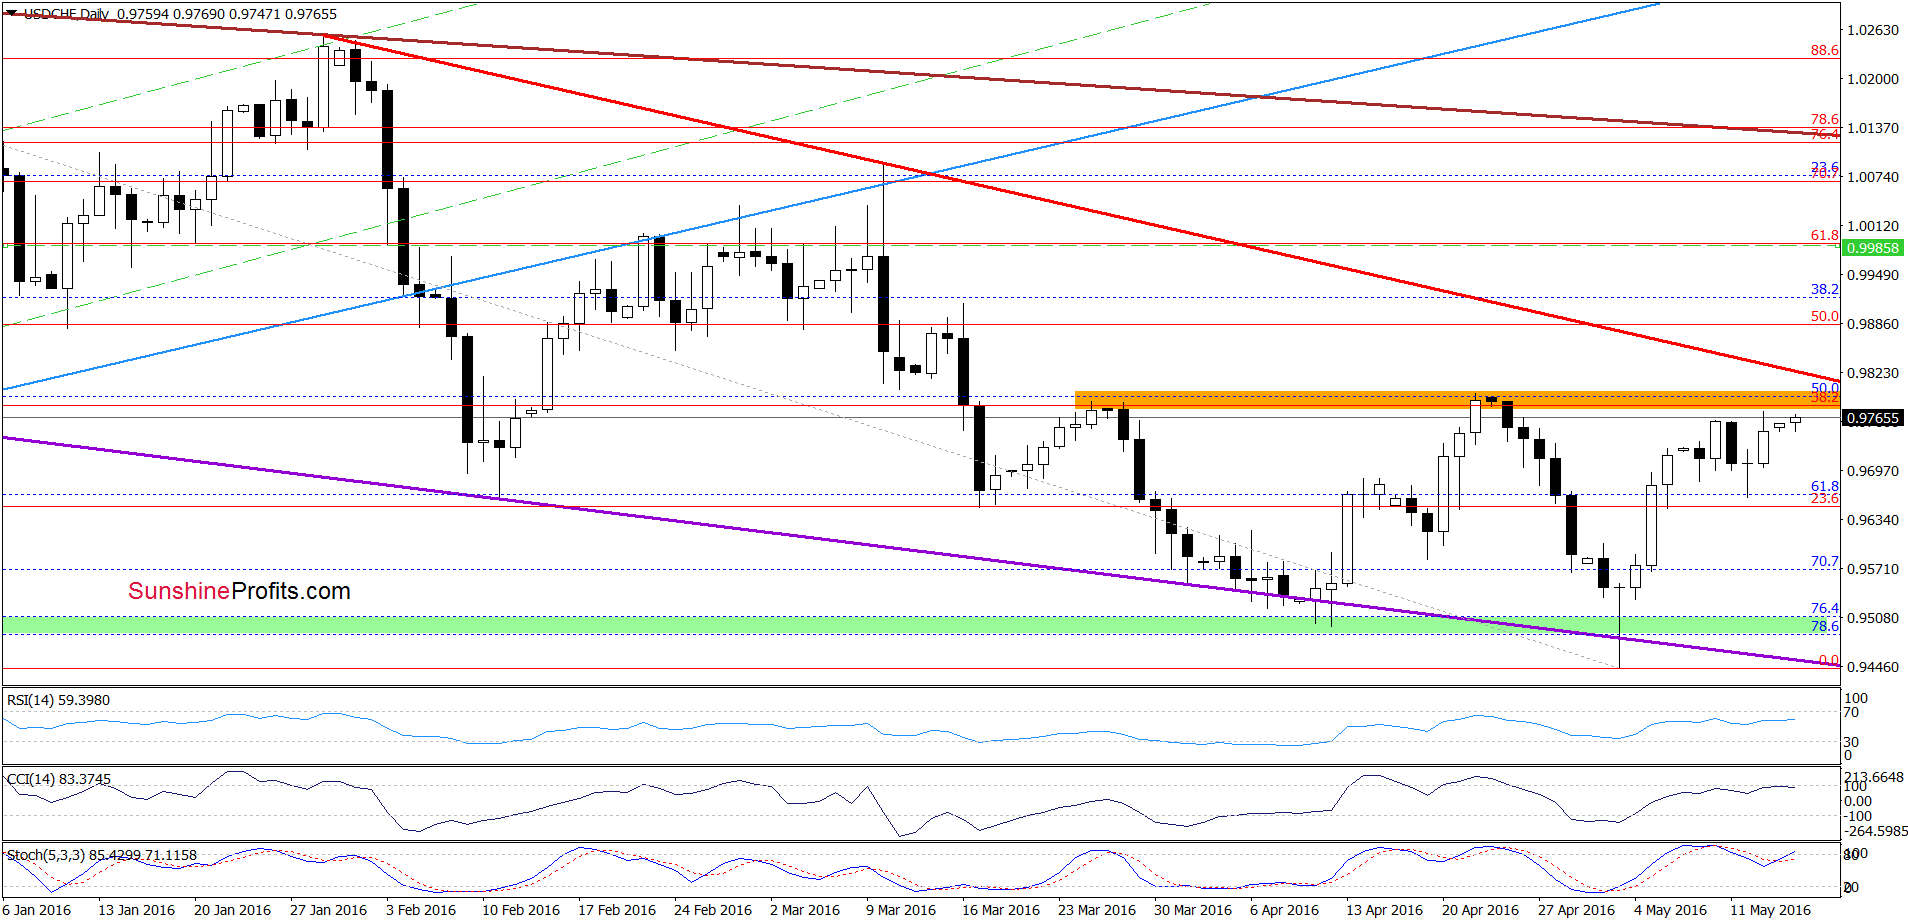
From this perspective, we see that although USD/CHF moved little higher, the pair approached orange resistance zone created by the previous highs, the 38.2% Fibonacci retracement (based on the entire Nov-May downward move) and the red declining resistance line based on previous highs, which can stop further improvement and trigger another pullback in the coming days. If this is the case, and the pair moves lower, the initial downside target would be around 0.966, where the last week’s low is.
Very short-term outlook: mixed with bearish bias
Short-term outlook: mixed
MT outlook: mixed
LT outlook: mixed
Trading position (short-term; our opinion): No positions are justified from the risk/reward perspective. We will keep you informed should anything change, or should we see a confirmation/invalidation of the above.
AUD/USD
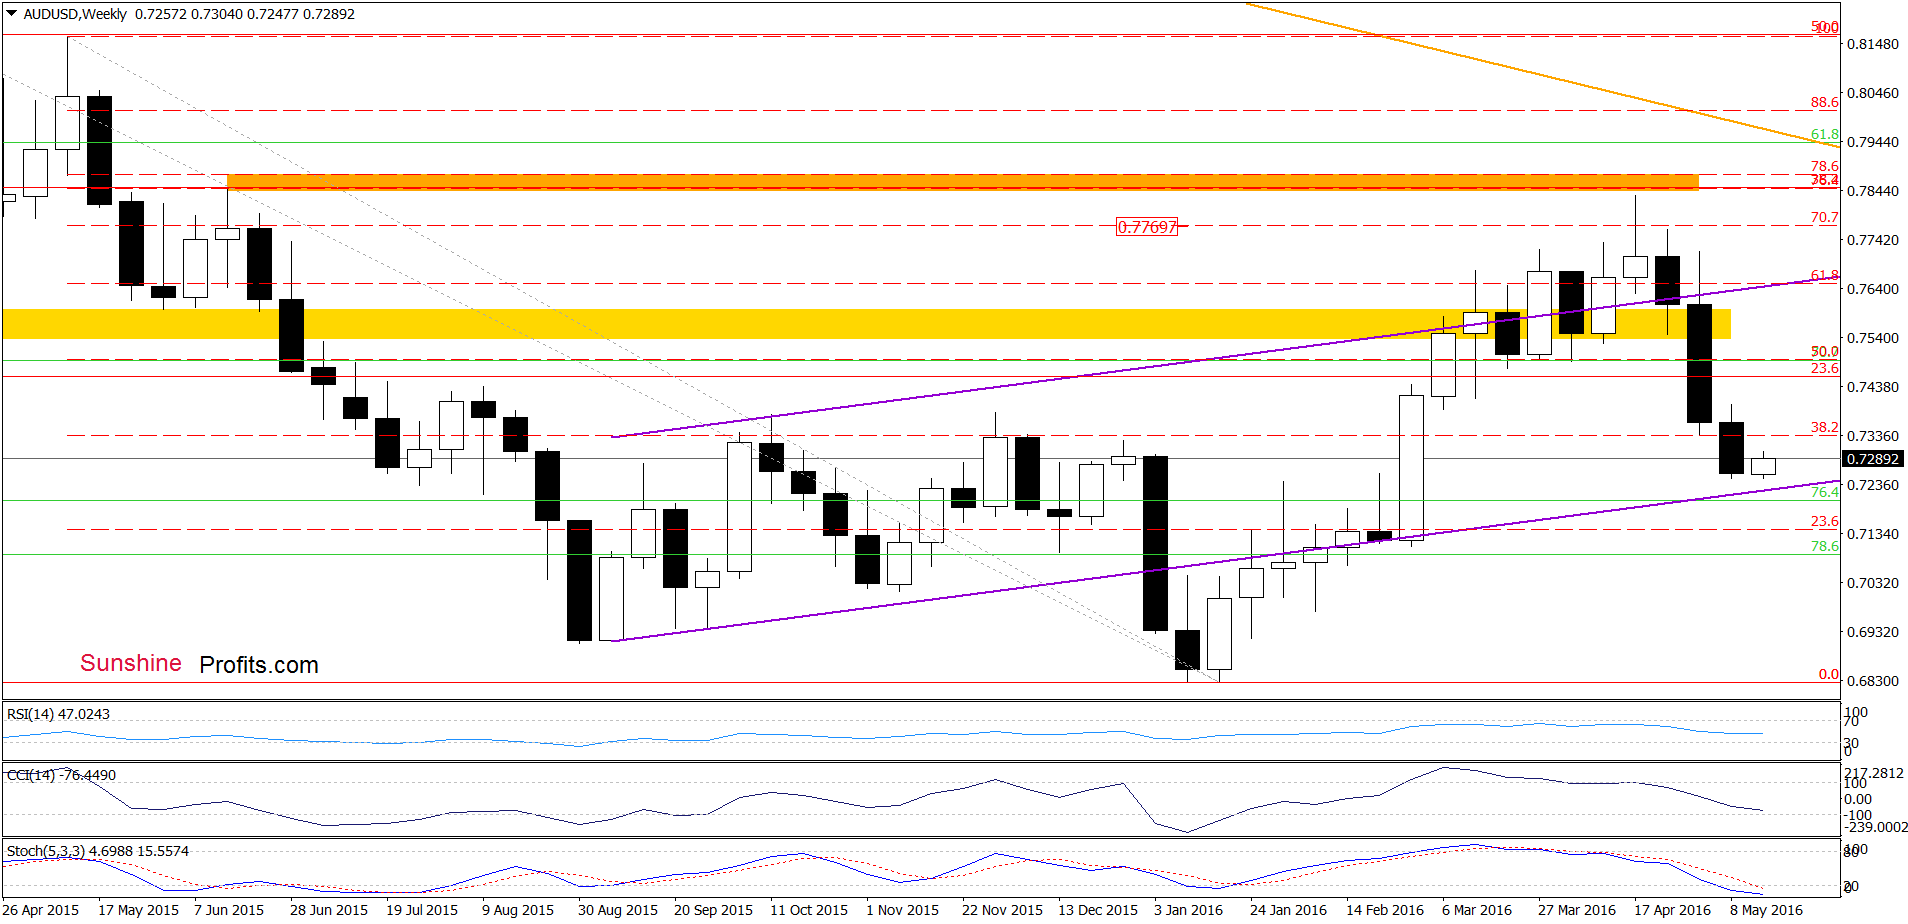
On the weekly chart, we see that AUD/USD extended losses and approached the lower border of the purple rising trend channel. As you see, the proximity o this support encouraged currency bulls to act, which triggered a rebound earlier today. How did this move affect the very short-term picture? Let’s check.
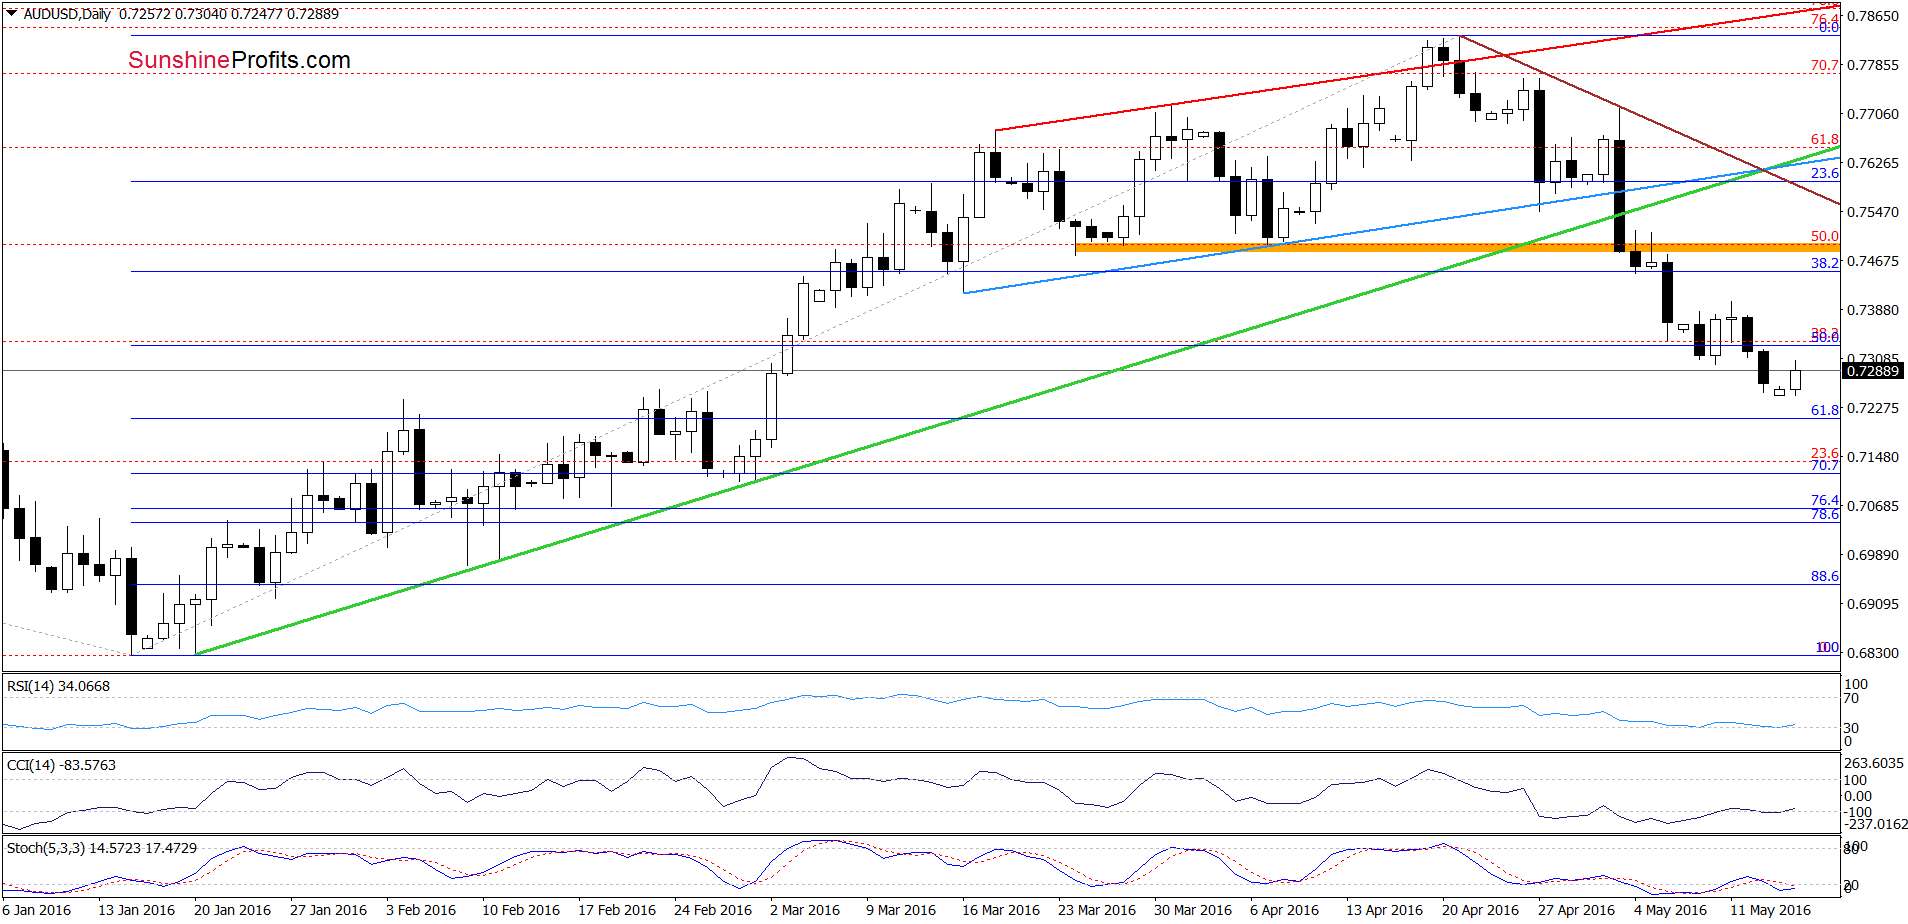
On the daily chart, we see that although AUD/USD slipped under the 50% Fibonacci retracement, currency bulls didn’t give up and managed to trigger a rebound earlier today. Additionally, all indicators generated buy signals, which in combination with the medium-term picture suggest further improvement in the coming days. If we see such price action, the initial upside target would be around 0.7475-0.7490, where the orange resistance zone (created by the March and Apr lows) is.
Very short-term outlook: mixed with bullish bias
Short-term outlook: mixed
MT outlook: mixed
LT outlook: mixed
Trading position (short-term; our opinion): No positions are justified from the risk/reward perspective. We will keep you informed should anything change, or should we see a confirmation/invalidation of the above.
Thank you.
Nadia Simmons
Forex & Oil Trading Strategist
Przemyslaw Radomski, CFA
Founder, Editor-in-chief
Gold & Silver Trading Alerts
Forex Trading Alerts
Oil Investment Updates
Oil Trading Alerts

