

Earlier today, the U.S. Commerce Department showed that retail sales rose by 1.3% in the previous month, beating analysts’ expectations. Additionally, core retail sales (without automobile sales) moved higher by 0.8% also beating forecasts. On top of that U.S. producer price inflation and core PPI increased more-than-expected, which supported the greenback. As a result, USD/CAD reversed and rebounded. Will we see further rally in the coming week?
In our opinion the following forex trading positions are justified - summary:
- EUR/USD: short (stop-loss order at 1.1754; initial downside target at 1.1222)
- GBP/USD: short (stop-loss order at 1.4819; initial downside target at 1.4303)
- USD/JPY: none
- USD/CAD: long (stop-loss order at 1.2182; initial upside target at 1.3000)
- USD/CHF: none
- AUD/USD: none
EUR/USD
Yesterday, we wrote the following:
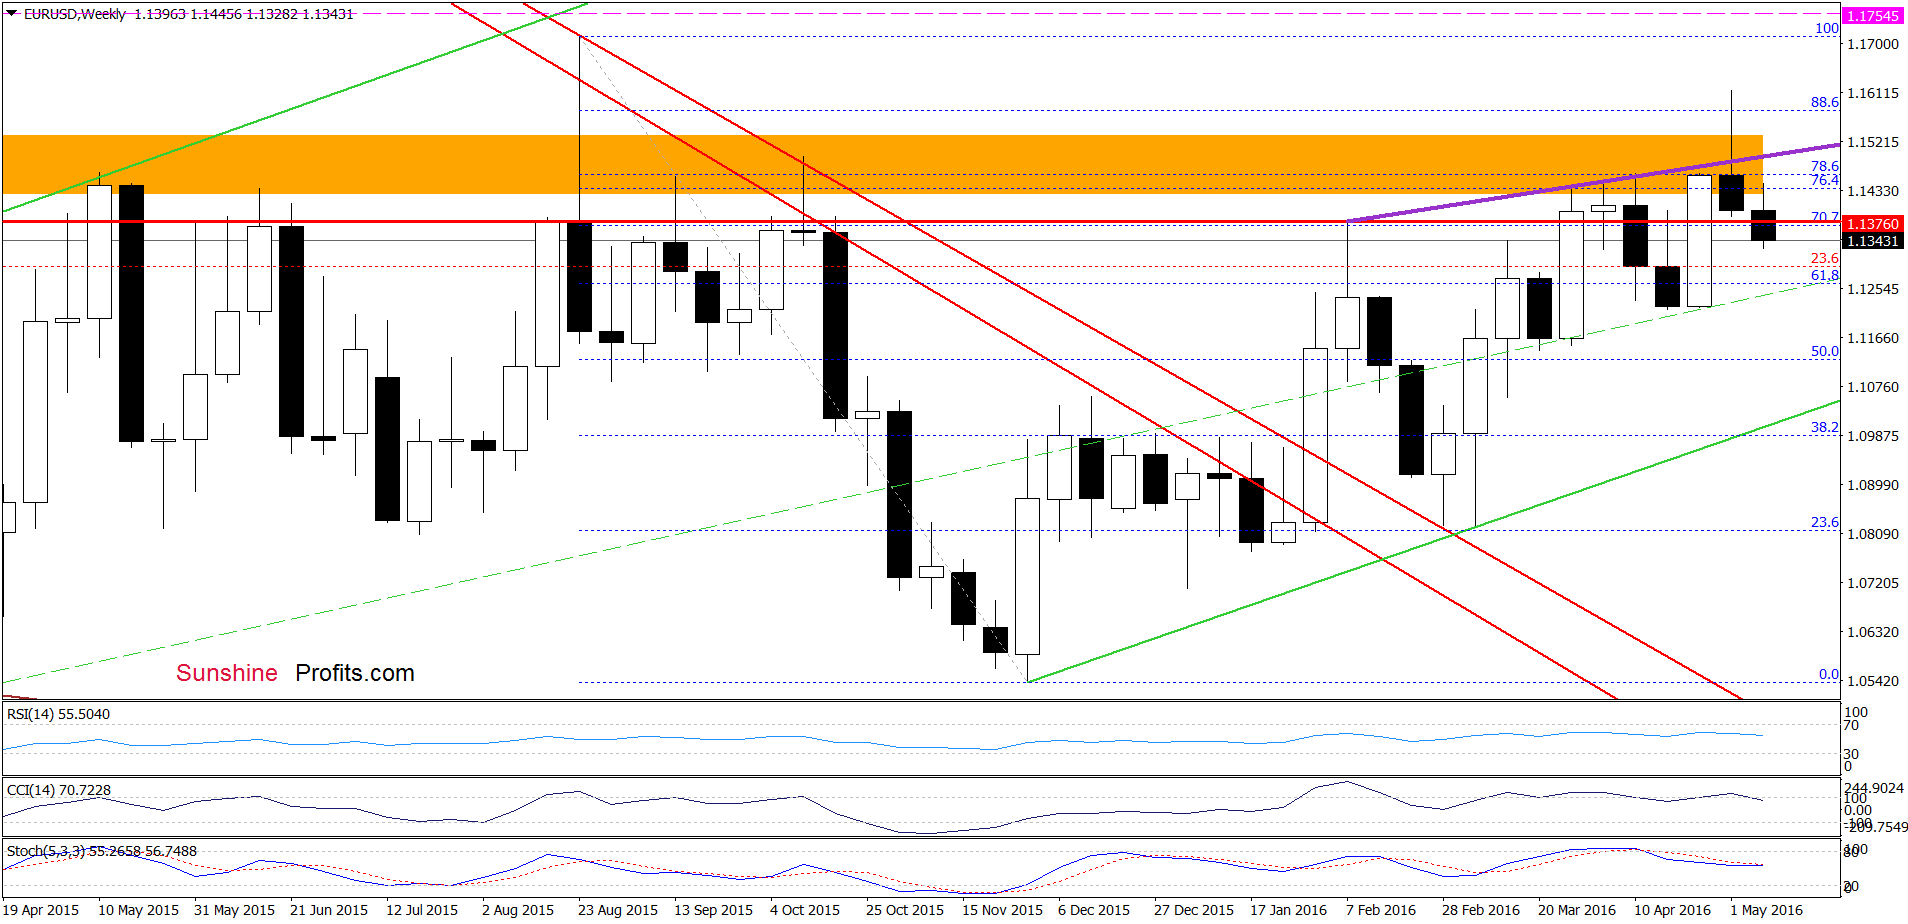
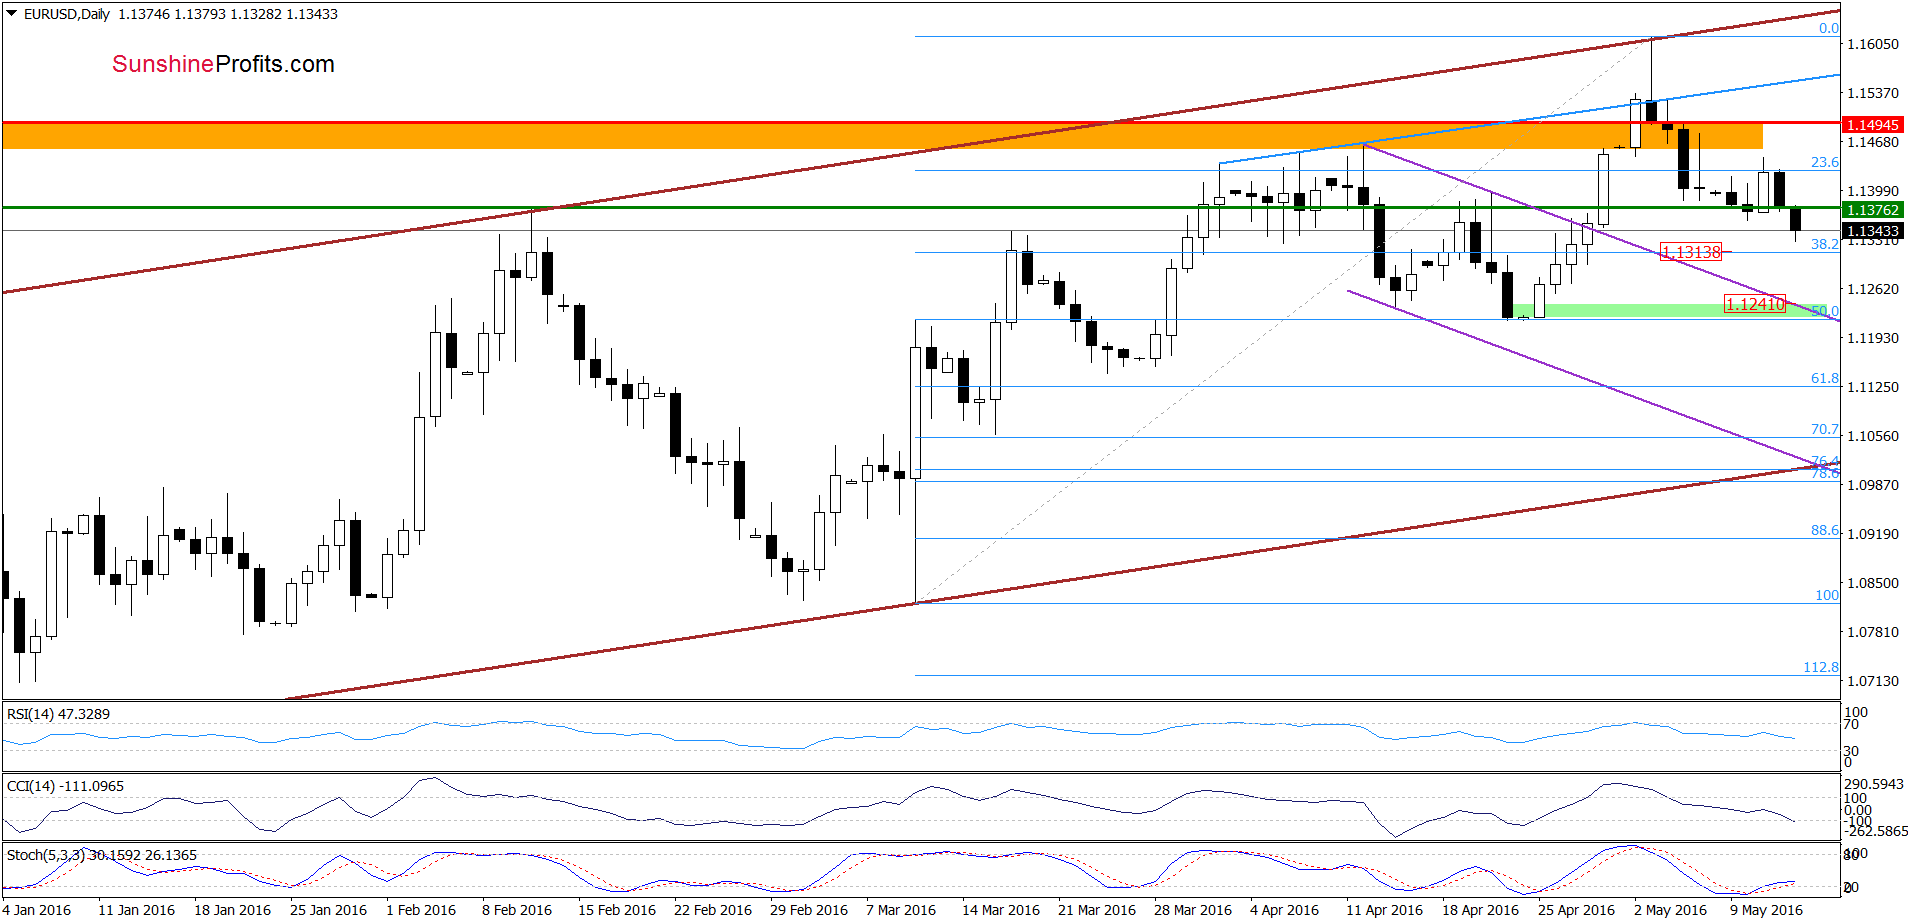
(…) although EUR/USD came back above the green horizontal support line based on the Feb high, invalidating earlier small breakdown, the key resistance area (created by the 76.4%, 78.6% Fibonacci retracements, the blue and purple resistance lines based on previous highs and the Apr highs) continues to keep gains in check. Therefore, we think that another downswing is just around the corner.
As you see on the charts, currency bears pushed the pair lower (as we had expected) and EUR/USD slipped under the green horizontal support line based on the Feb high earlier today. This means that our initial downside target from the previous alert will be in play:
(…) If (…) the exchange rate extends declines, the next downside target would be the 32.8% Fibonacci retracement (based on the March-May rally) around 1.1313.
Finishing today’s alert please note that if currency bears push the pair below the above-mentioned retracement, we’ll likely see a test of the green support zone created by the upper border of the purple declining trend channel, the 50% Fibonacci retracement and the bottom of the previous correction (around 1.1217-1.1241) in the coming days.
Very short-term outlook: bearish
Short-term outlook: bearish
MT outlook: mixed with bearish bias
LT outlook: mixed
Trading position (short-term; our opinion): Short positions (with a stop-loss order at 1.1754 and the initial downside target at 1.1222) are justified from the risk/reward perspective. We will keep you informed should anything change, or should we see a confirmation/invalidation of the above.
GBP/USD
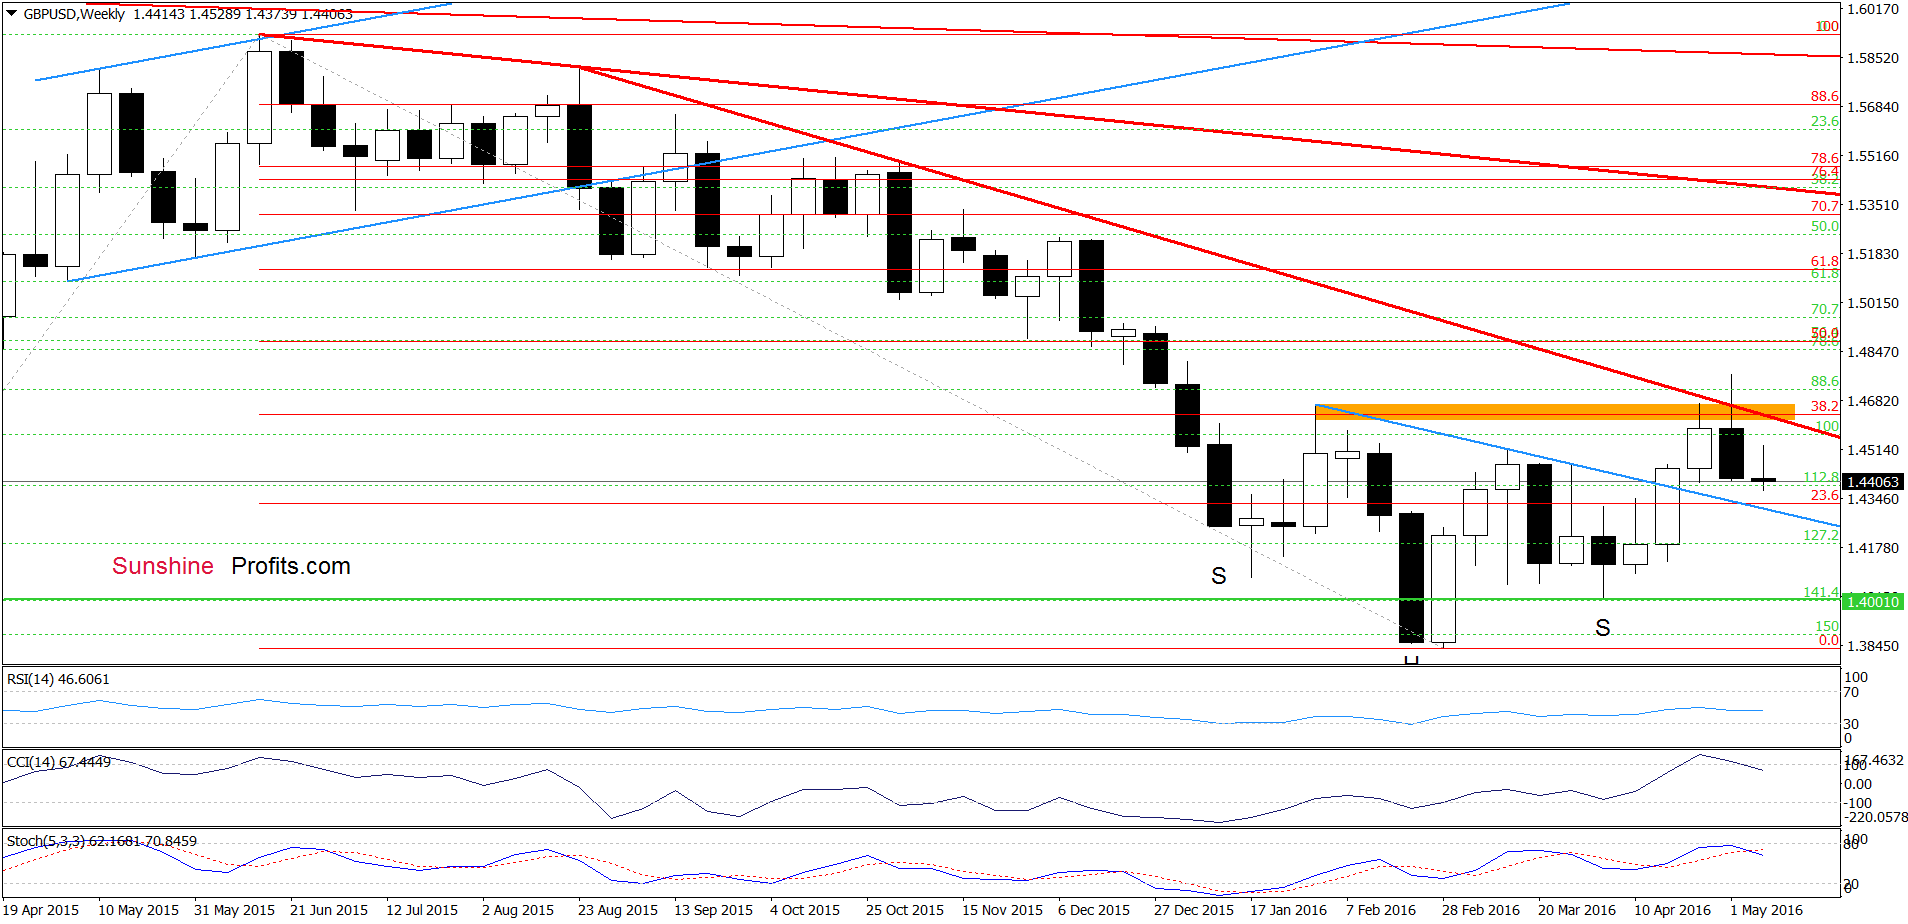
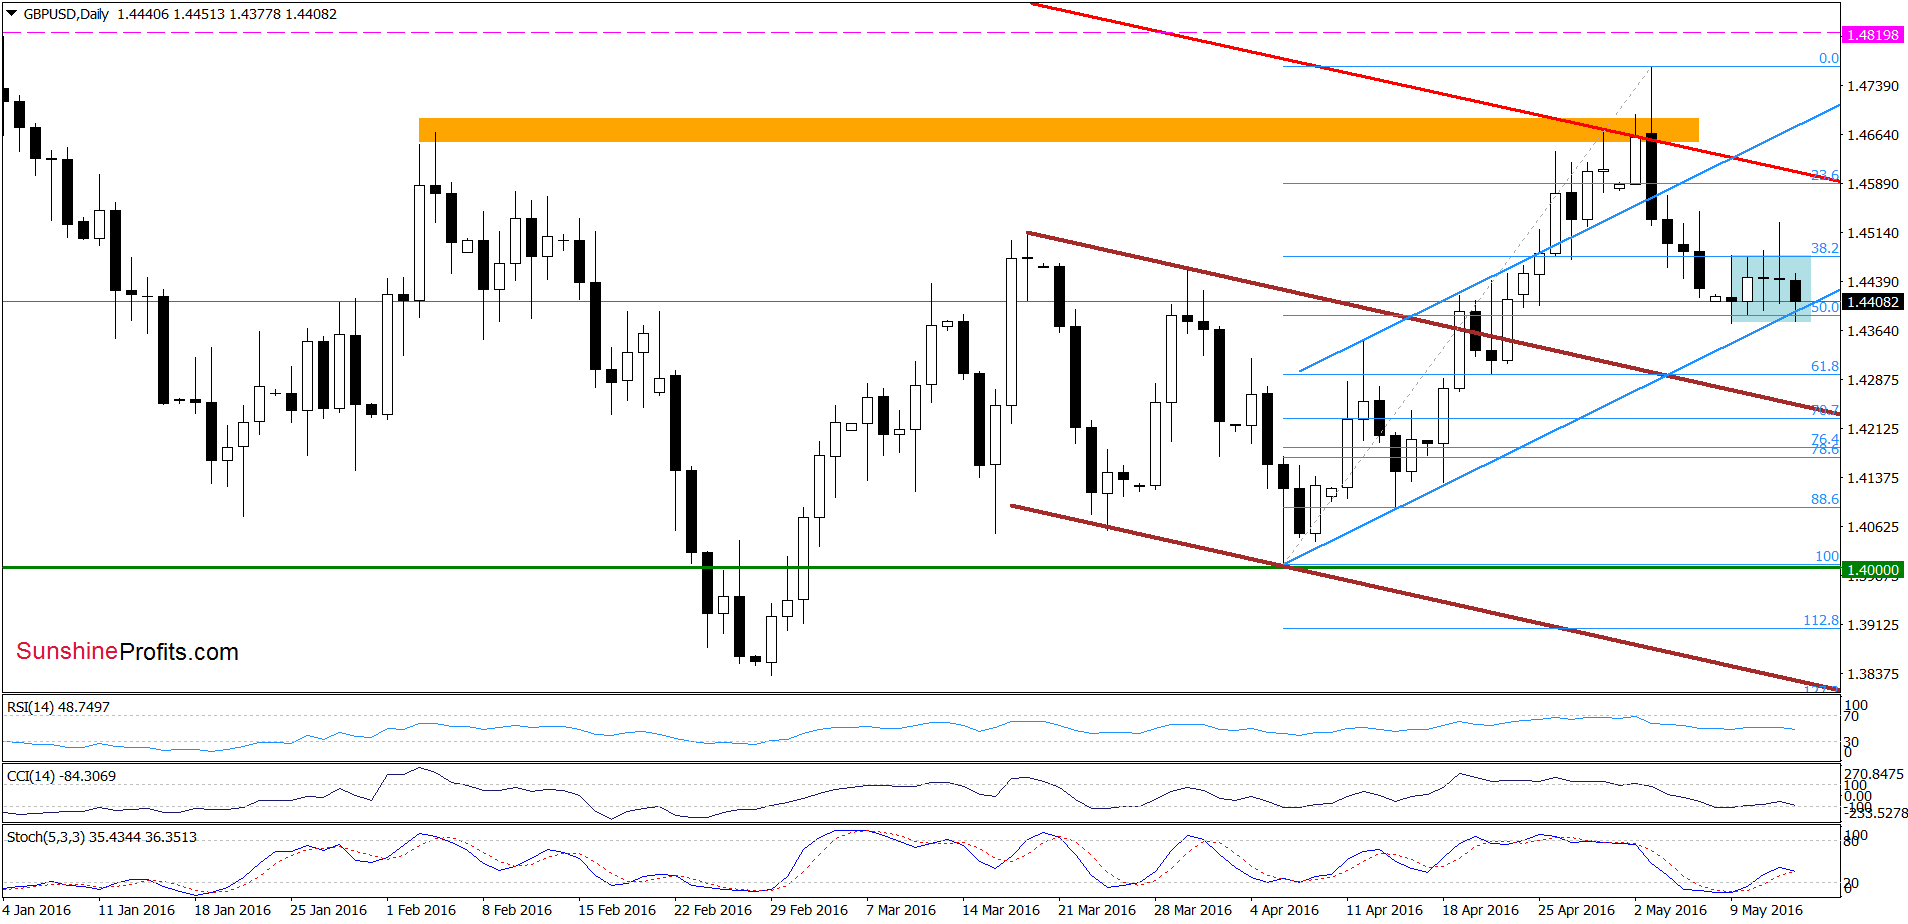
As you see on the charts, GBP/USD remains in the blue consolidation between the 38.2% and 50% Fibonacci retracement levels, slightly above the lower border of the blue rising trend channel. Although currency bulls tried to push the pair higher yesterday, they failed, which resulted in invalidation of earlier small breakout. This negative signal encouraged currency bears to act earlier today, which suggests a drop to our Wednesday’ downside target in the coming days:
(…) sell signals generated by the weekly indicators continue to support currency bears and lower values of the exchange rate in the coming week(s). Therefore, if GBP/USD declines once again, we’ll likely see test the previously-broken neck line of reverse head and shoulders formation and the 61.8% Fibonacci retracement.
Very short-term outlook: bearish
Short-term outlook: mixed with bearish bias
MT outlook: mixed with bearish bias
LT outlook: mixed
Trading position (short-term; our opinion): Short positions (with a stop-loss order at 1.48.19 and the initial downside target at 1.4303) are justified from the risk/reward perspective at the moment. We will keep you informed should anything change, or should we see a confirmation/invalidation of the above.
USD/CAD
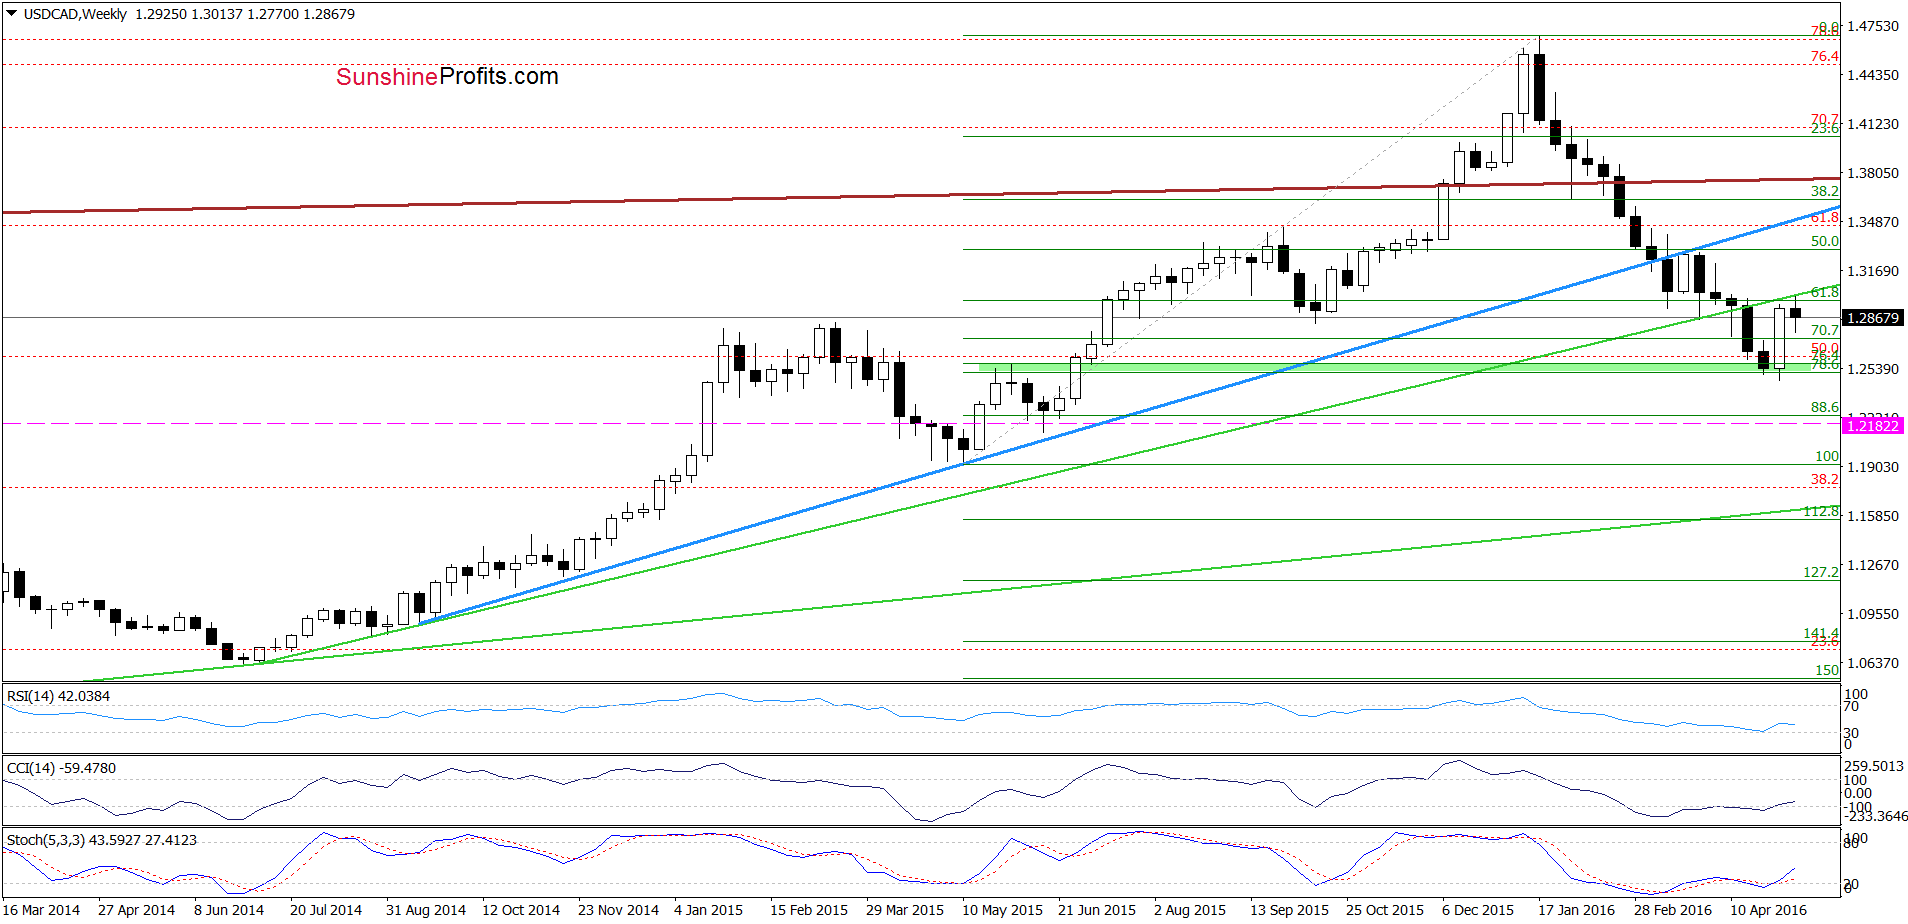
Looking at the medium-term chart, we see that USD/CAD extended gains and reached the previously-broken green support/resistance line, which triggered a pullback earlier this week. What impact did this drop have on the daily chart? Let’s check.
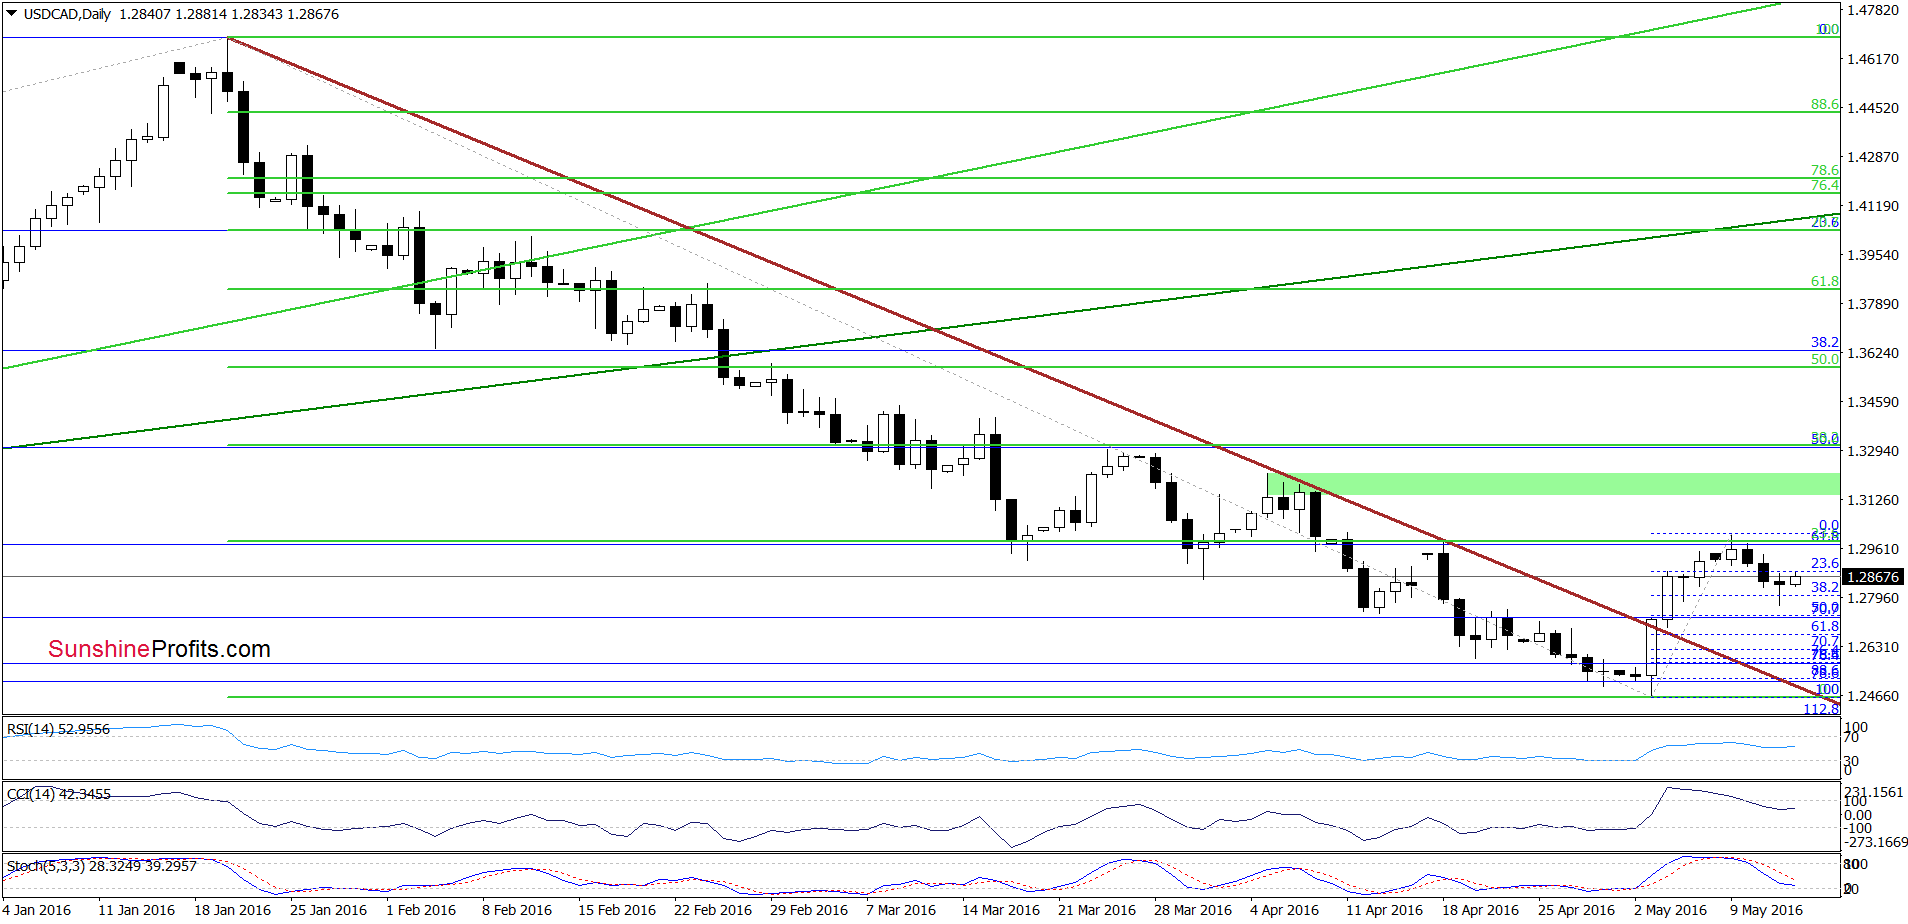
From today’s point of view, we see that the barrier of 1.3000 in combination with sell signals generated by the indicators triggered a pullback, which took USD/CAD slightly below the 38.2% Fibonacci retracement based on the May’s upward move. Despite this drop, currency bulls didn’t give up, which resulted in reversal and rebound earlier today. Taking this fact and buy signals generated by the weekly indicators into account, we think that further improvement is just around the corner.
Very short-term outlook: bullish
Short-term outlook: mixed with bullish bias
MT outlook: mixed
LT outlook: mixed
Trading position (short-term; our opinion): Long positions (with a stop-loss order at 1.2182 and the next upside target at 1.3155) are justified from the risk/reward perspective. We will keep you informed should anything change, or should we see a confirmation/invalidation of the above.
As a reminder – “initial target price” means exactly that – an “initial” one, it’s not a price level at which we suggest closing positions. If this becomes the case, we will refer to these levels as levels of exit orders. Stop-loss levels, however, are naturally not “initial”, but something that, in our opinion, might be entered as an order.
Thank you.
Nadia Simmons
Forex & Oil Trading Strategist
Przemyslaw Radomski, CFA
Founder, Editor-in-chief
Gold & Silver Trading Alerts
Forex Trading Alerts
Oil Investment Updates
Oil Trading Alerts

