

Earlier today, the USD Index moved little lower as uncertainty around today’s U.S. nonfarm payrolls report increased after disappointing ADP report and yesterday’s initial jobless claims numbers. Thanks to these circumstances, the U. S. dollar declined slightly against its Canadian counterpart, but did this move change anything in the overall picture of USD/CAD?
In our opinion the following forex trading positions are justified - summary:
- EUR/USD: short (stop-loss order at 1.1754; initial downside target at 1.1222)
- GBP/USD: short (stop-loss order at 1.4819; initial downside target at 1.4303)
- USD/JPY: none
- USD/CAD: long (stop-loss order at 1.2182; initial upside target at 1.3000)
- USD/CHF: none
- AUD/USD: none
EUR/USD
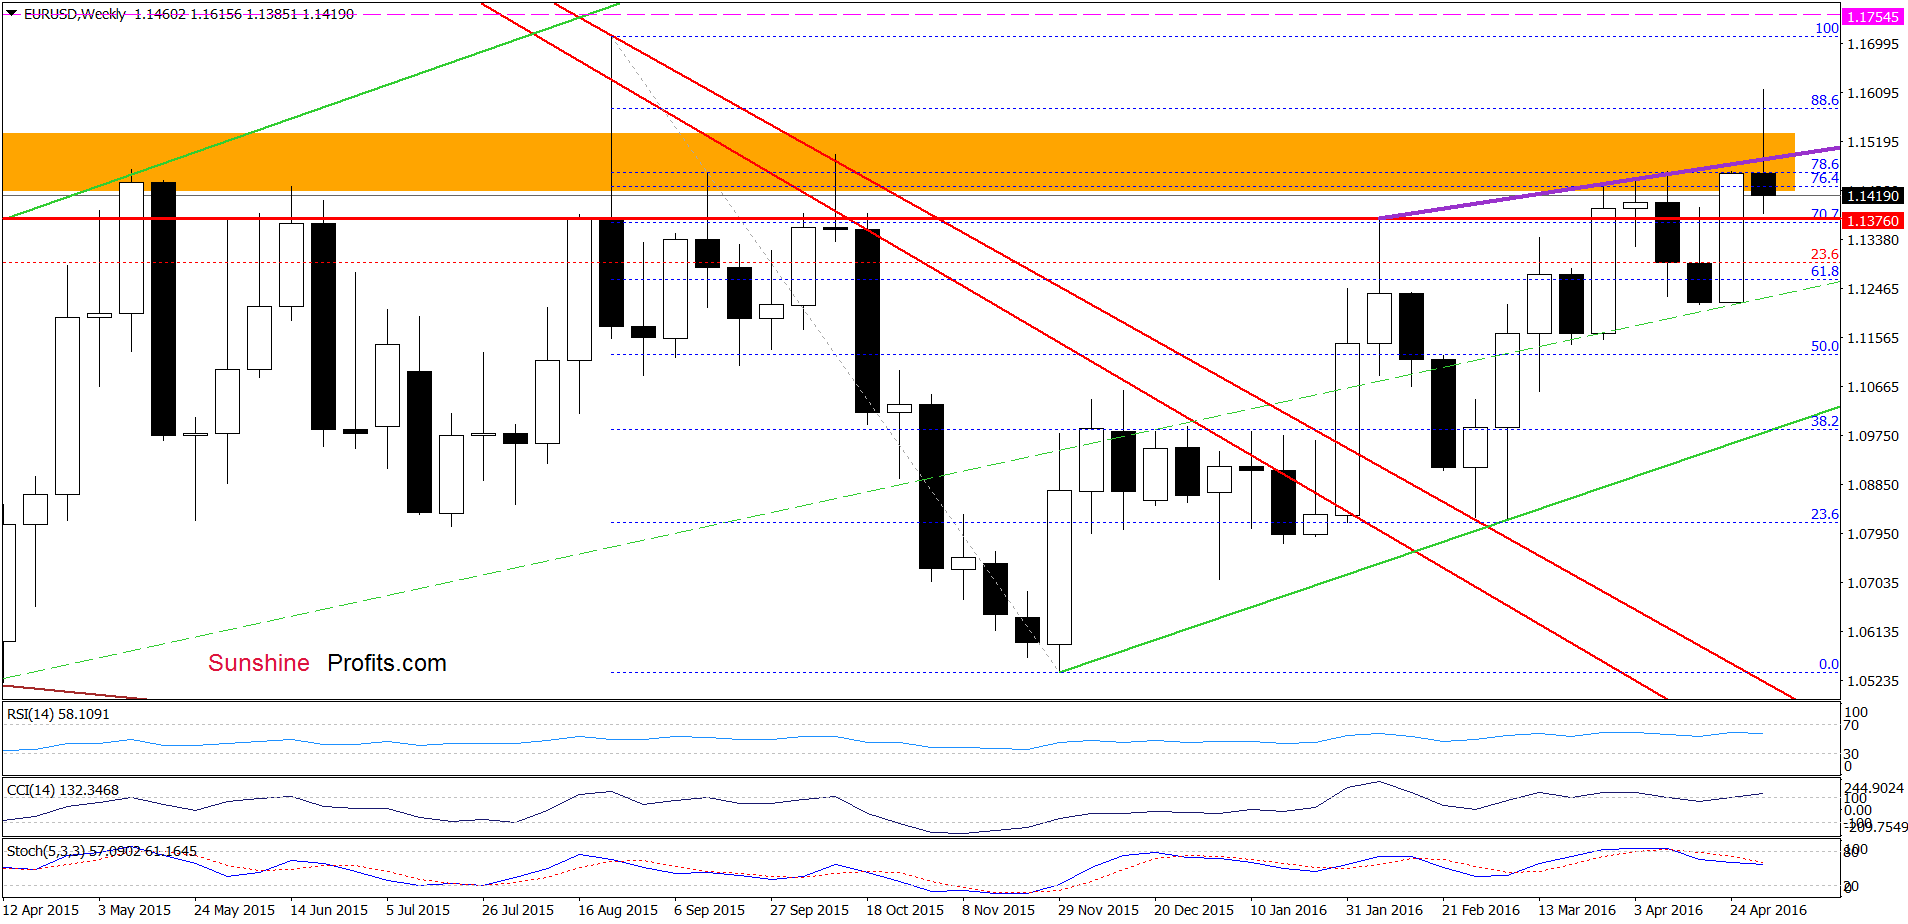
From the medium-term perspective, we see that EUR/USD is still trading under the previously-broken purple support/resistance line based on recent highs, which means that invalidation of earlier breakout and its negative impact on the exchange rate is still in effect, suggesting further deterioration in the coming days.
What can we infer from the very short-term picture? Let’s check.
Quoting our Wednesday’s commentary:
(…) If (…) the pair declines from current levels, the initial downside target would be around 1.1376, where the green horizontal support line (based on the Feb high) is.
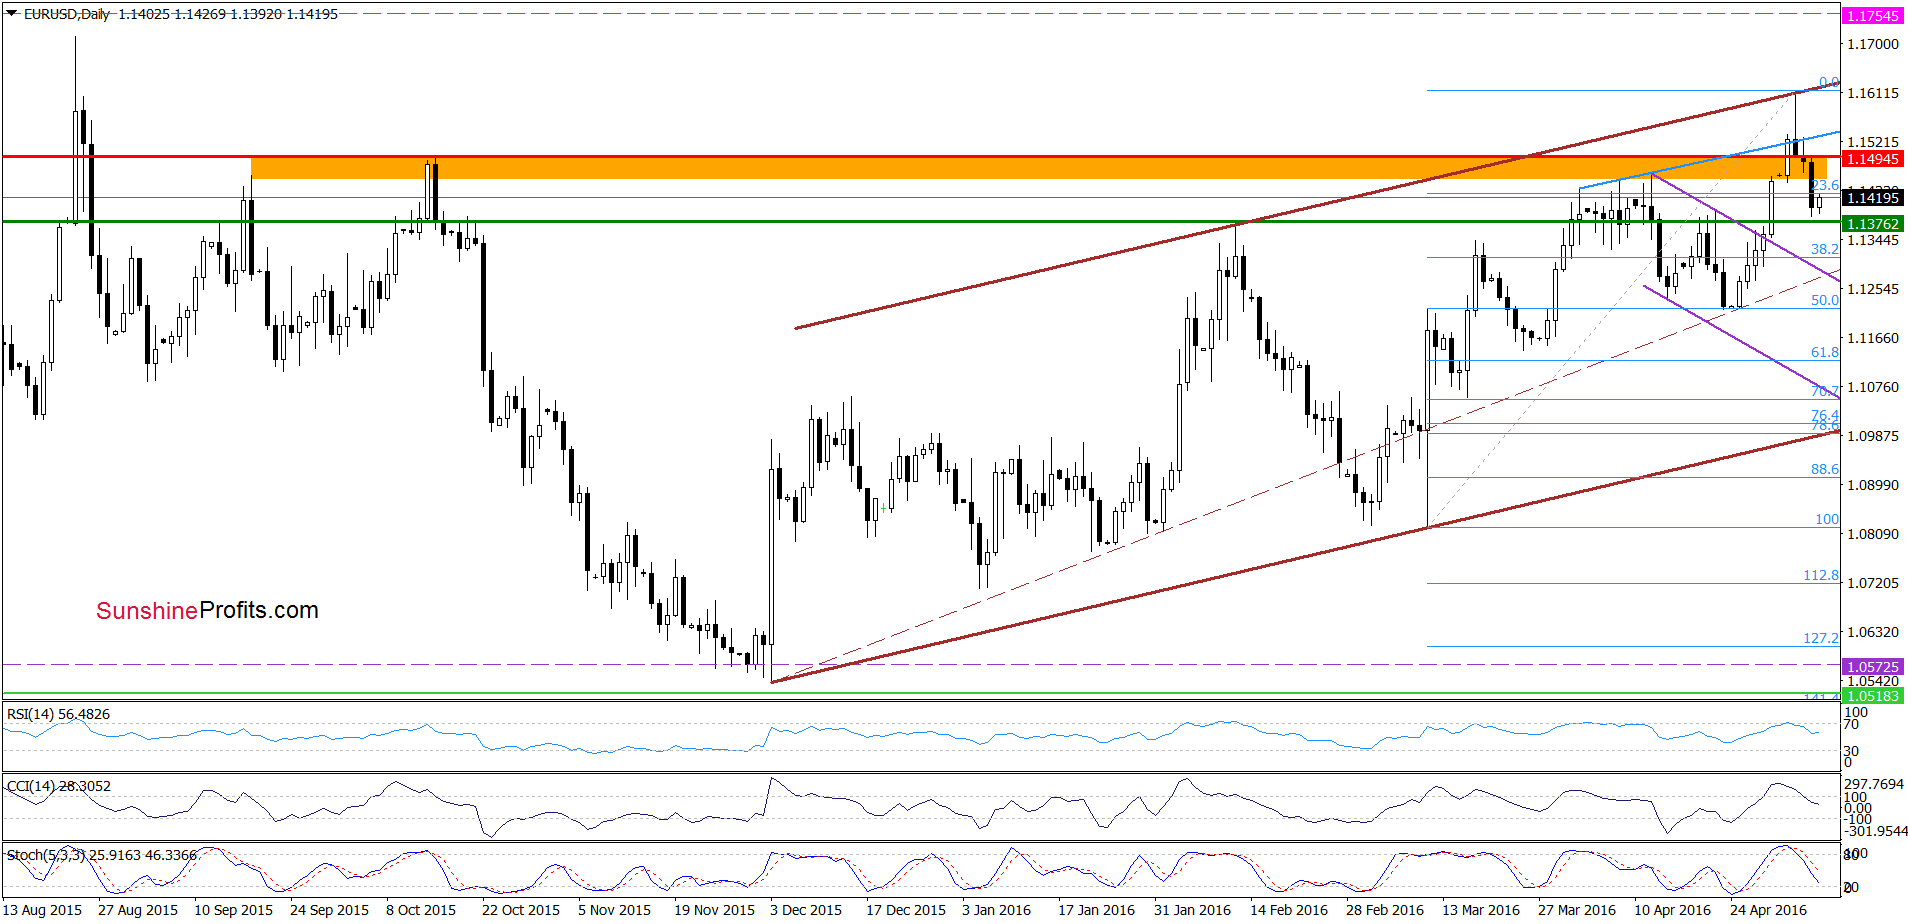
Looking at the daily chart, we see that the situation developed in line with the above scenario and EUR/USD approached our first downside target yesterday. This support encouraged currency bulls to act, which resulted in small rebound earlier today. Nevertheless, the exchange rate still remains under the orange resistance zone and the previous highs, which in combination with sell signals generated by the indicators suggests another attempt to move lower in the coming days – especially if the pair closes the week under the purple line marked on the weekly chart and all resistance levels seen on the daily chart. If we see such price action and a drop under the Feb high, the next downside target would be around 1.1289, where the upper border of the purple declining trend channel is.
Very short-term outlook: bearish
Short-term outlook: bearish
MT outlook: mixed with bearish bias
LT outlook: mixed
Trading position (short-term; our opinion): Short positions (with a stop-loss order at 1.1754 and the initial downside target at 1.1222) are justified from the risk/reward perspective. We will keep you informed should anything change, or should we see a confirmation/invalidation of the above.
USD/JPY
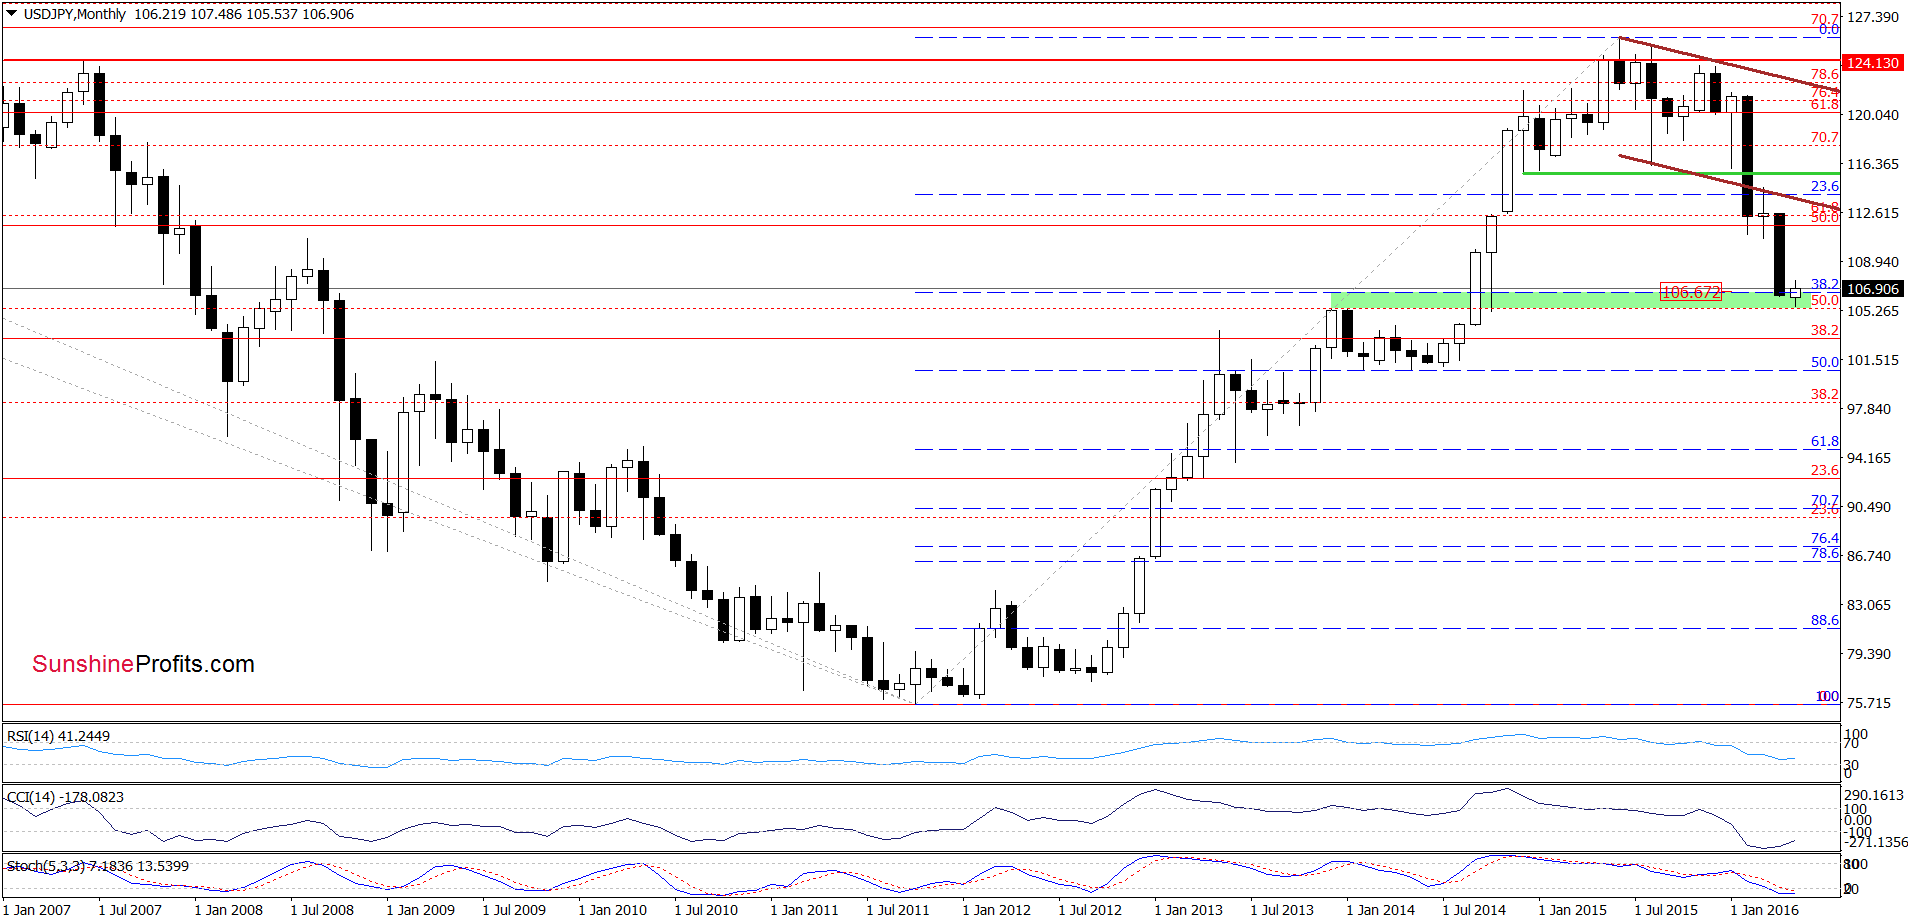
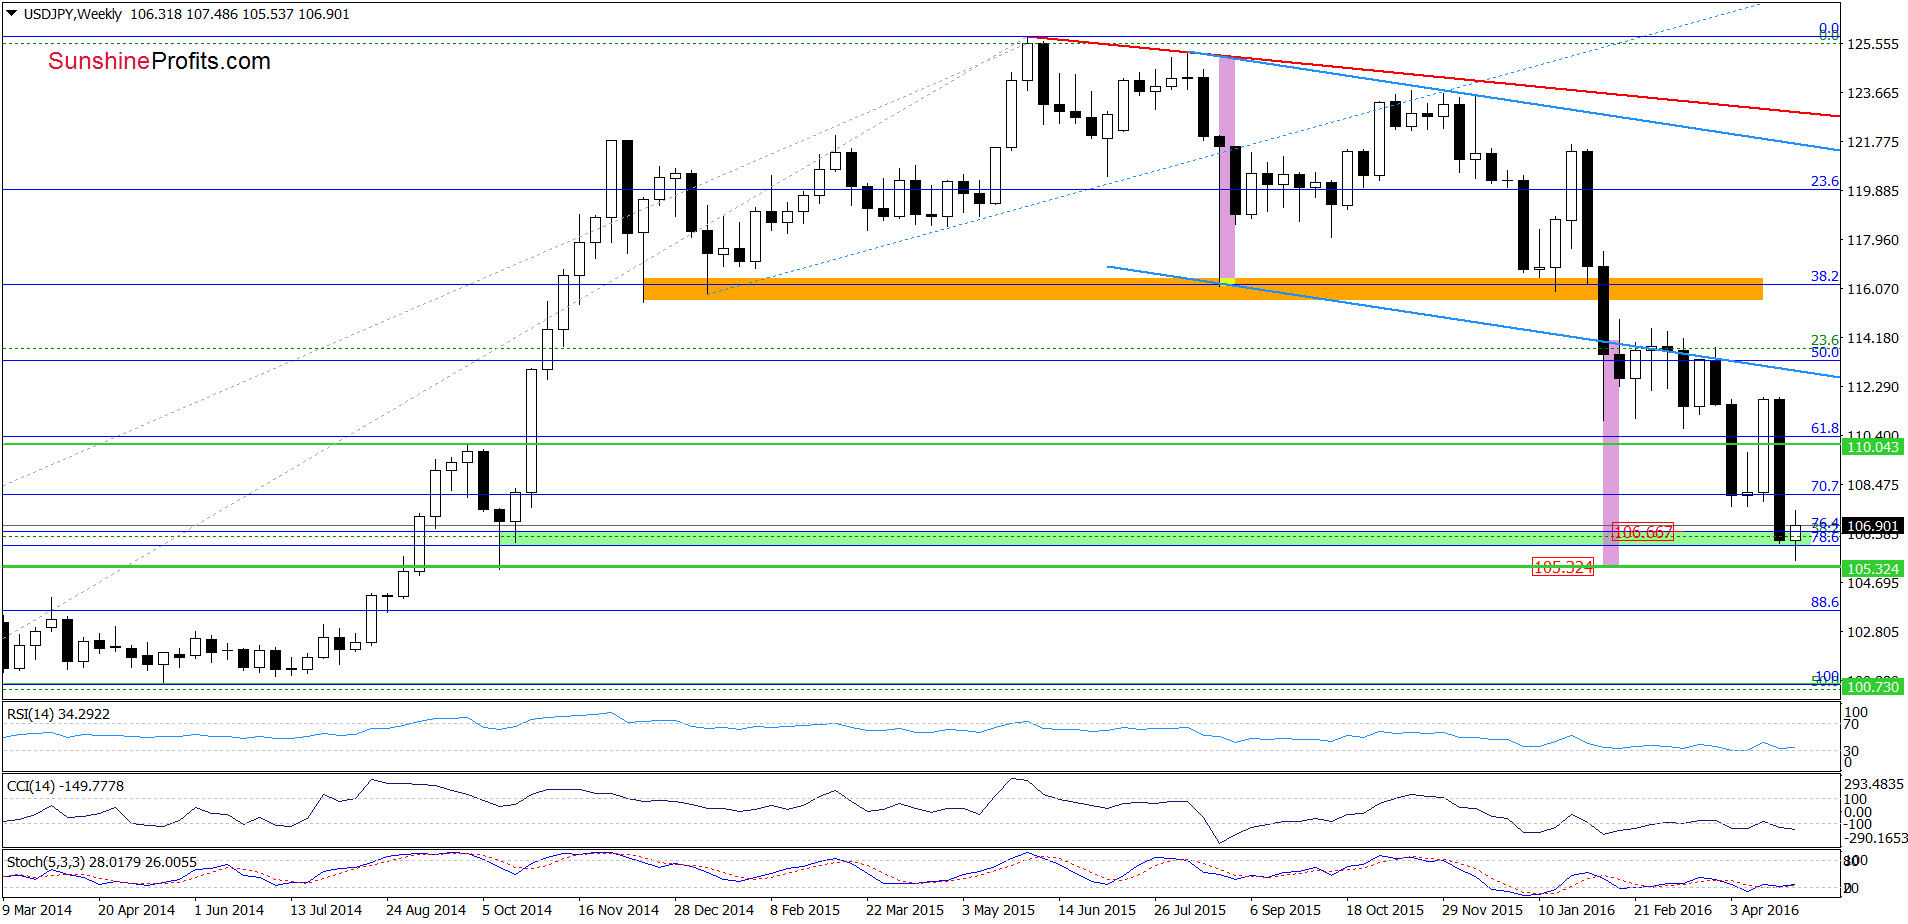
Looking at the charts, we see that USD/JPY extended gains slightly and climbed above the previously broken 38.2% Fibonacci retracement (marked on the monthly chart) and the green zone seen on the weekly chart. Although this is a positive signal that suggests further improvement (potential invalidation of earlier breakdown), we still think that as long as there won’t be weekly closure above the green zone further improvement is questionable.
Very short-term outlook: mixed
Short-term outlook: mixed
MT outlook: mixed
LT outlook: mixed
Trading position (short-term; our opinion): No positions are justified from the risk/reward perspective at the moment. We will keep you informed should anything change, or should we see a confirmation/invalidation of the above.
USD/CAD
On Wednesday, we wrote:
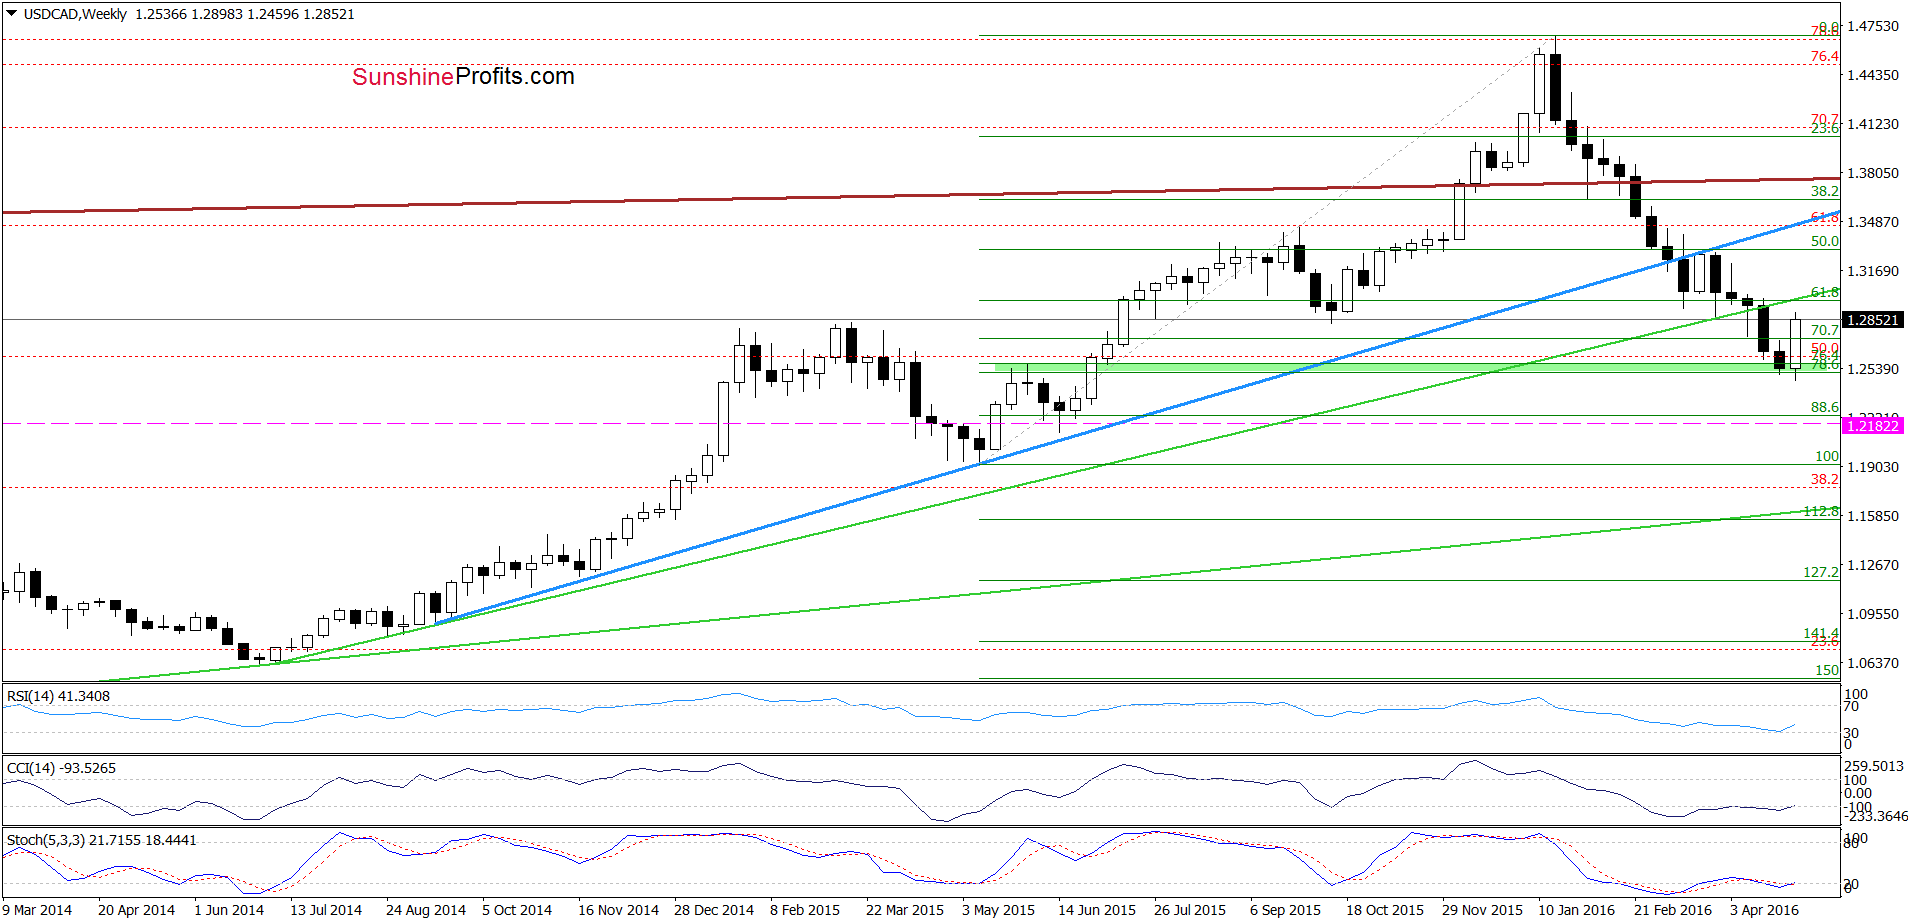
(…) although USD/CAD slipped under the green zone, currency bulls didn’t give up and pushed the pair higher. As a result, the exchange rate invalidated earlier small breakdown, which is a positive signal – especially when we take into account the current position of the indicators.
From today’s point of view, we see that USD/CAD extended gains (as we had expected), which in combination with buy signals suggests a test of the green line (the first important resistance) in the coming week.
How did this move affect the very short-term picture? Let’s check.
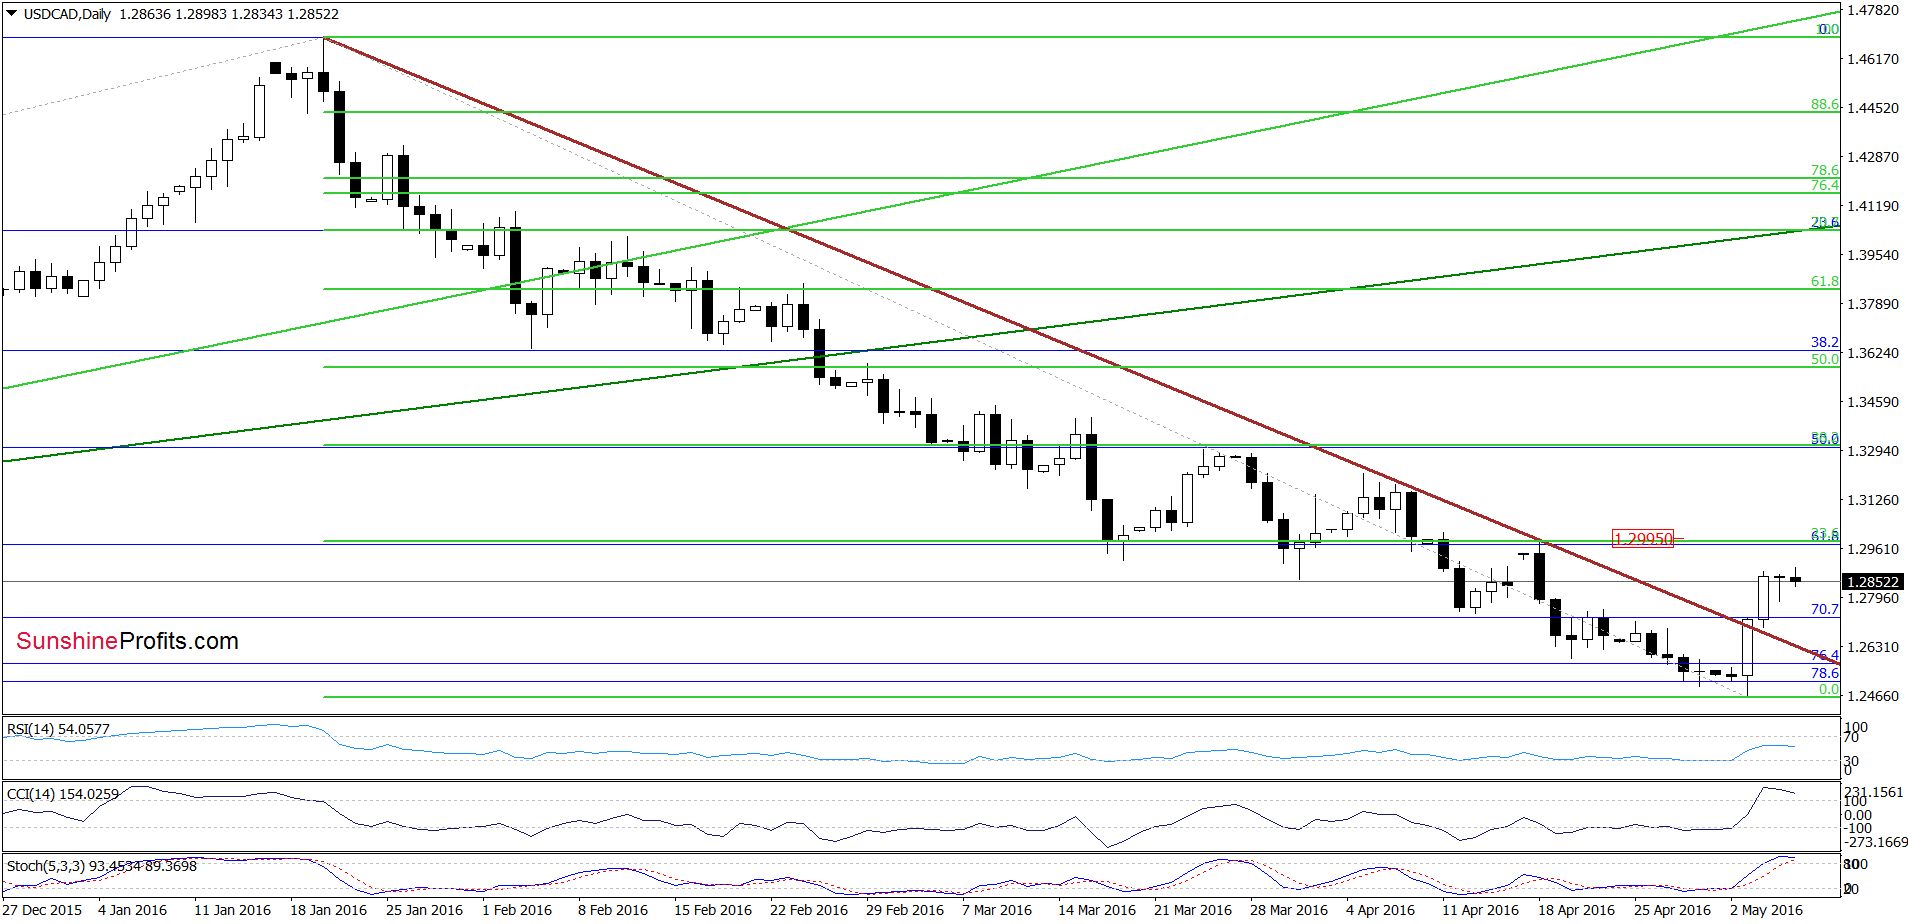
On the daily chart, we see that the pair confirmed earlier breakout above the brown medium-term declining resistance line by three consecutive closures above it, which is a bullish signal. Although CCI and Stochastic Oscillator are overbought at the moment, we think that as long as there are no sell signals another attempt to move higher is likely. If this is the case and the exchange rate increases from here, the initial upside target would be around 1.3000, where the first Fibonacci retracement and the Apr 18 high are.
Very short-term outlook: mixed with bullish bias
Short-term outlook: mixed
MT outlook: mixed
LT outlook: mixed
Trading position (short-term; our opinion): Long positions (with a stop-loss order at 1.2182 and the initial upside target at 1.3000) are justified from the risk/reward perspective. We will keep you informed should anything change, or should we see a confirmation/invalidation of the above.
As a reminder – “initial target price” means exactly that – an “initial” one, it’s not a price level at which we suggest closing positions. If this becomes the case, we will refer to these levels as levels of exit orders. Stop-loss levels, however, are naturally not “initial”, but something that, in our opinion, might be entered as an order.
Thank you.
Nadia Simmons
Forex & Oil Trading Strategist
Przemyslaw Radomski, CFA
Founder, Editor-in-chief
Gold & Silver Trading Alerts
Forex Trading Alerts
Oil Investment Updates
Oil Trading Alerts

