

Yesterday, the U.S. dollar moved sharply higher against its Canadian counterpart as declining price of crude oil weighed on the commodity-related currency. As a result, USD/CAD increased above the medium-term declining resistance line. Breakout or Fakeout?
In our opinion the following forex trading positions are justified - summary:
- EUR/USD: short (stop-loss order at 1.1754; initial downside target at 1.1222)
- GBP/USD: short (stop-loss order at 1.4819; initial downside target at 1.4303)
- USD/JPY: none
- USD/CAD: long (stop-loss order at 1.2182; initial upside target at 1.3000)
- USD/CHF: none
- AUD/USD: none
EUR/USD
The situation in the medium term hasn’t changed much since yesterday. Today, we’ll focus on the very short-term picture.
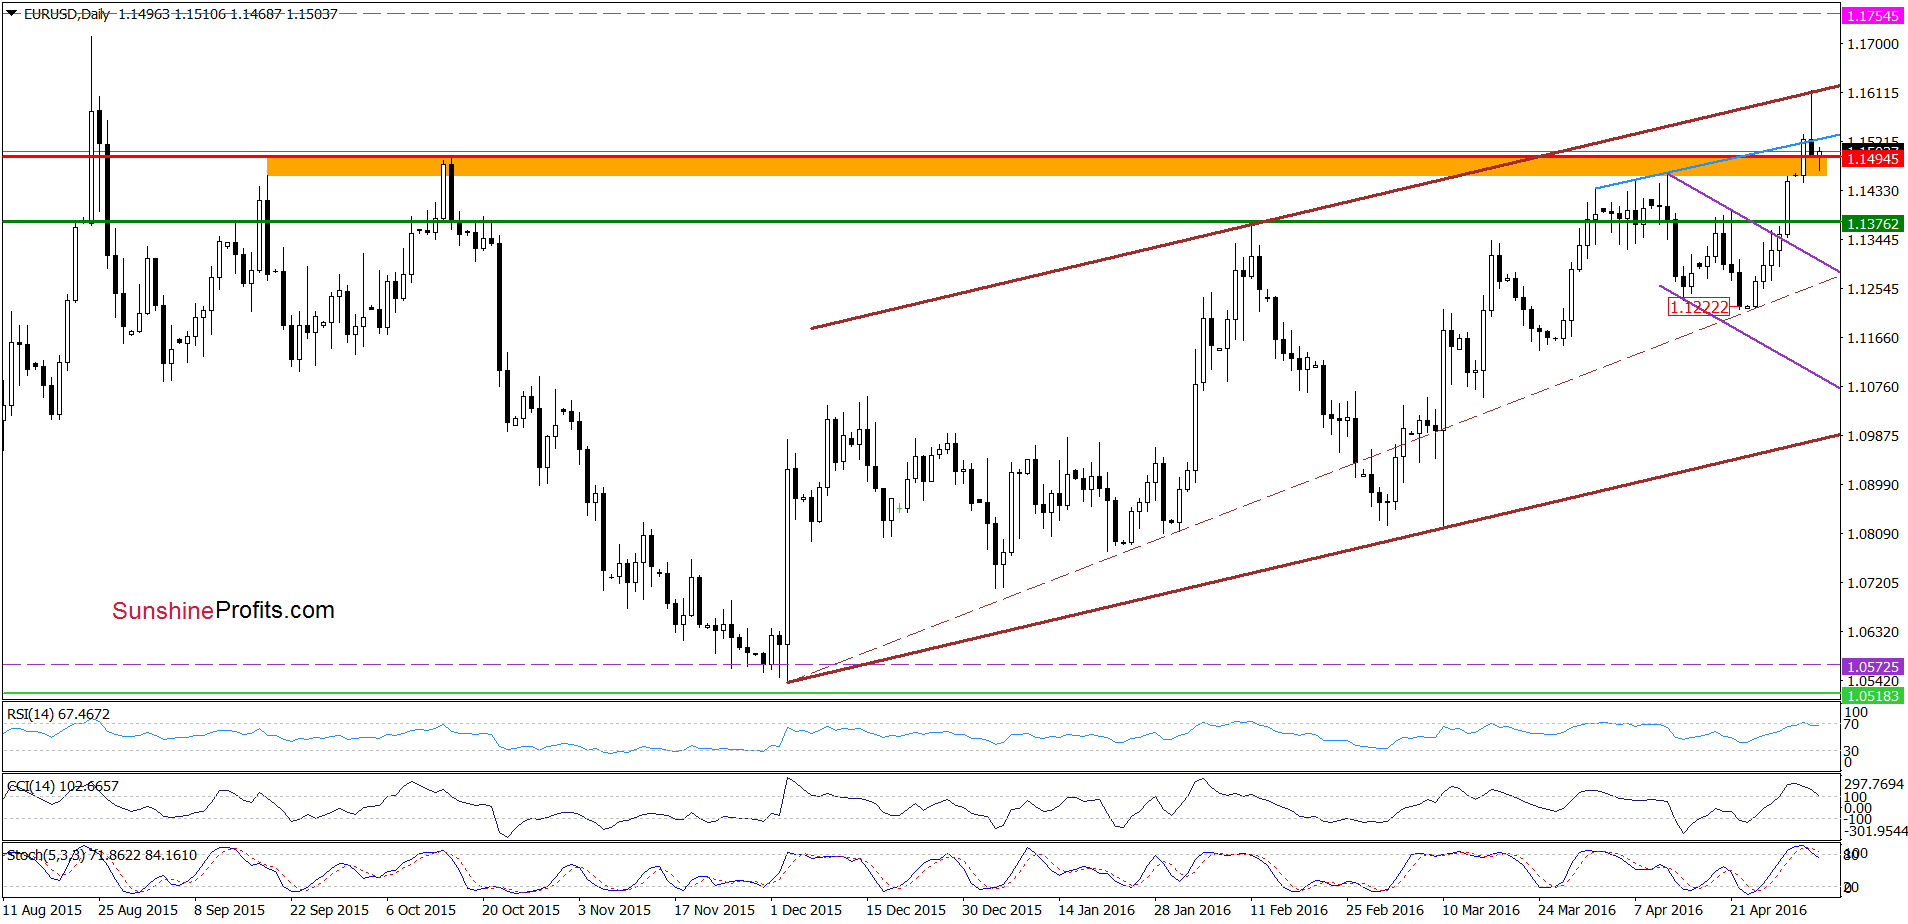
Earlier today EUR/USD reversed and increased slightly, which suggests that we may see a verification of the breakdown under the blue resistance line based on the previous highs. Nevertheless, even if we see such price action, we should keep in mind that the RSI and Stochastic Oscillator generated sell signals (while the CCI is very close to doing the same), which suggests further deterioration in the coming days. If this is the case and the pair declines from current levels, the initial downside target would be around 1.1376, where the green horizontal support line (based on the Feb high) is.
Very short-term outlook: bearish
Short-term outlook: bearish
MT outlook: mixed with bearish bias
LT outlook: mixed
Trading position (short-term; our opinion): Short positions (with a stop-loss order at 1.1754 and the initial downside target at 1.1222) are justified from the risk/reward perspective. We will keep you informed should anything change, or should we see a confirmation/invalidation of the above.
USD/JPY
Quoting our previous commentary on this currency pair:
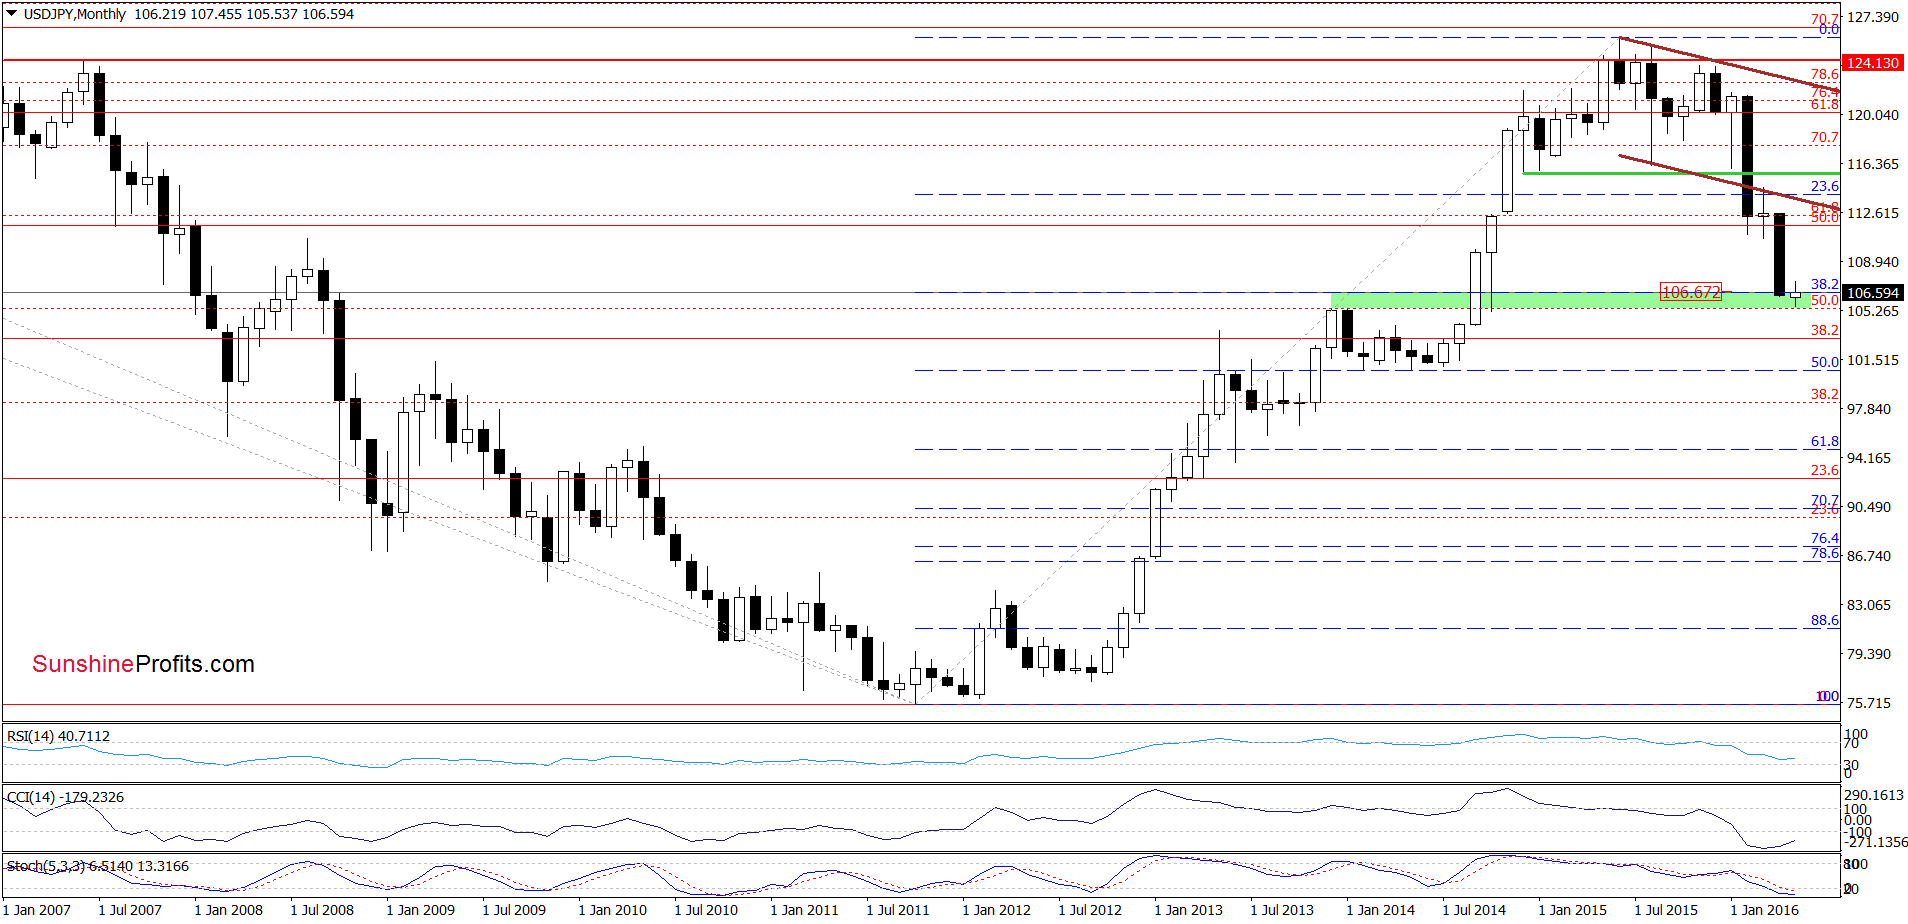
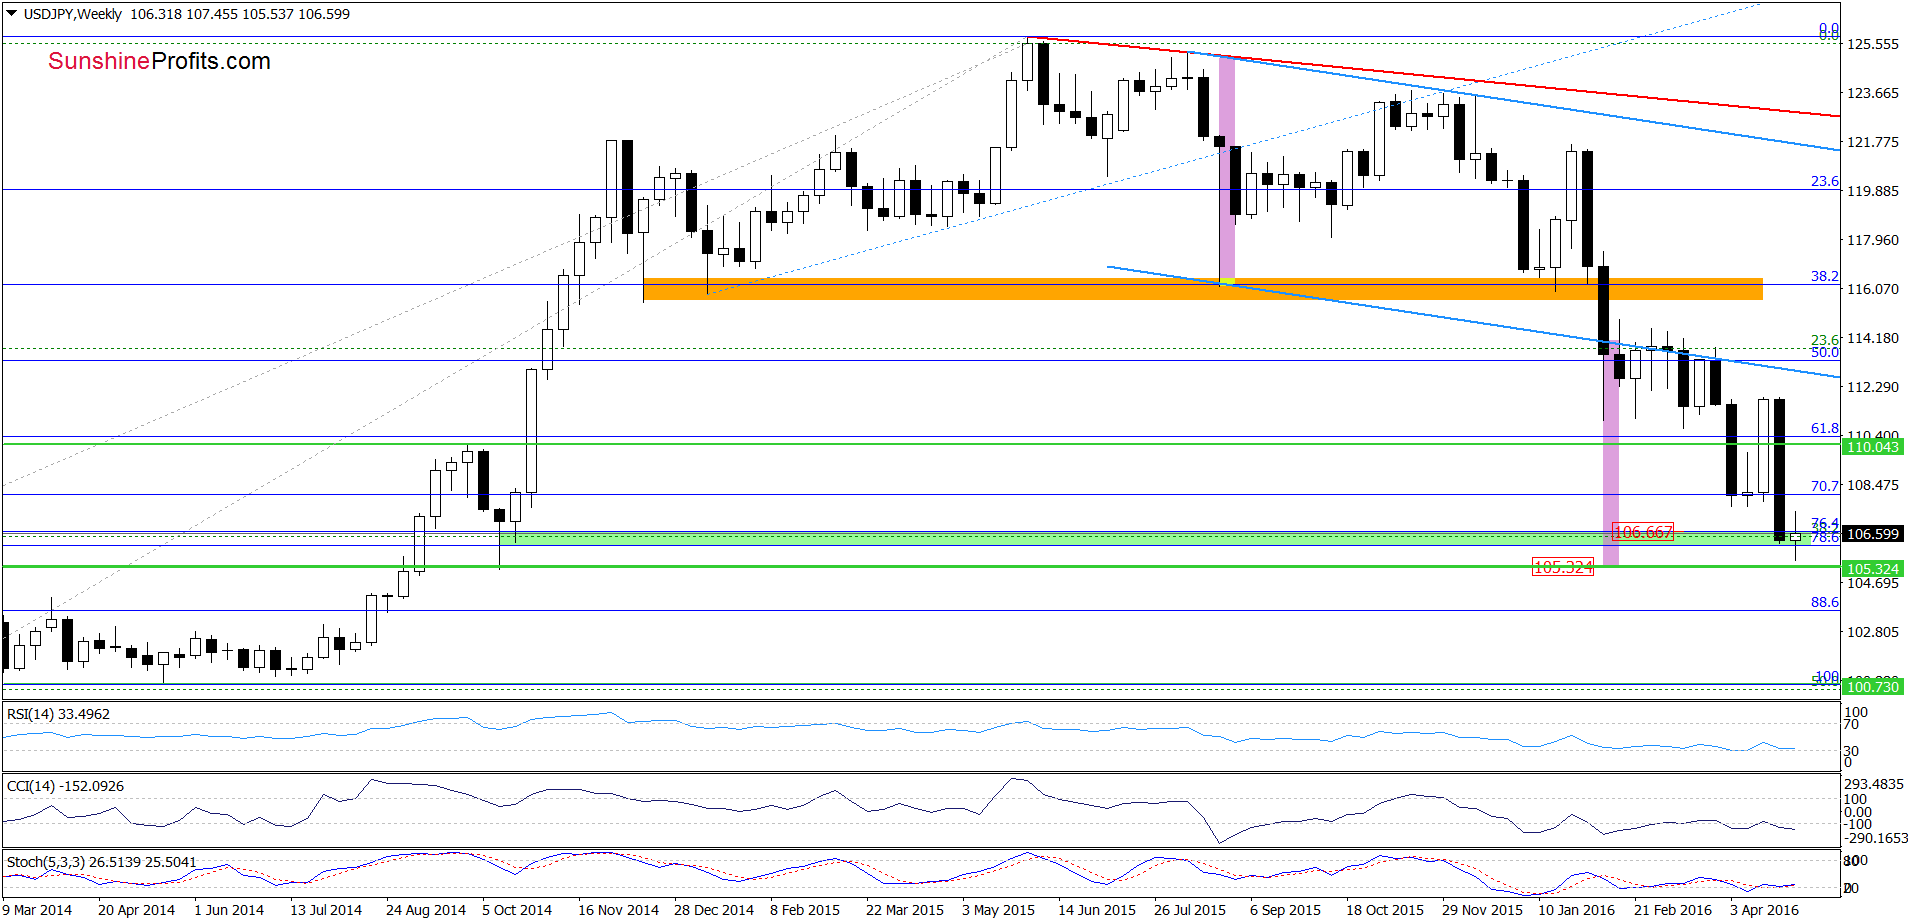
(…) we think that the space for further declines may be limited. Why? (…) not far from current levels (around 105.40-105.42) are Dec 2013 and Jan 2014 highs, which serve as support. Additionally, around 105.32 the size of the downward move will correspond to the height of the blue declining trend channel (marked on the weekly chart), which could wane the selling pressure in the coming week.
Looking at the charts, we see that the situation developed in line with the above scenario and currency bulls pushed the pair higher. Nevertheless, the size of the move is currently too small to say with conviction that the worst is already behind the exchange rate – especially when we factor in the fact that USD/JPY still remains under the previously broken 38.2% Fibonacci retracement (marked on the monthly chart). Therefore, in our opinion, as long as there won’t be weekly closure above the green zone (seen on the weekly chart) another downswing can’t be ruled out.
Very short-term outlook: mixed
Short-term outlook: mixed
MT outlook: mixed
LT outlook: mixed
Trading position (short-term; our opinion): No positions are justified from the risk/reward perspective at the moment. We will keep you informed should anything change, or should we see a confirmation/invalidation of the above.
USD/CAD
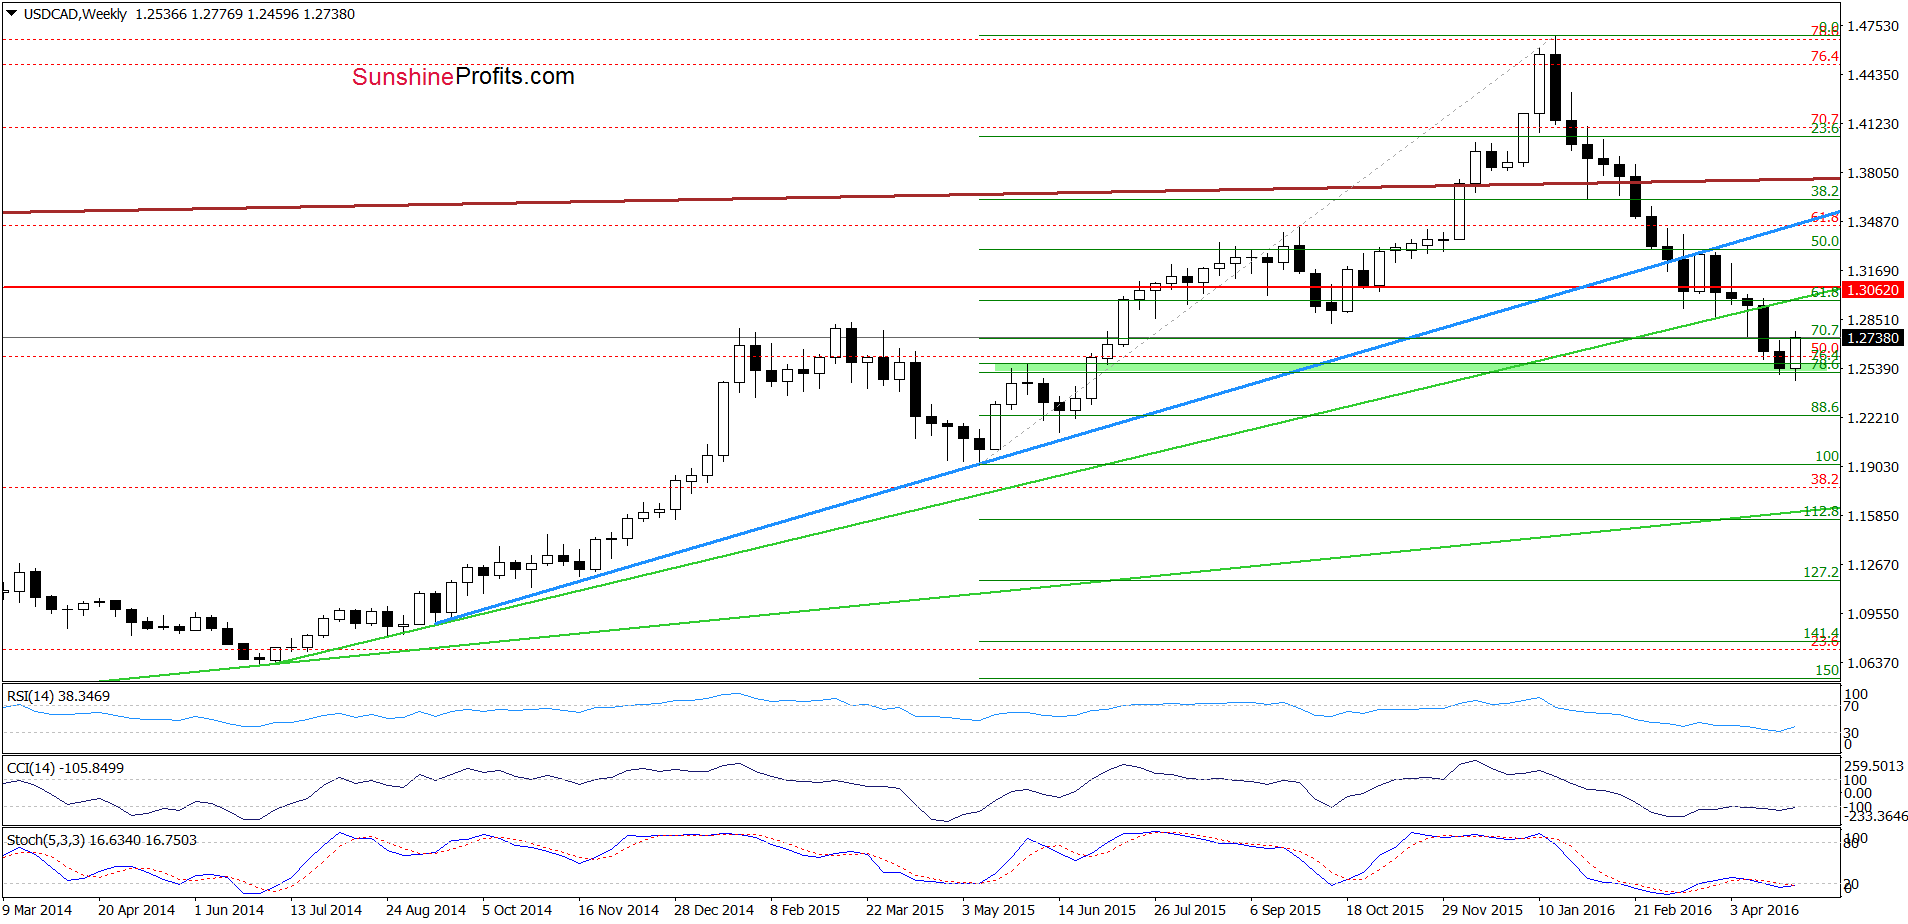
On Monday, we wrote the following:
(…) the exchange rate reached the green support zone (created by the 76.4% and 78.6% Fibonacci retracement levels), which suggests that reversal in the coming week is very likely (…)
On the weekly chart, we see that although USD/CAD slipped under the green zone, currency bulls didn’t give up and pushed the pair higher. As a result, the exchange rate invalidated earlier small breakdown, which is a positive signal – especially when we take into account the current position of the indicators.
How did this move affect the very short-term picture? Let’s check.
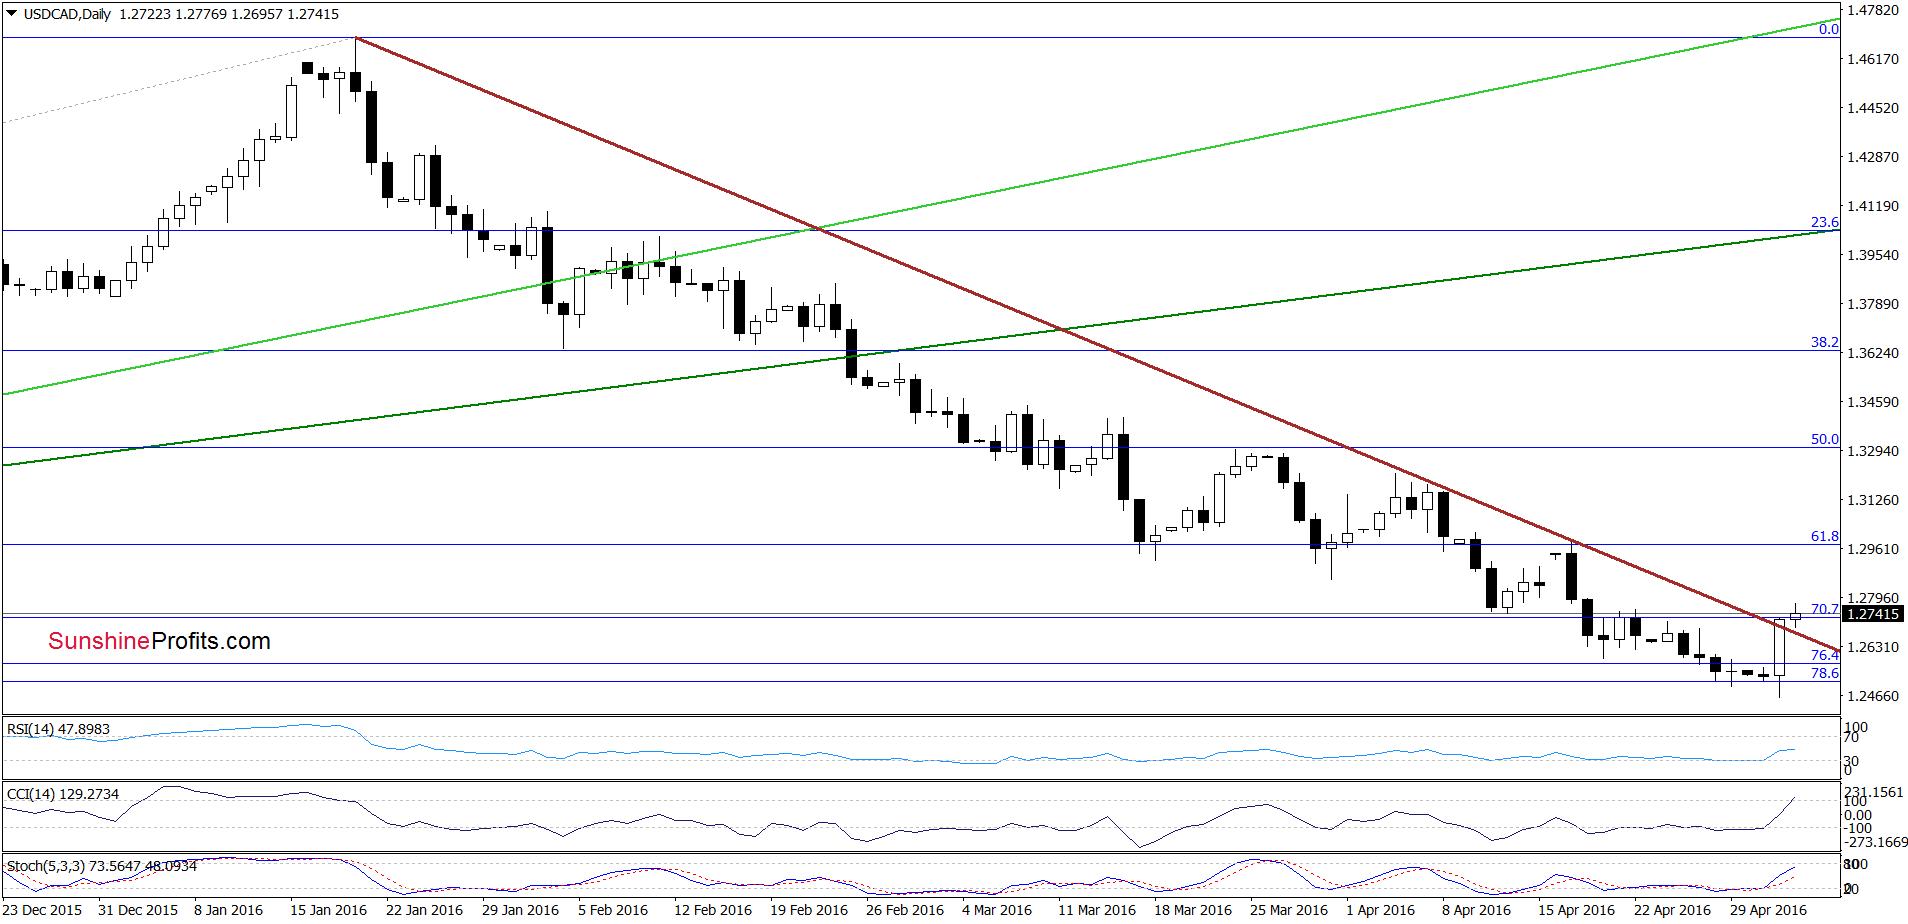
The first thing that caches the eye on the above chart is breakout above the medium-term declining brown resistance line, which is a bullish signal. Additionally, buy signals generated by the indicators remain in place, supporting currency bulls and further improvement. If this is the case and the pair extends gains, the initial upside target would be around 1.3000, where the first Fibonacci retracement and the Apr 18 high are.
Very short-term outlook: bullish
Short-term outlook: mixed with bullish bias
MT outlook: mixed
LT outlook: mixed
Trading position (short-term; our opinion): Long positions (with a stop-loss order at 1.2182 and the initial upside target at 1.3000) are justified from the risk/reward perspective. We will keep you informed should anything change, or should we see a confirmation/invalidation of the above.
Thank you.
Nadia Simmons
Forex & Oil Trading Strategist
Przemyslaw Radomski, CFA
Founder, Editor-in-chief
Gold & Silver Trading Alerts
Forex Trading Alerts
Oil Investment Updates
Oil Trading Alerts

