

Earlier today, official data showed that the euro zone’s Manufacturing PMI increased to 51.7, beating earlier forecasts, which pushed the euro higher against the greenback. As a result, EUR/USD hit a fresh 2016 high and approached the key resistance zone. What happened at the same time with our other currency pairs?
In our opinion the following forex trading positions are justified - summary:
- EUR/USD: short (stop-loss order at 1.1586; initial downside target at 1.0572)
- GBP/USD: none
- USD/JPY: none
- USD/CAD: none
- USD/CHF: none
- AUD/USD: none
EUR/USD
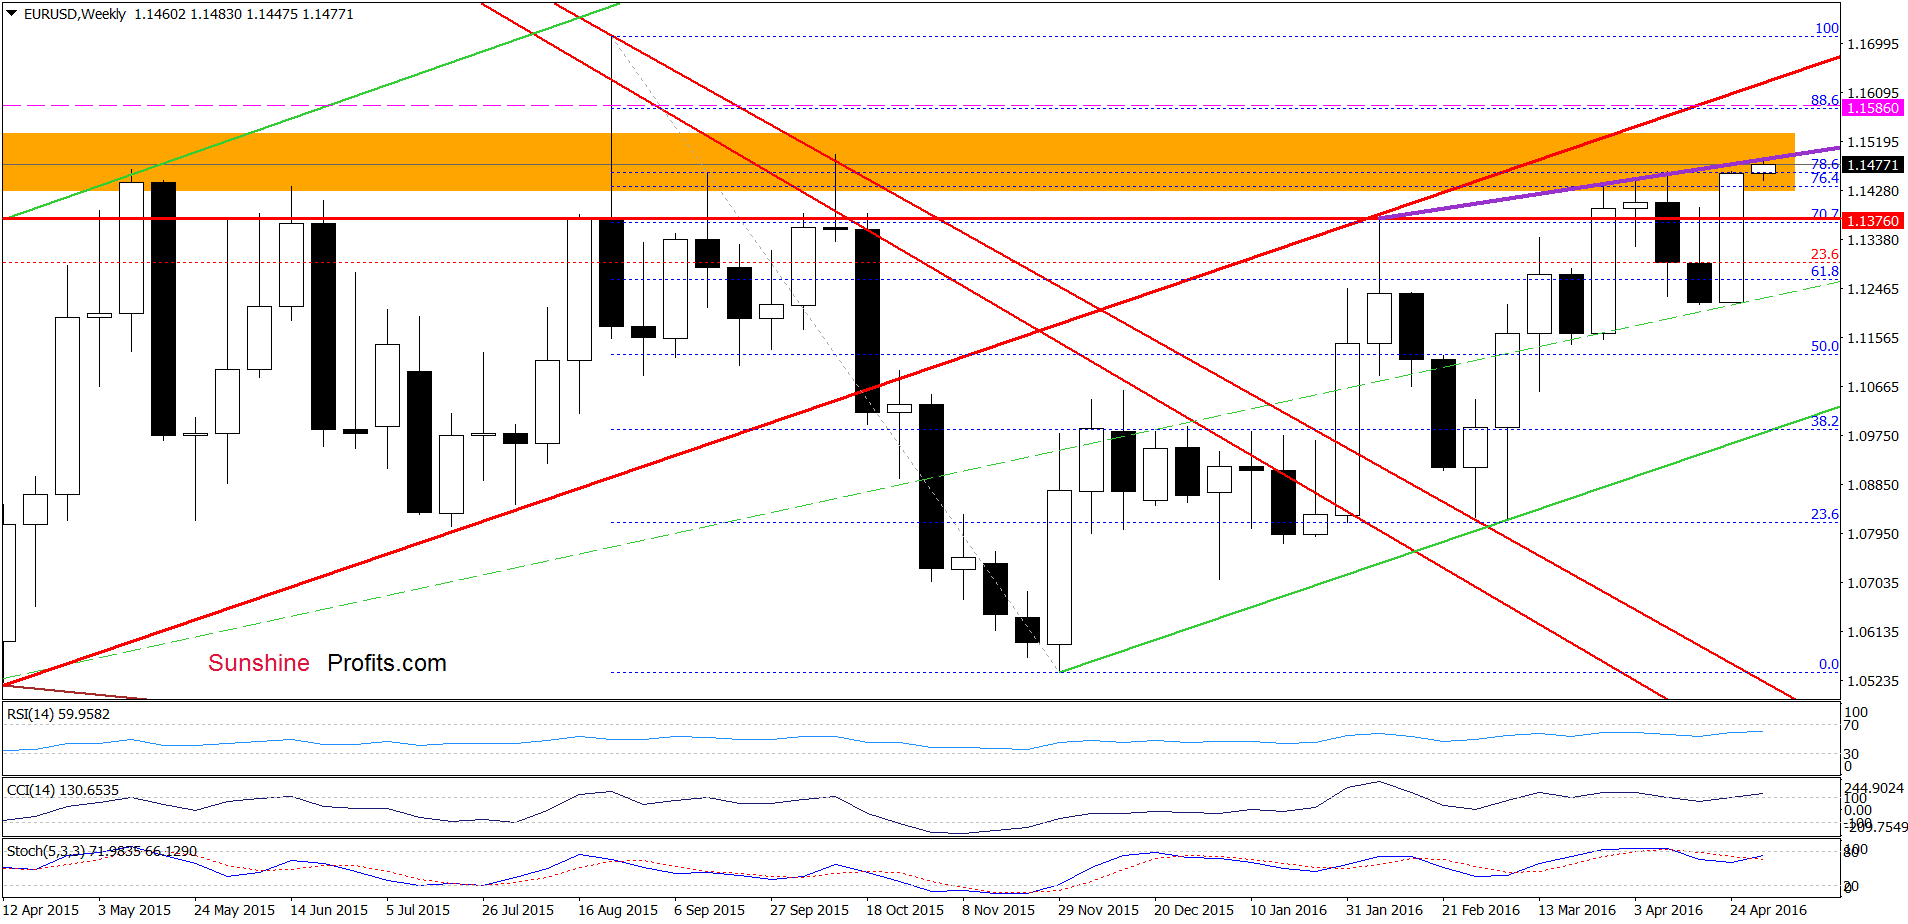
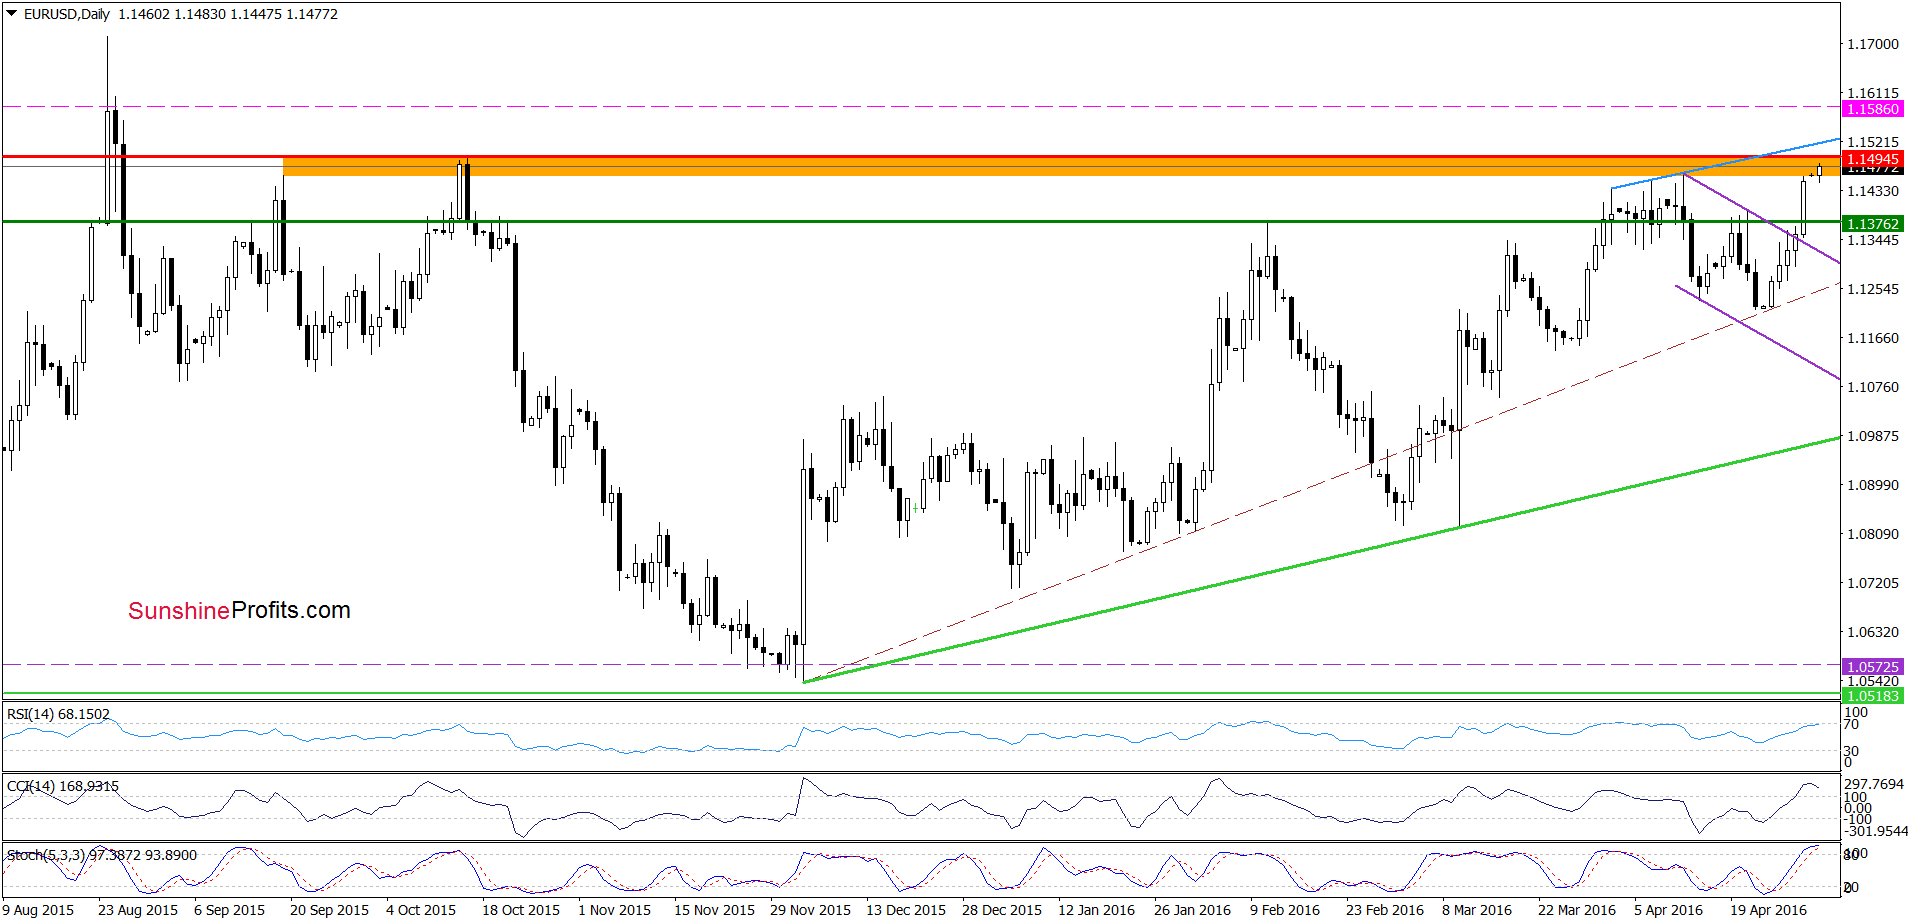
Looking at the above charts, we see that although EUR/USD hit a fresh high, the exchange rate climbed to solid resistance zone, which was strong enough to stop currency bulls in previous months. Additionally, the pair reached the purple line based on recent highs (marked on the weekly chart), which serves as an additional resistance at the moment. On top of that, daily indicators are overbought and very close to generating sell signals, which suggests that reversal in the coming day(s) is very likely.
This scenario is also reinforced by the current picture of the USD Index.
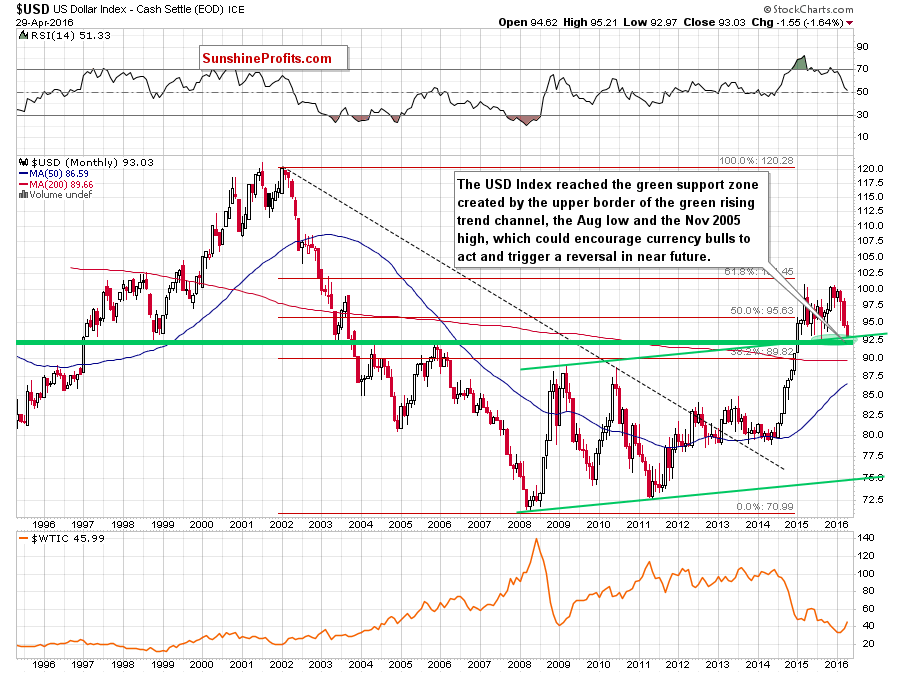
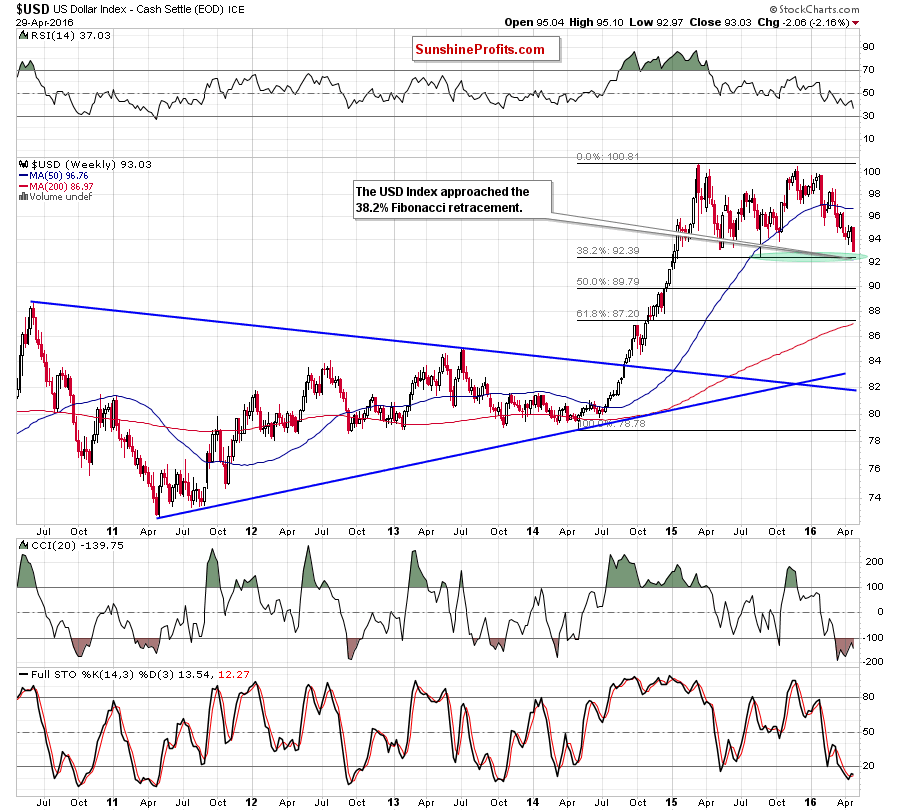
From the long- and medium-term perspective, we see that the USD Index extended losses and approached the green support zone created by the upper border of the long-term green rising trend channel, the Aug low, the Nov 2005 high and the 38.2% Fibonacci retracement (based on the May 2014-Mar 2015 rally). As you see on the charts, this solid support was strong enough to stop further declines in Aug, which suggests that we may see similar price action in the coming day(s). Additionally, the current position of the weekly indicators suggests that reversal is just around the corner. Taking all the above into account, we decided to move our stop-loss order to 1.1586.
Very short-term outlook: bearish
Short-term outlook: bearish
MT outlook: mixed with bearish bias
LT outlook: mixed
Trading position (short-term; our opinion): Short positions (with a stop-loss order at 1.1586 and the initial downside target at 1.0572) are justified from the risk/reward perspective. We will keep you informed should anything change, or should we see a confirmation/invalidation of the above.
GBP/USD
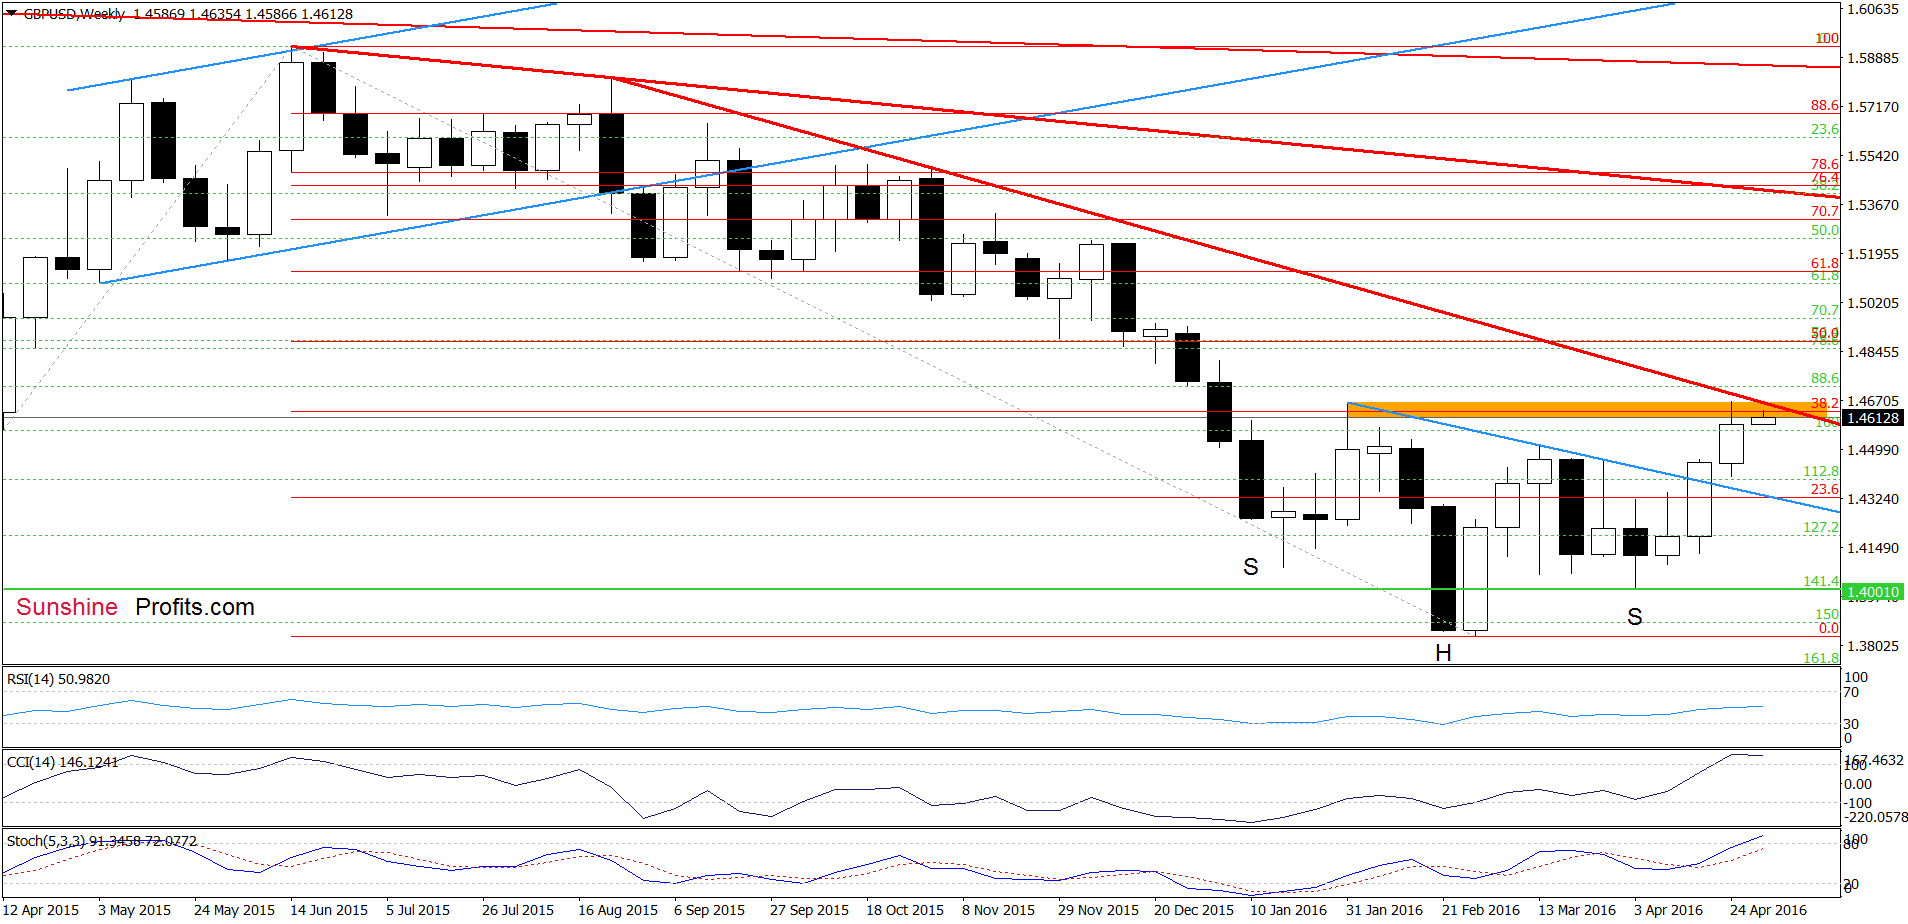
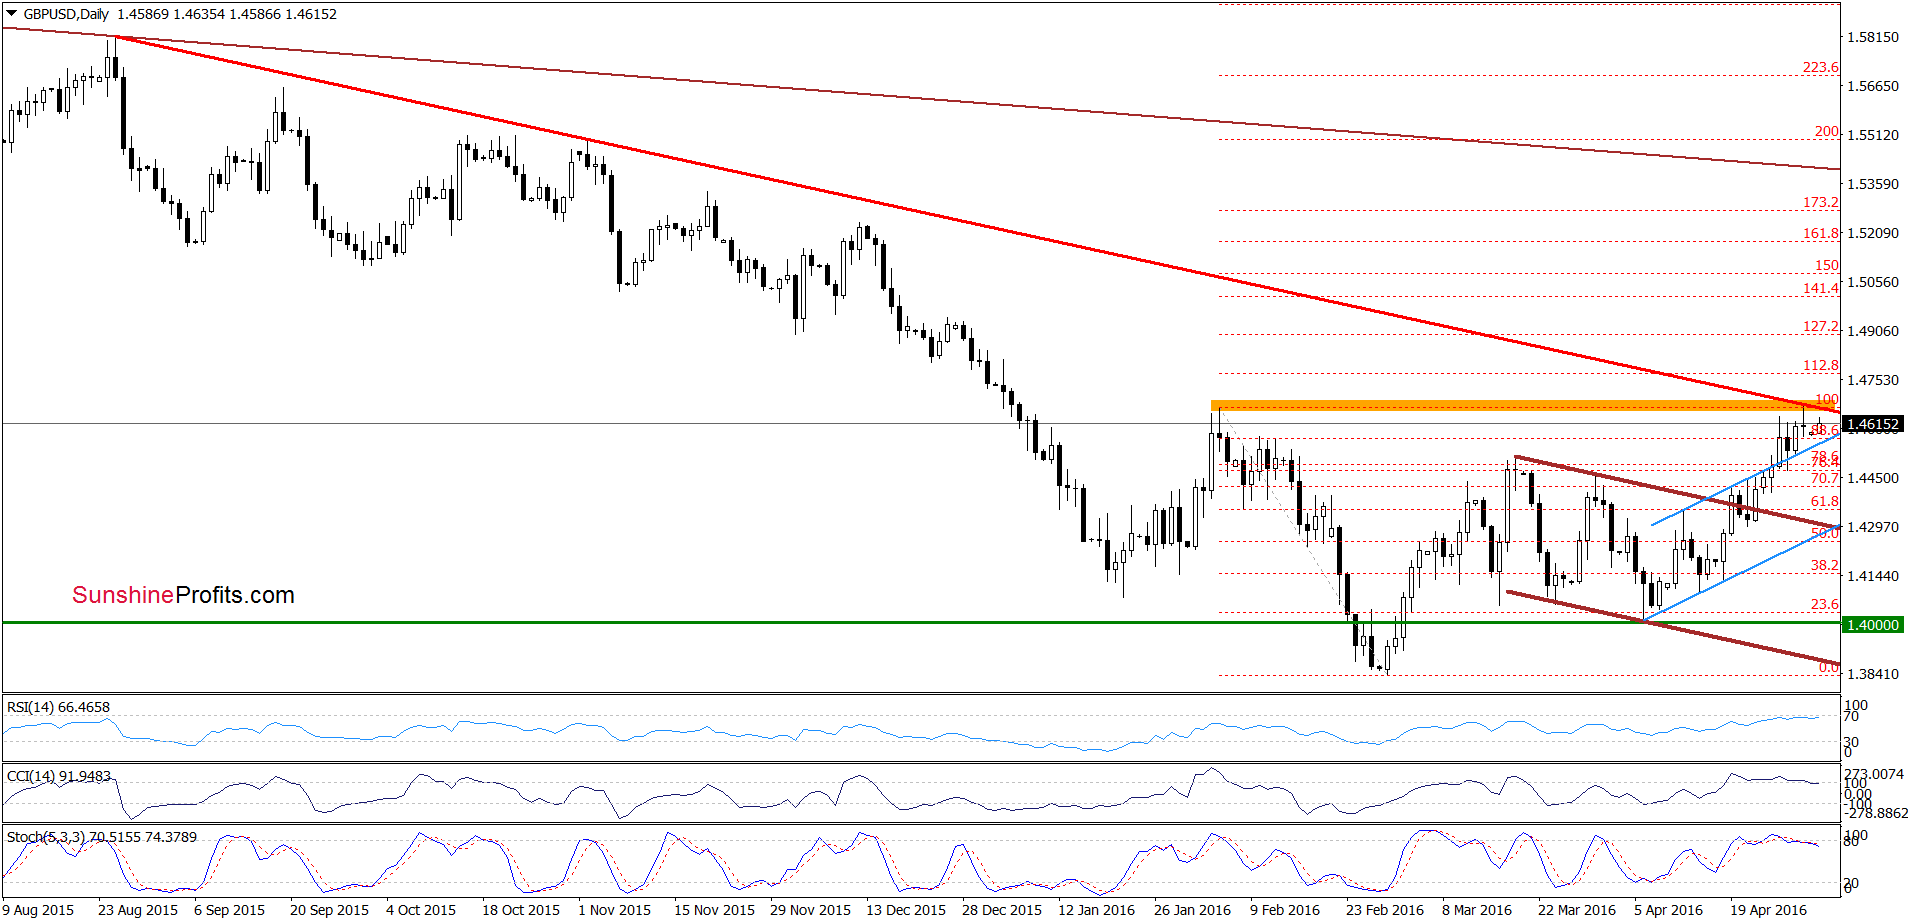
On the weekly chart, we see that currency bulls pushed GBP/USD above the neck line of the reverse head and shoulders formation (marked with blue), which resulted in further improvement. With recent upward move, the exchange rate increased to the orange resistance created by the long-term red declining resistance line, the 38.2% Fibonacci retracement (based on the entire mid-Jun-Feb downward move) and the Jan high, which could stop further rally in the coming week – especially when we factor in sell signals generated by the daily indicators. If this is the case and the pair declines from current levels, we’ll see a drop to the bottom of the recent pullback around 1.4471 in near future.
Very short-term outlook: mixed with bearish bias
Short-term outlook: mixed with bearish bias
MT outlook: mixed
LT outlook: mixed
Trading position (short-term; our opinion): No positions are justified from the risk/reward perspective at the moment. We will keep you informed should anything change, or should we see a confirmation/invalidation of the above.
USD/JPY
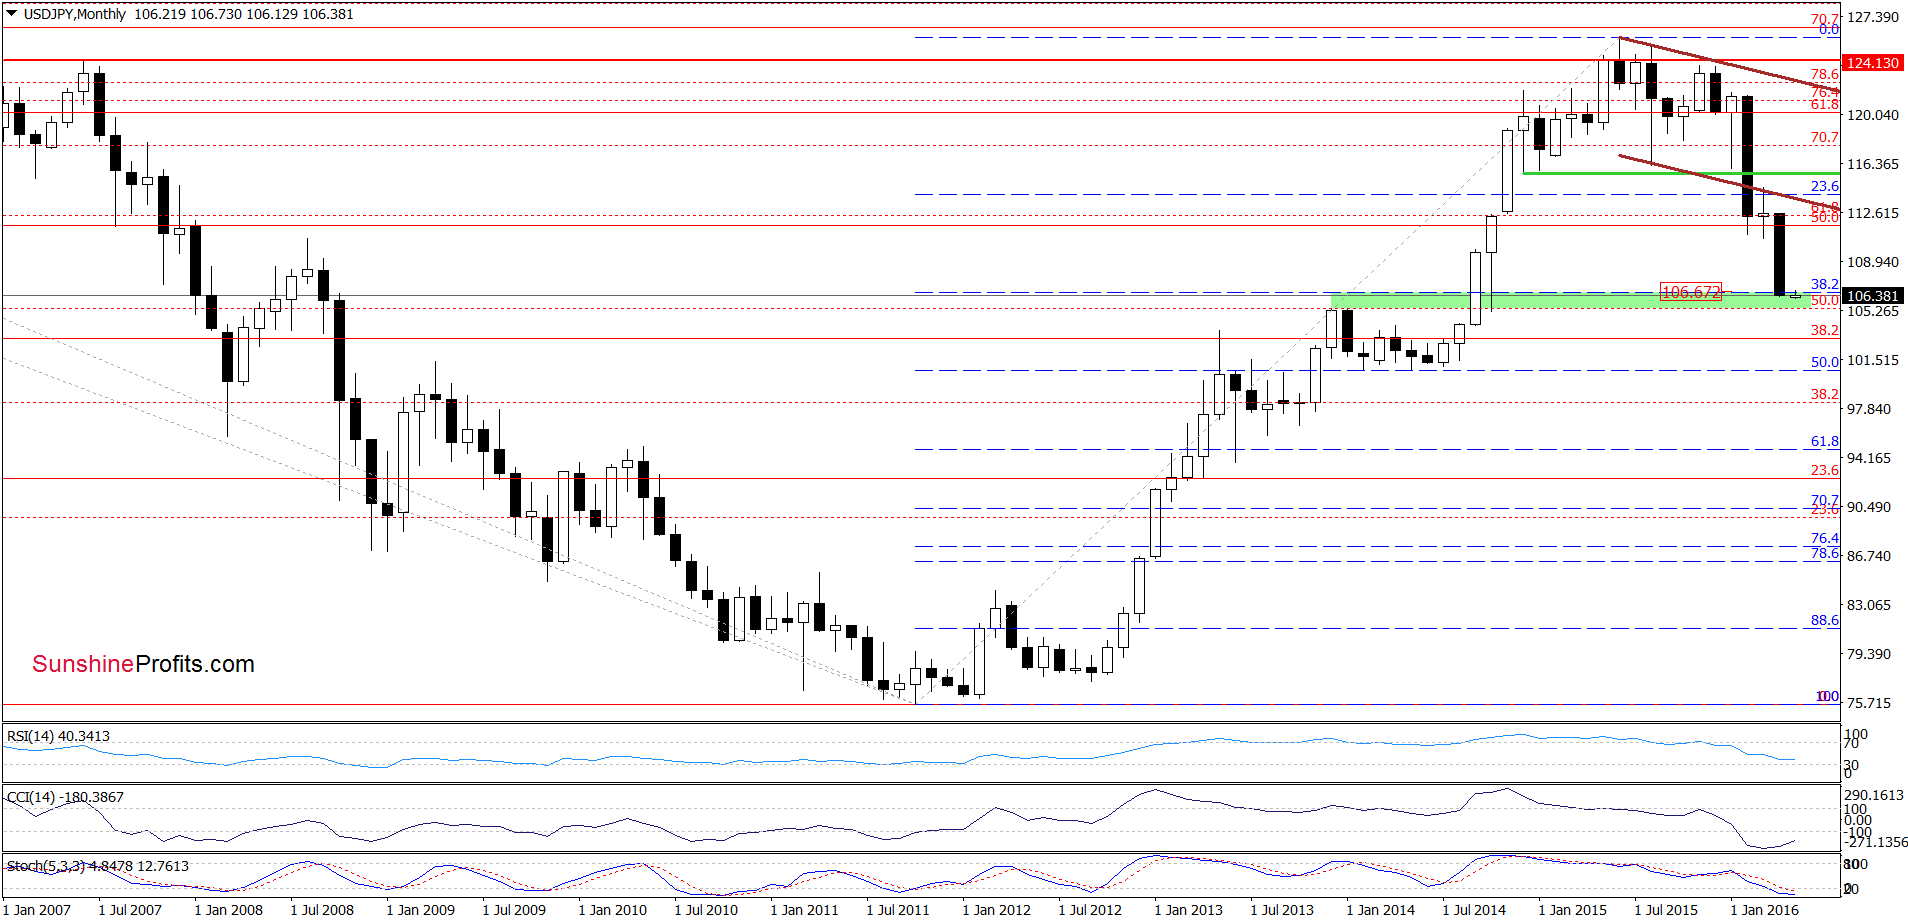
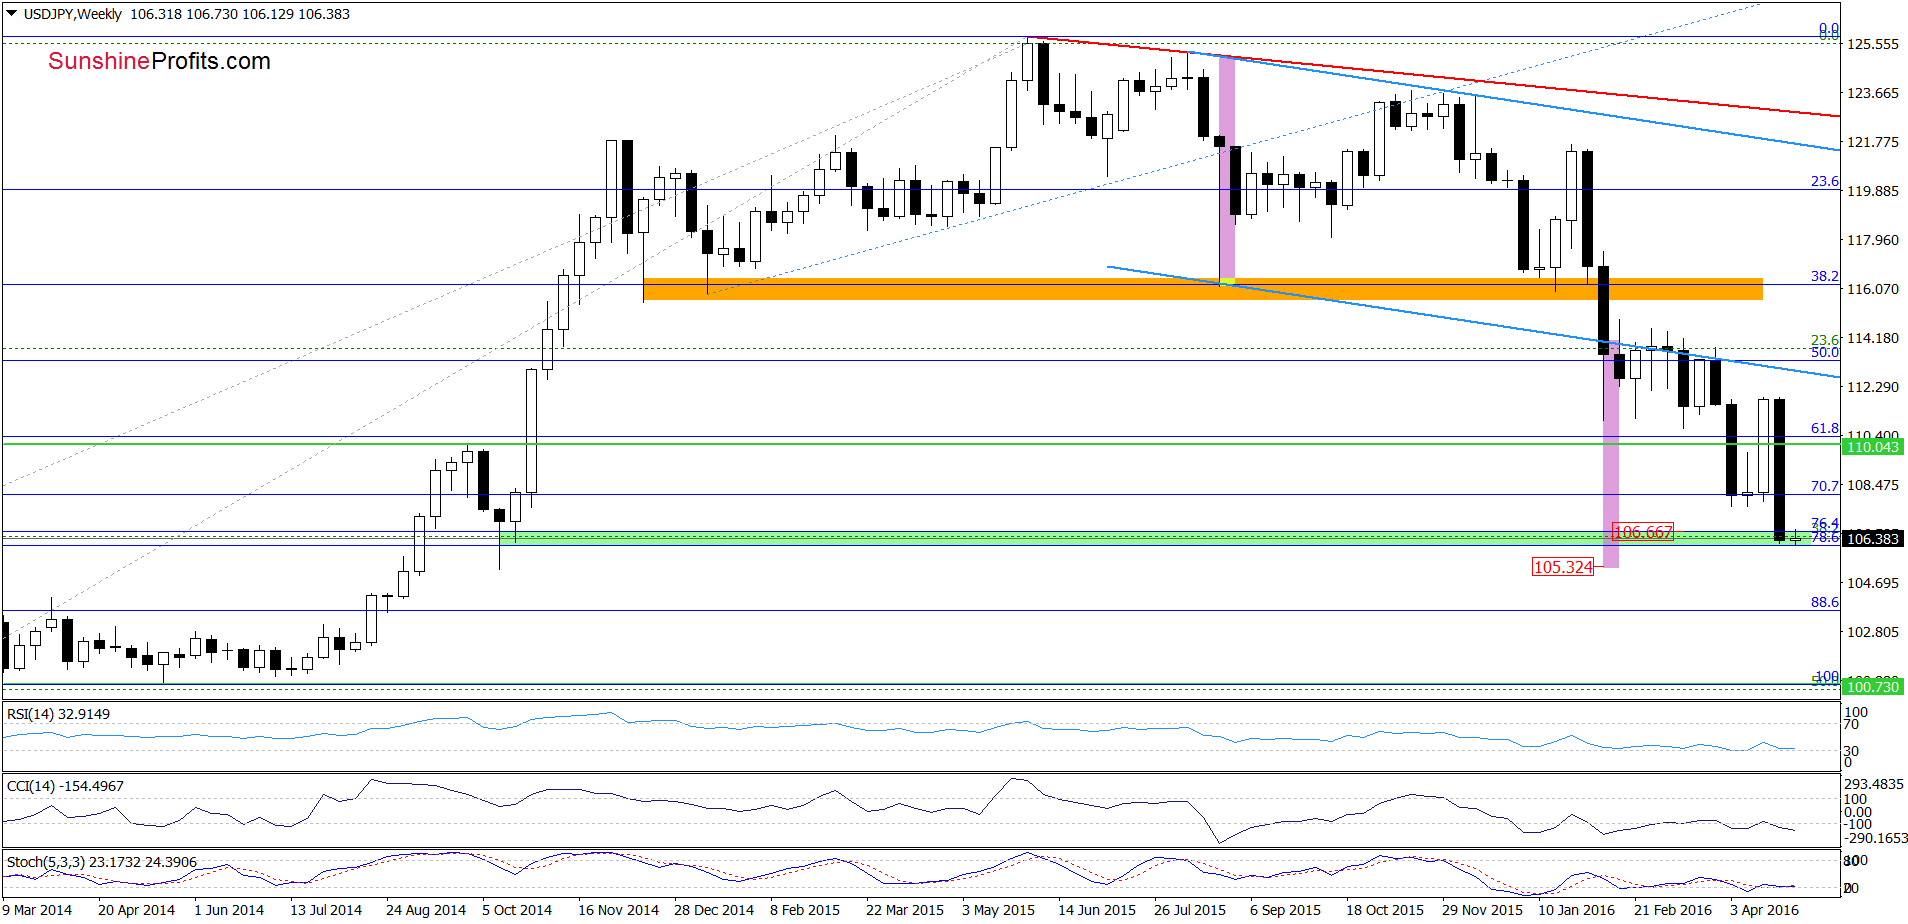
Quoting our previous commentary on this currency pair:
(…) the exchange rate approached the previous lows, which could encourage bulls to act. Nevertheless, the current position of the daily indicators suggests that further deterioration is more likely at the moment. How low could the pair go in the coming days?
(…) if the pair declines below the recent lows and the 70.7% Fibonacci retracement, well likely see a drop to around 106.66/106.67, where the upper border of the green support zone (created by the 76.4% and 78.6% Fibonacci retracement levels and marked on the weekly chart) and the 38.2% Fibonacci retracement (based on the entire Oct 2011-Jun 2015 upward move) are.
From today’s point of view, we see that the situation developed in line with the above scenario and USD/JPY reached the green support zone. Although the pair moved little lower earlier today, we think that the space for further declines may be limited. Why? As you see on the weekly chart, not far from current levels (around 105.40-105.42) are Dec 2013 and Jan 2014 highs, which serve as support. Additionally, around 105.32 the size of the downward move will correspond to the height of the blue declining trend channel (marked on the weekly chart), which could wane the selling pressure in the coming week. Therefore, in our opinion, as long as there won’t be a comeback above the green zone (seen on the weekly chart) another downswing can’t be ruled out.
Very short-term outlook: mixed
Short-term outlook: mixed
MT outlook: mixed
LT outlook: mixed
Trading position (short-term; our opinion): No positions are justified from the risk/reward perspective at the moment. We will keep you informed should anything change, or should we see a confirmation/invalidation of the above.
USD/CAD
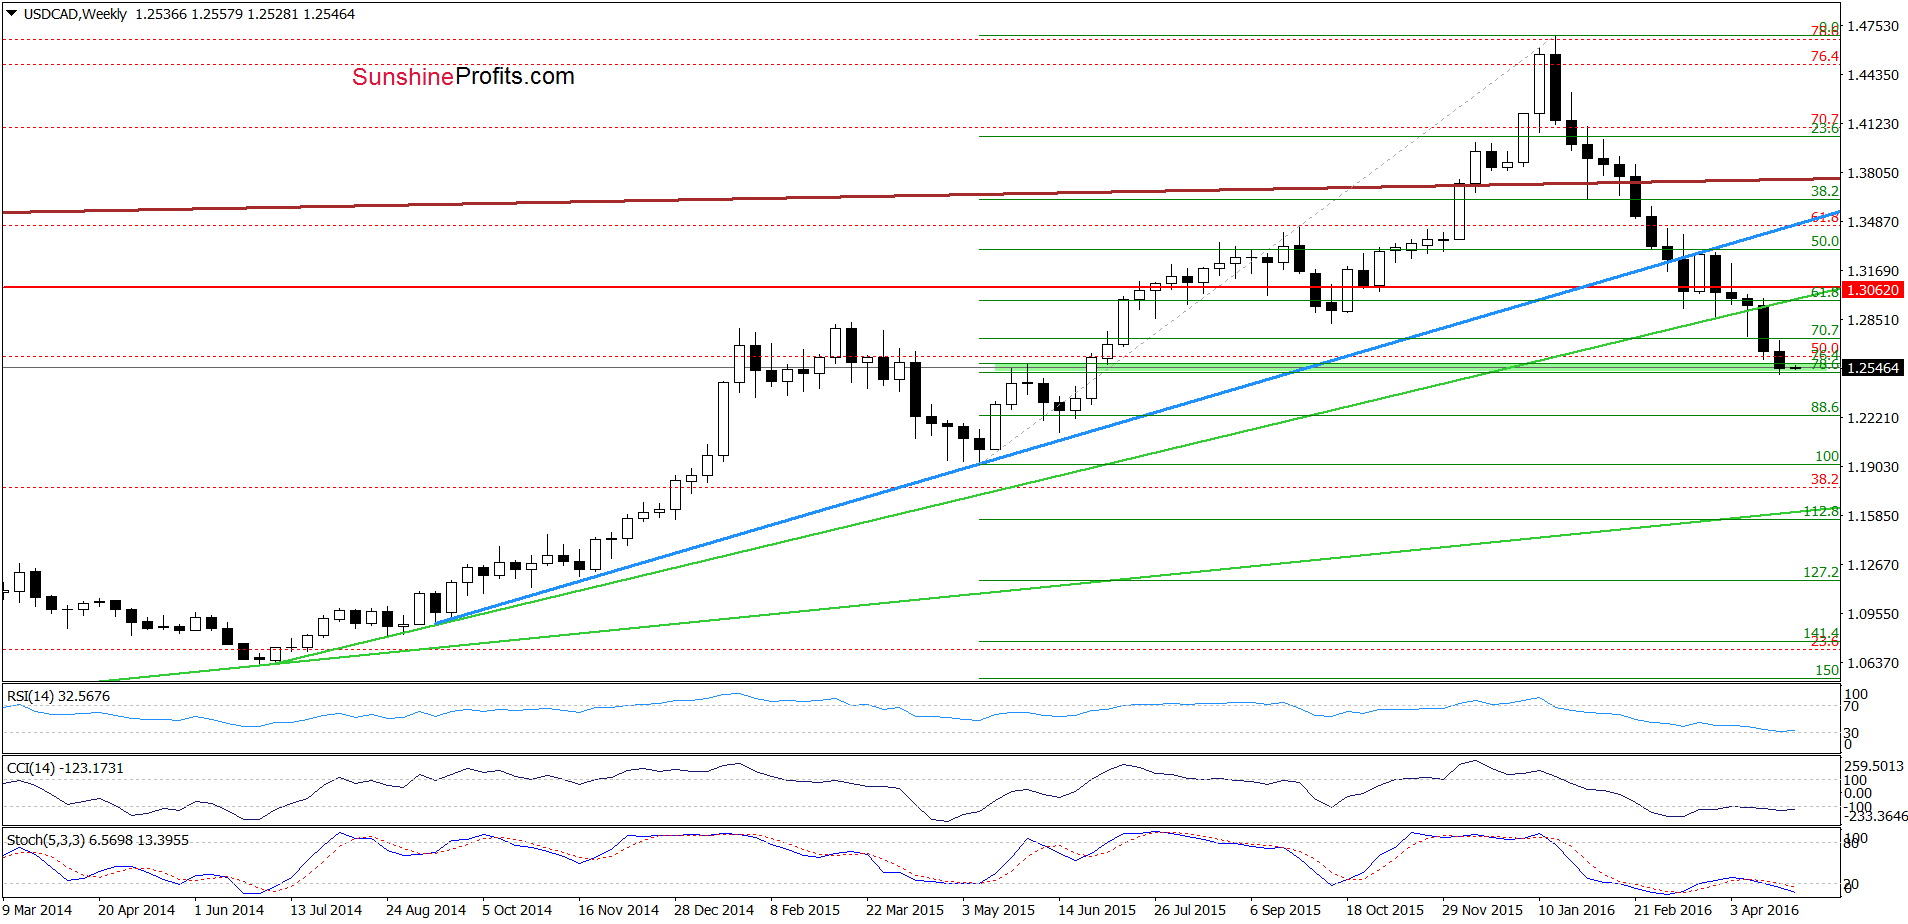
Looking at USD/CAD from the medium-term perspective, we see that the exchange rate reached the green support zone (created by the 76.4% and 78.6% Fibonacci retracement levels), which suggests that reversal in the coming week is very likely – especially when we factor in the current picture of crude oil, which reached important resistance zone.
Very short-term outlook: mixed
Short-term outlook: mixed with bullish bias
MT outlook: mixed
LT outlook: mixed
Trading position (short-term; our opinion): No positions are justified from the risk/reward perspective at the moment. We will keep you informed should anything change, or should we see a confirmation/invalidation of the above.
USD/CHF
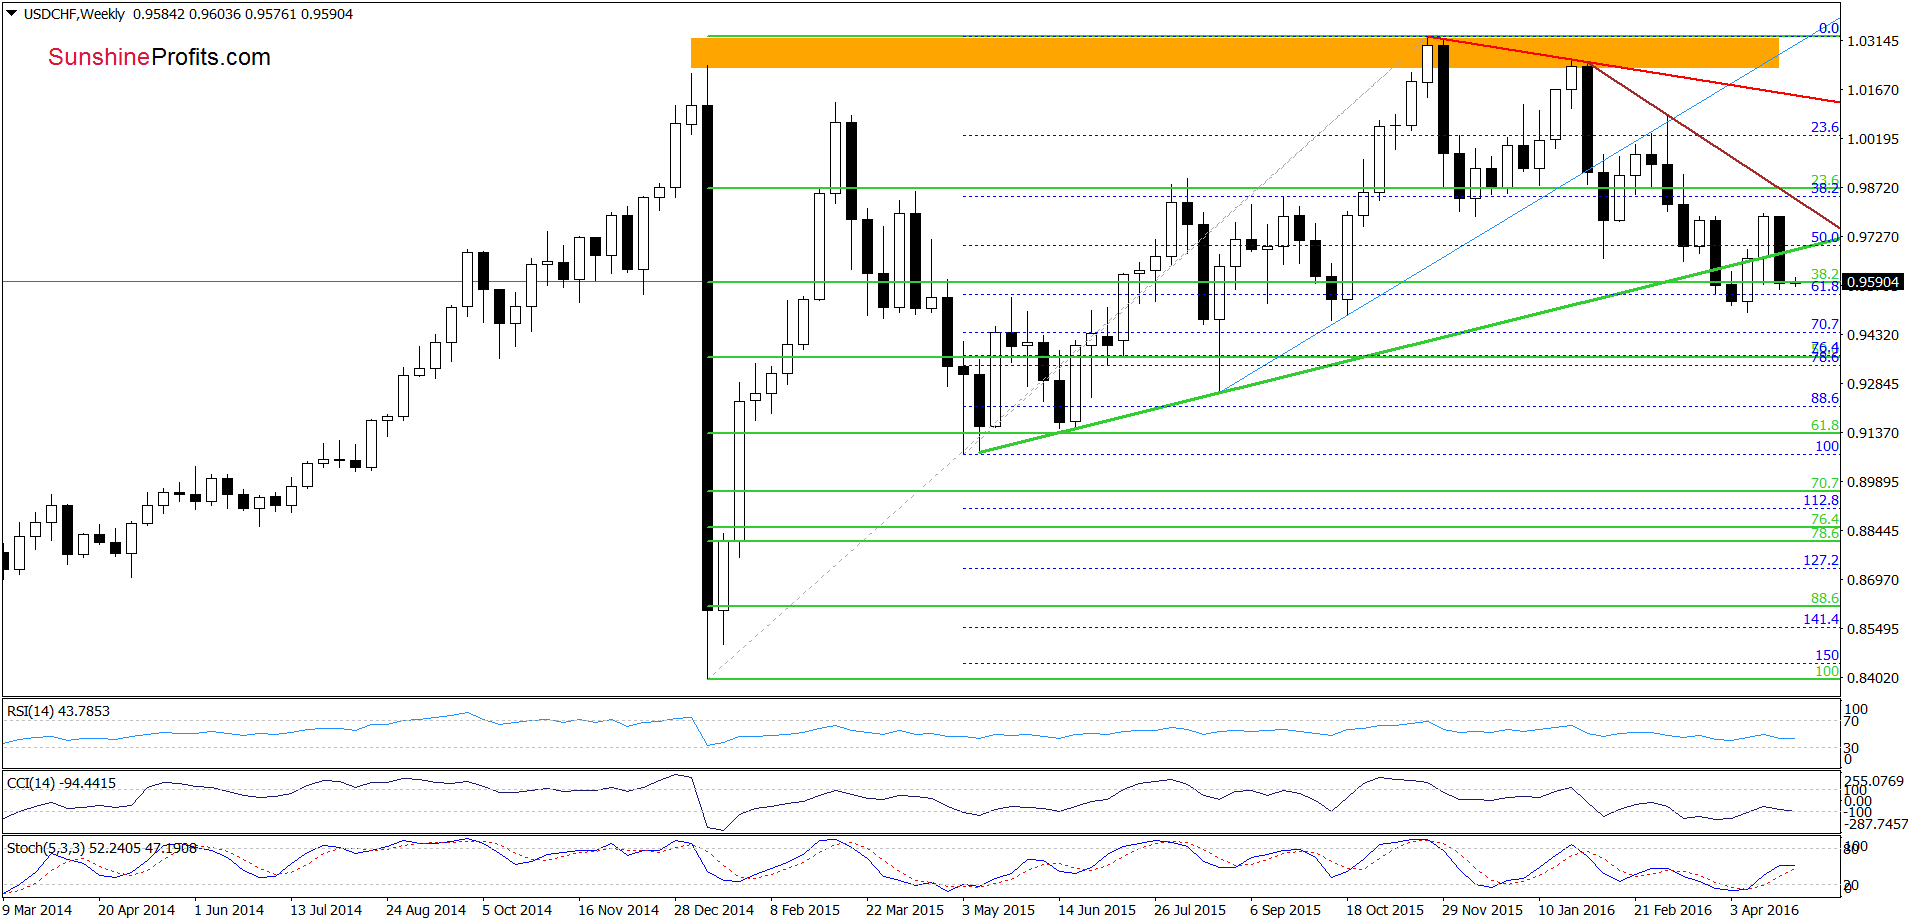
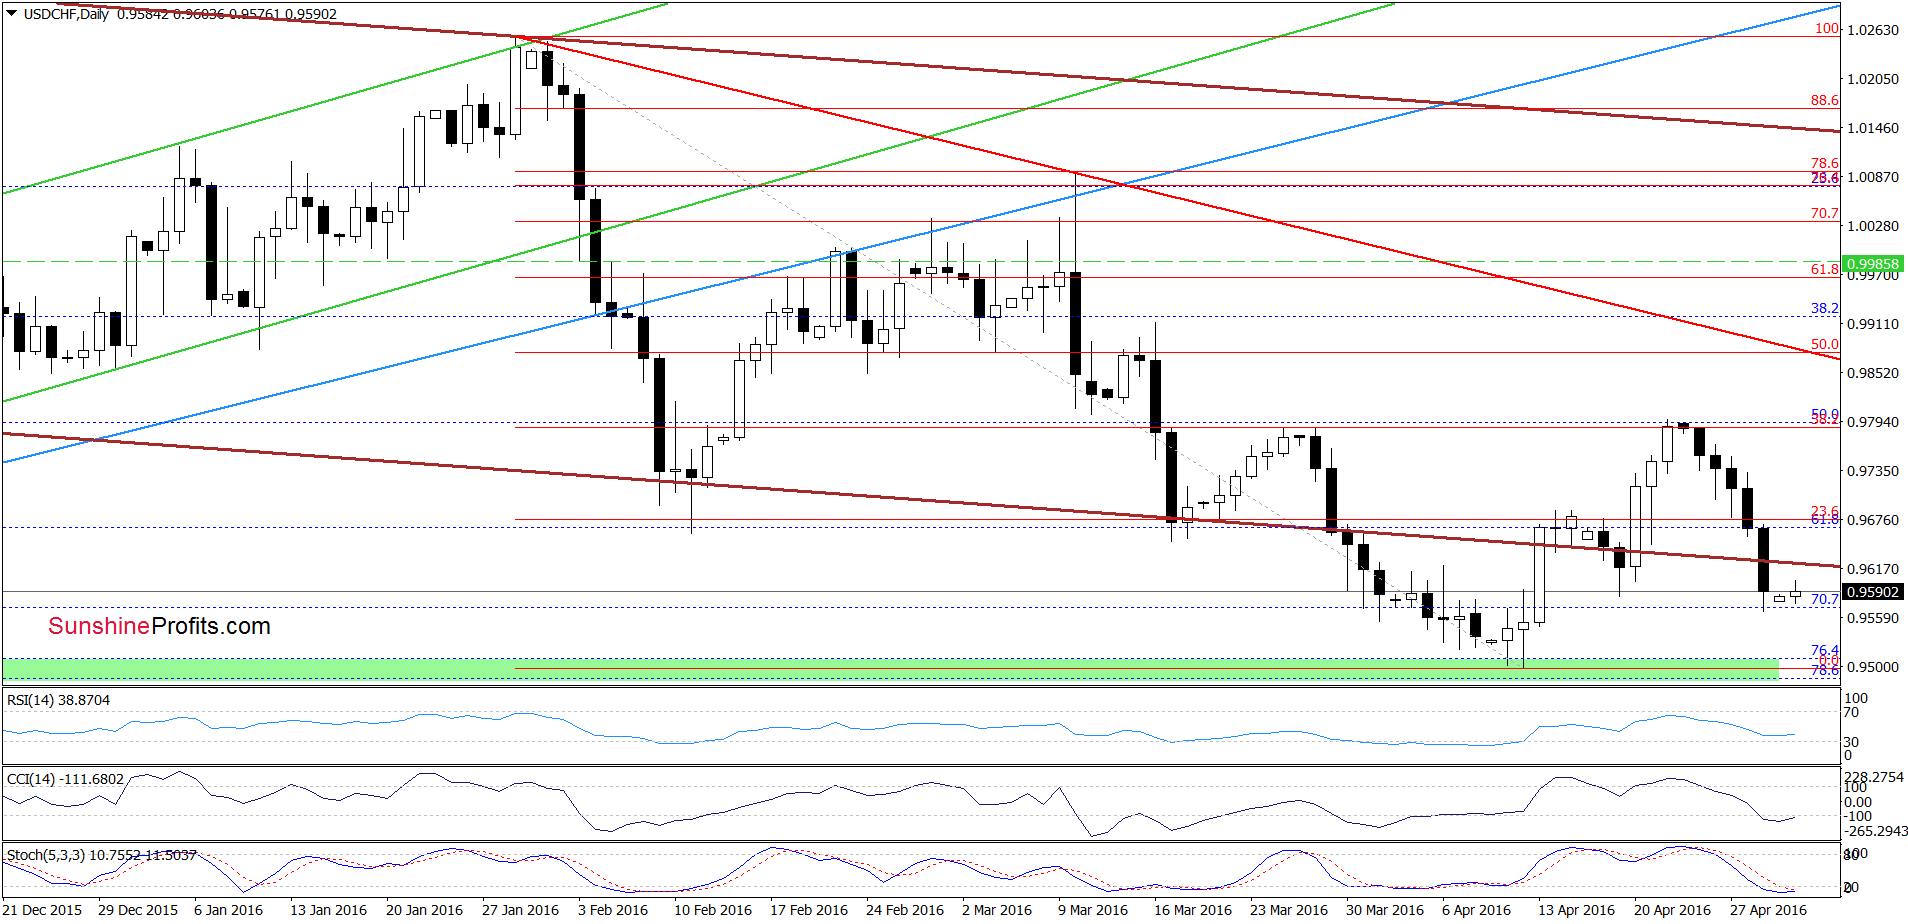
On the above charts, we see that although USD/CHF moved little higher earlier today, the pair is still trading under the previously-broken medium-term green line and the lower border of the brown declining trend channel. Additionally, there are no buy signals that could encourage currency bulls to act, which suggests that what we wrote in our previous commentary on this currency pair remains up-to-date:
(…) sell signals are still in play, which in combination with the medium-term picture suggests further deterioration. If this is the case (…) we’ll likely see a re-test of the green support zone (created by the 76.4% and 78.6% Fibonacci retracements and recent lows) in the coming week.
Very short-term outlook: mixed with bearish bias
Short-term outlook: mixed
MT outlook: mixed
LT outlook: mixed
Trading position (short-term; our opinion): No positions are justified from the risk/reward perspective. We will keep you informed should anything change, or should we see a confirmation/invalidation of the above.
AUD/USD
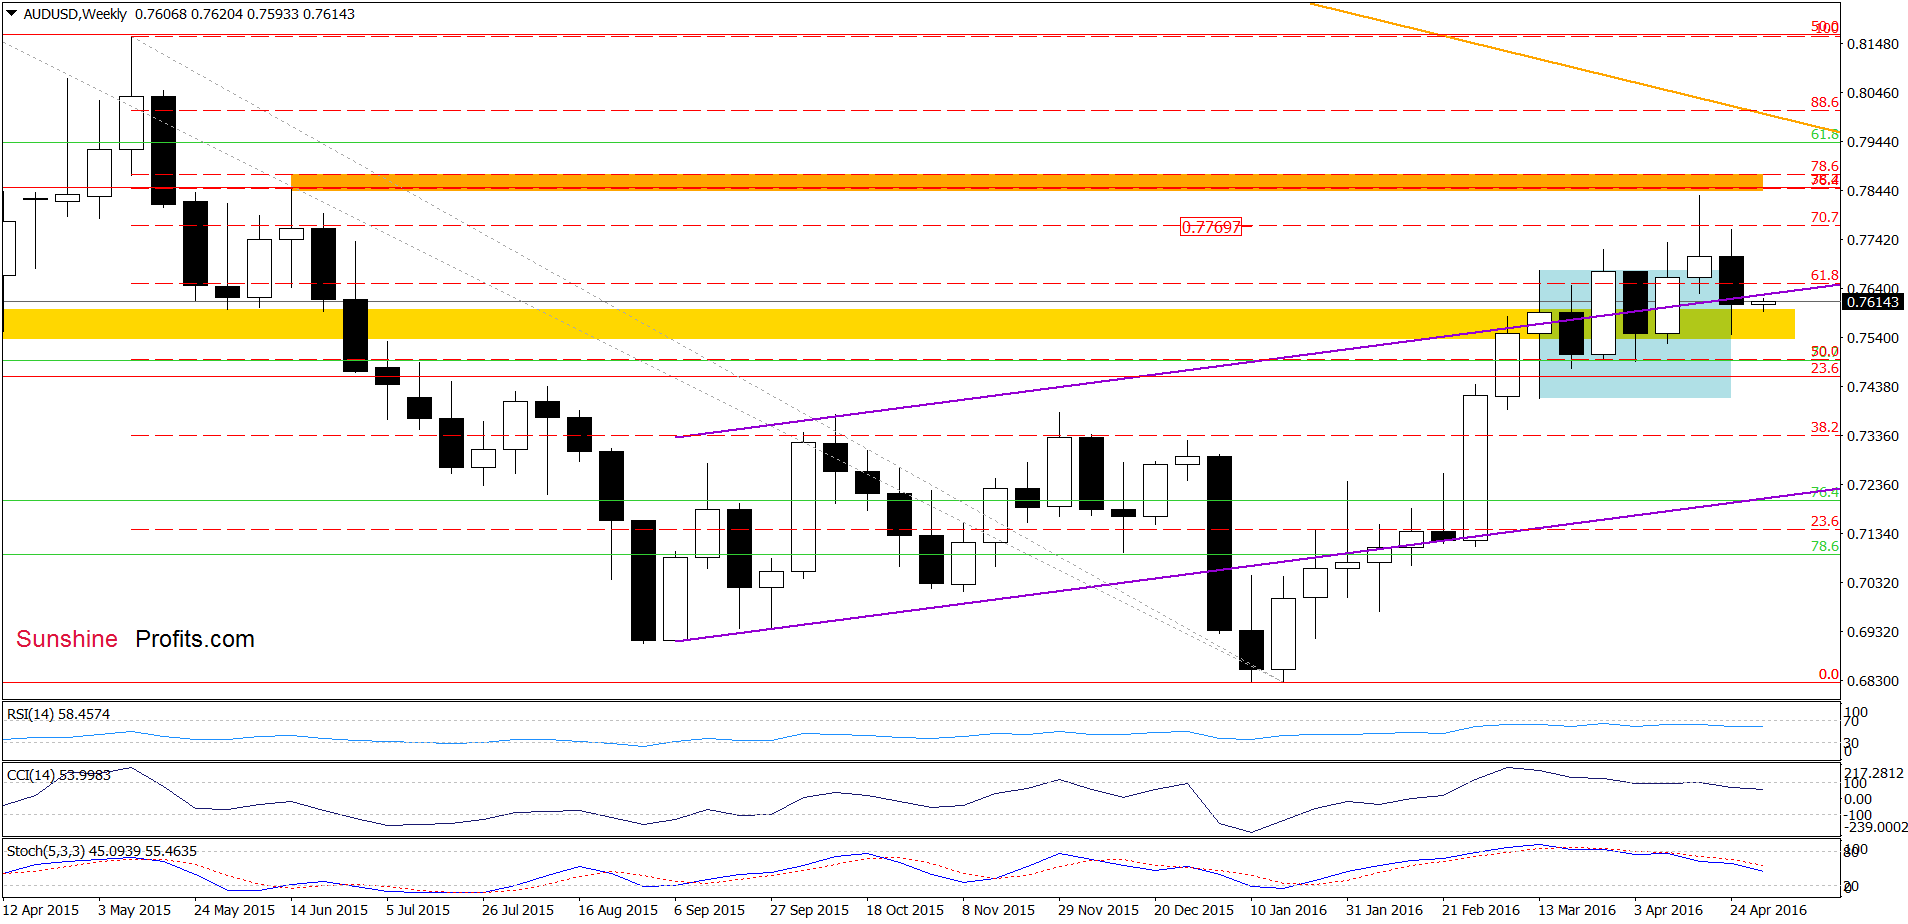
On the weekly chart, we see that AUD/USD closed the week under the previously-broken upper border of the rising purple trend channel, invalidating earlier breakout, which is a negative signal that suggests further deterioration – especially when we factor in sell signals generated by the indicators.
Are there any factors that could hinder the realization of the above scenario? Let’s examine the daily chart and find out.
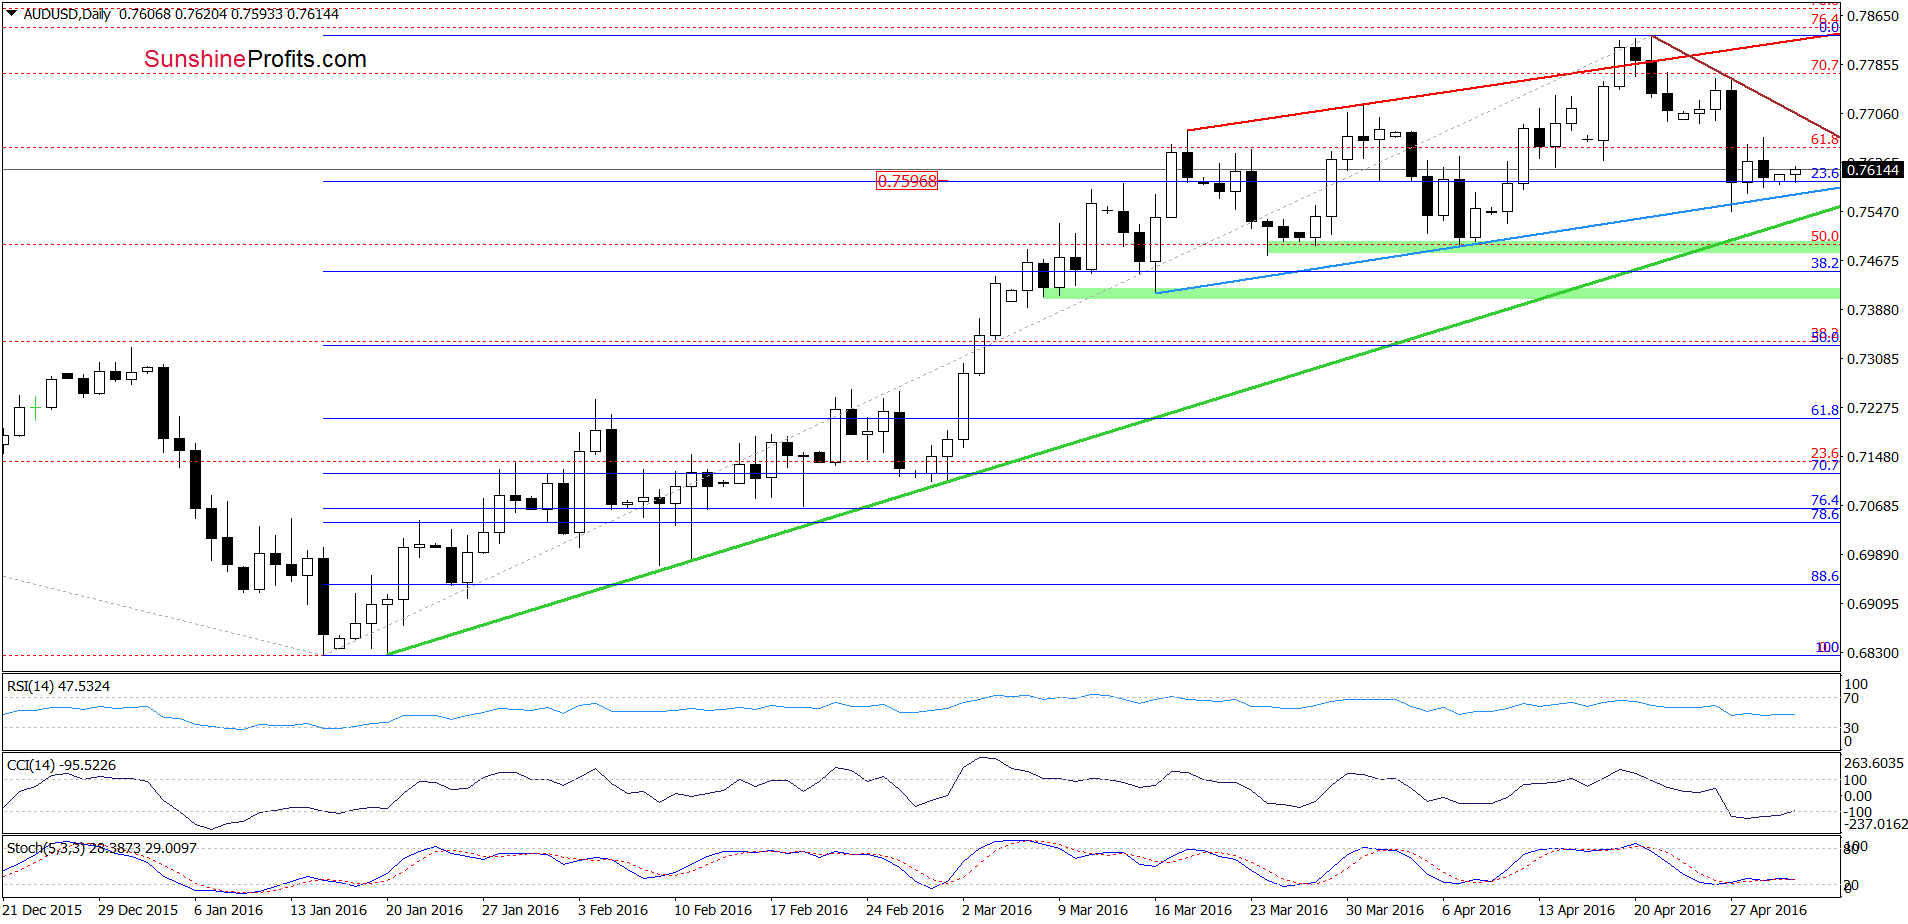
From this perspective, we see that the very short-term picture hasn’t changed much in recent days as AUD/USD is trading around the 23.6% Fibonacci retracement level. Additionally, this area is supported by the blue rising line, which stopped currency bears in the previous week. Taking the above into account and combining it with the current position of the indicators, it seems to us that currency bulls will try to push the pair to the brown declining resistance line (based on previous highs) in the coming days.
Very short-term outlook: mixed
Short-term outlook: mixed
MT outlook: mixed
LT outlook: mixed
Trading position (short-term; our opinion): No positions are justified from the risk/reward perspective. We will keep you informed should anything change, or should we see a confirmation/invalidation of the above.
Thank you.
Nadia Simmons
Forex & Oil Trading Strategist
Przemyslaw Radomski, CFA
Founder, Editor-in-chief
Gold & Silver Trading Alerts
Forex Trading Alerts
Oil Investment Updates
Oil Trading Alerts

