

Although the world's largest oil-producing countries met this weekend, they failed to reach a deal to freeze output at Jan levels. As a result, crude oil moved lower, which pushed the U.S. dollar higher against its Canadian counterpart. What happened at the same time with other currency pairs?
In our opinion the following forex trading positions are justified - summary:
- EUR/USD: short (stop-loss order at 1.1512; initial downside target at 1.0572)
- GBP/USD: none
- USD/JPY: none
- USD/CAD: none
- USD/CHF: none
- AUD/USD: none
EUR/USD
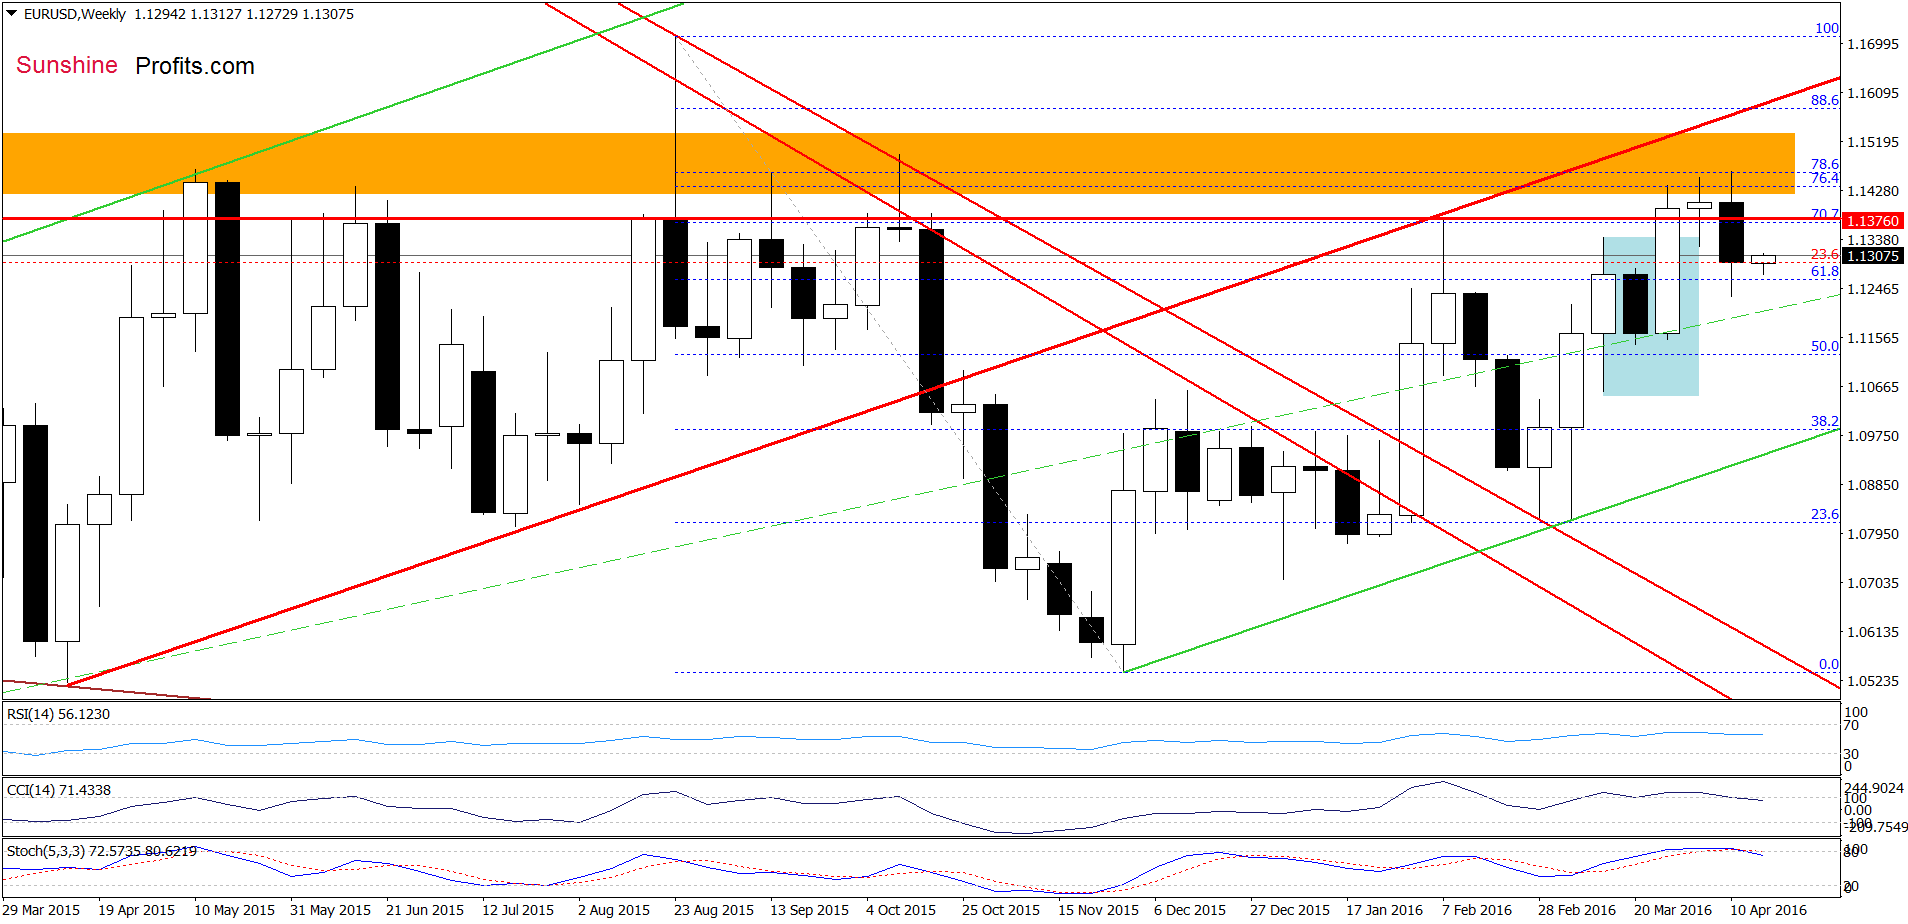
On the weekly chart, we see that EUR/USD remains under the orange resistance zone and the Feb high, which means that what we wrote last Tuesday is up-to-date:
(…) the (…) key resistance zone stopped currency bulls once again, triggering a pullback. With this drop the exchange rate slipped under the Feb high, invalidating earlier breakout, which is a negative signal that suggests further deterioration. Additionally, the CCI and Stochastic Oscillator are very close to generating sell signals, which increases the probability of further declines.
Having said the above, let’s examine the very short-term picture.
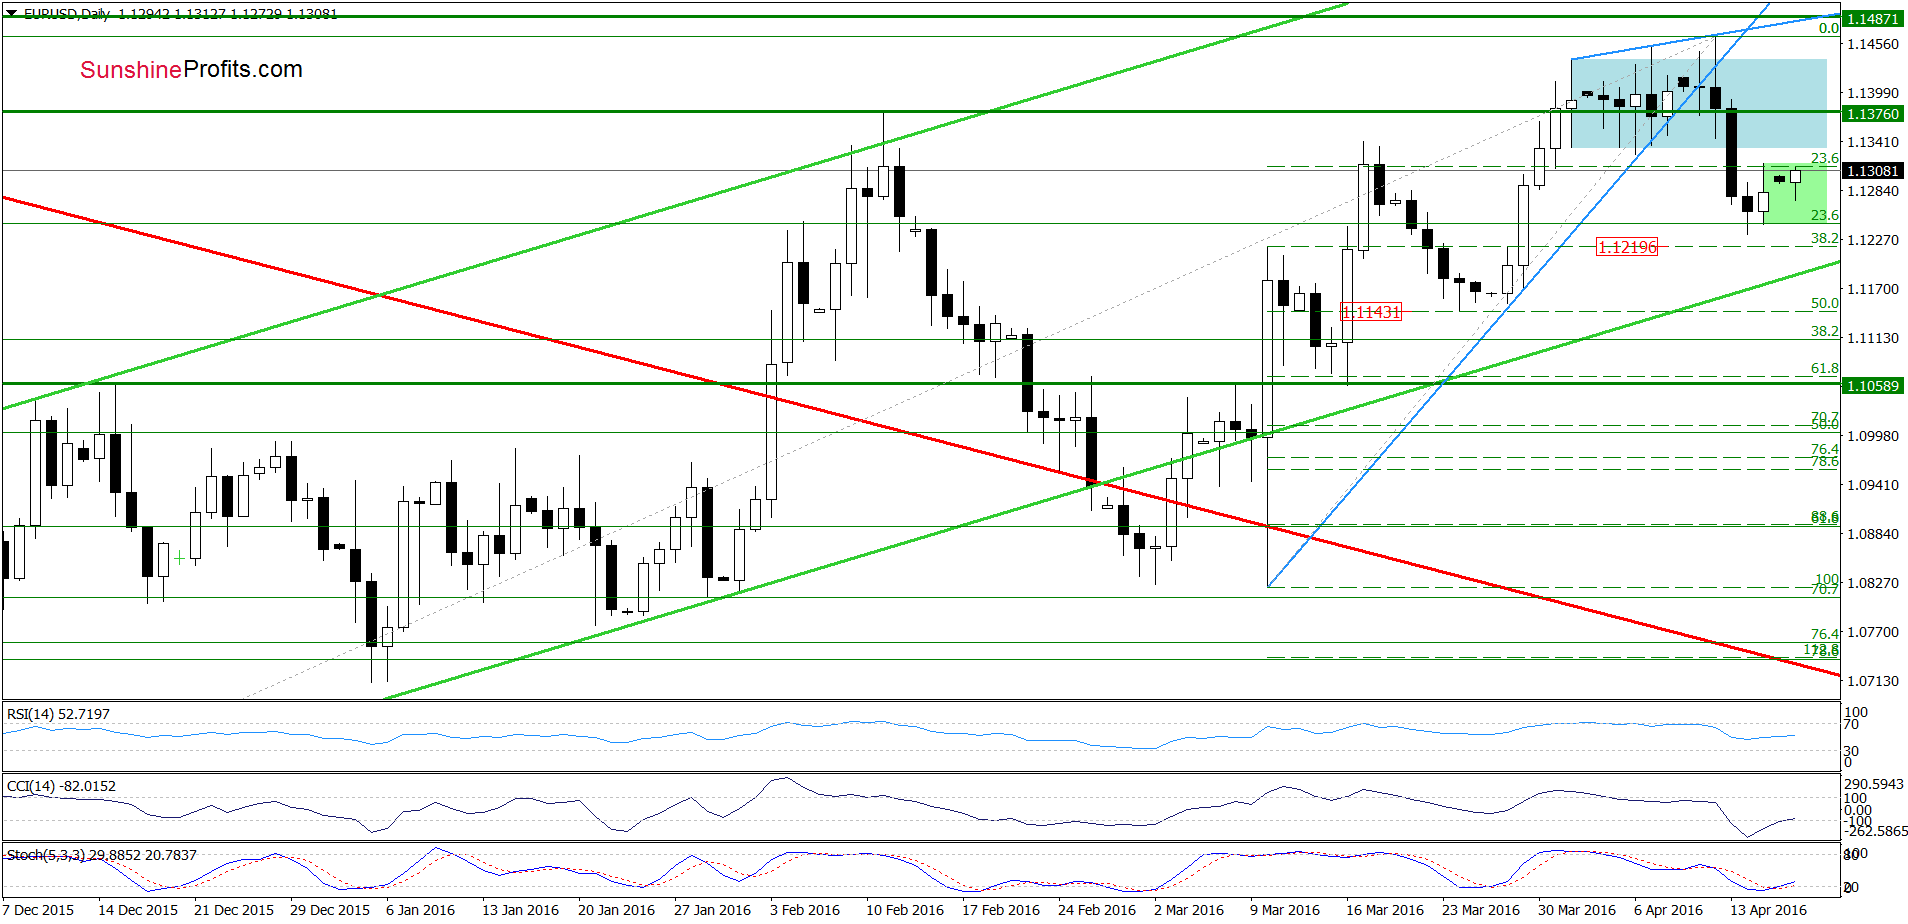
From today’s point of view, we see that the proximity to the 38.2% Fibonacci retracement triggered a rebound in recent days. Despite this move, the exchange rate is still trading under the lower border of the blue consolidation and the Feb high, which means that an invalidation of earlier breakout above this level and its negative impact on EUR/USD s still in effect. Therefore, in our opinion, lower values of the pair are just a matter of time. If this is the case and the exchange rate declines once again, we’ll see a test of last week’s low. If it is broken, the next downside target would be around 1.1143-1.1163, where the support zone created by the late-March lows and the 50% retracement is.
Very short-term outlook: bearish
Short-term outlook: bearish
MT outlook: mixed with bearish bias
LT outlook: mixed
Trading position (short-term; our opinion): Short positions (with a stop-loss order at 1.1512 and the initial downside target at 1.0572) are justified from the risk/reward perspective. We will keep you informed should anything change, or should we see a confirmation/invalidation of the above.
GBP/USD
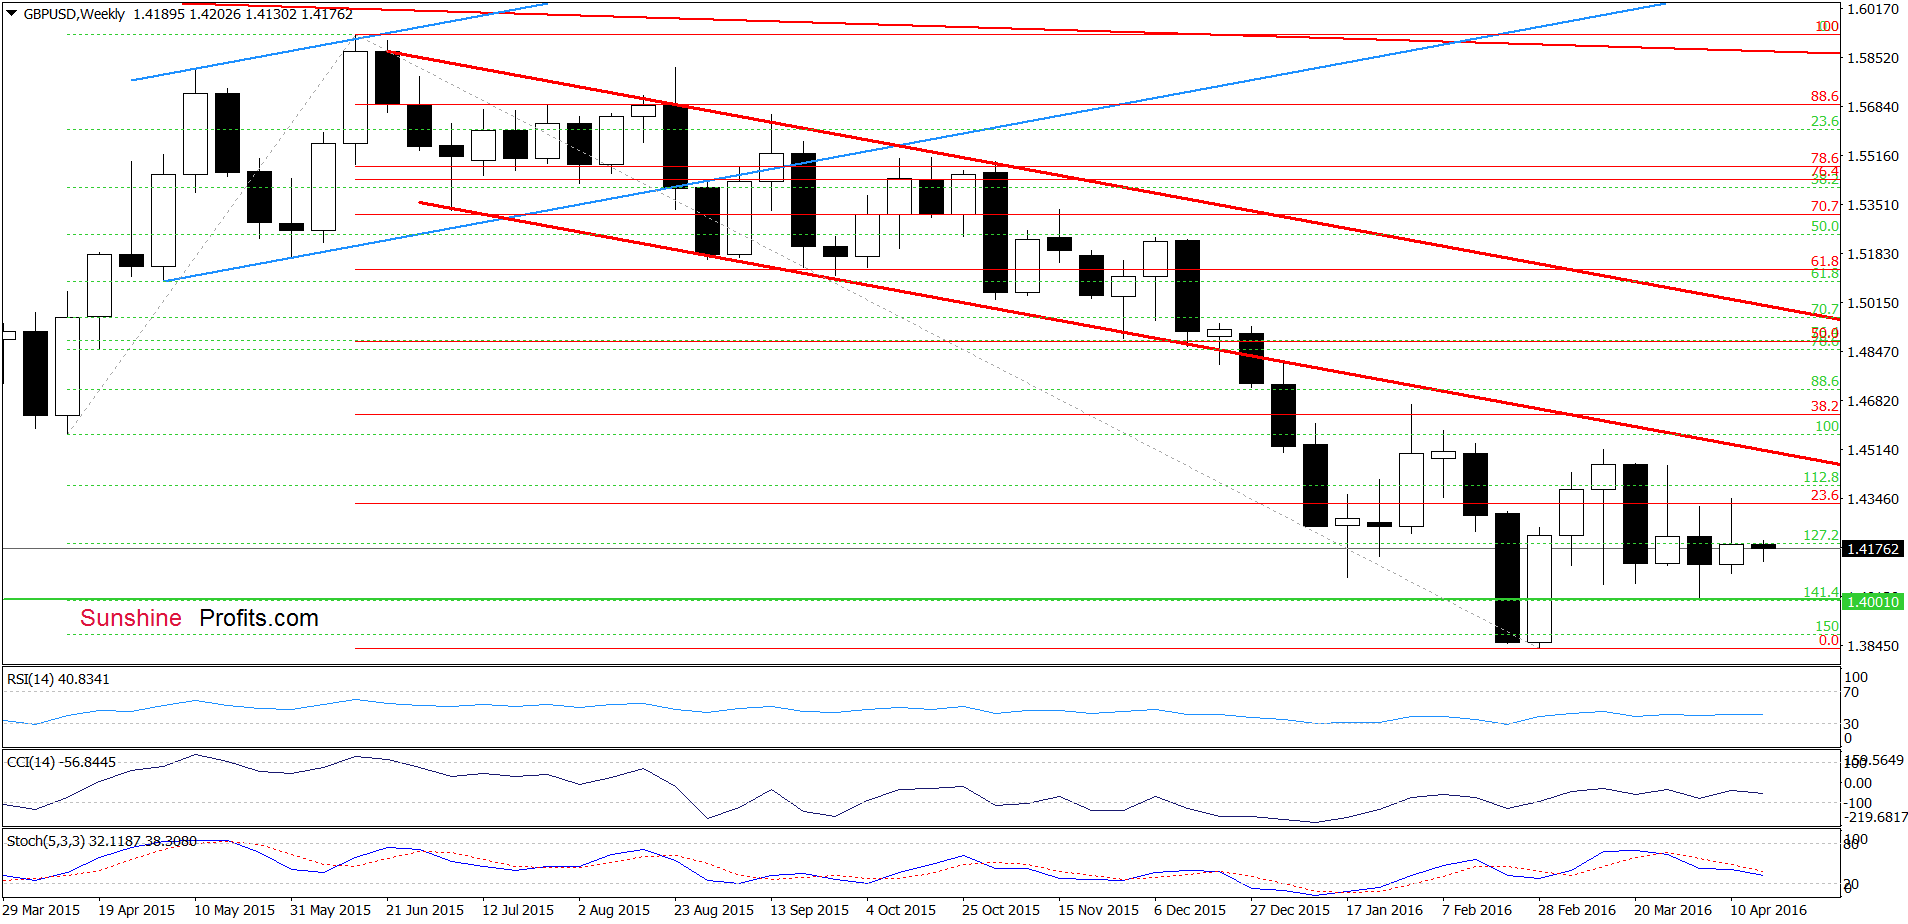
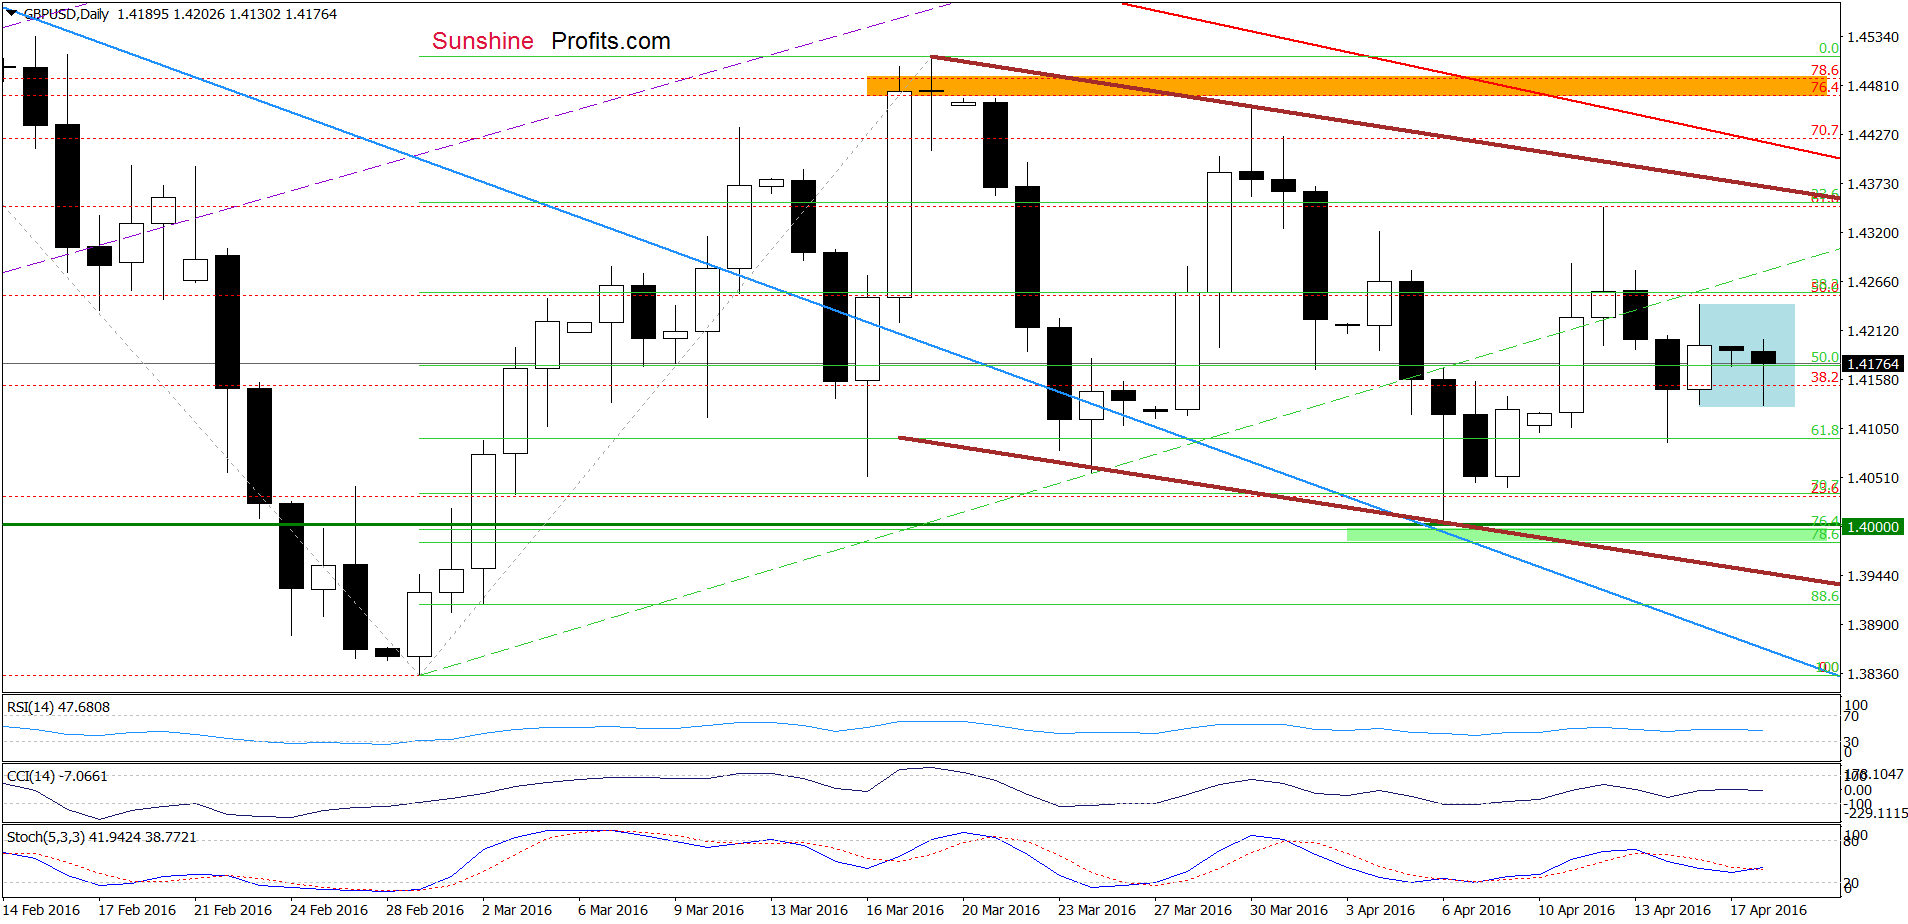
Looking at the above charts, we see that the overall situation hasn’t changed much as GBP/USD is consolidating under the previously-broken green dashed line, which serves as the nearest resistance. Although the Stochastic Oscillator generated a buy signal, suggesting further improvement (and a test of the upper border of the consolidation), we think that as long as there won’t be invalidation of the breakdown under the above-mentioned resistance line another bigger upward move is not likely to be seen.
Very short-term outlook: mixed
Short-term outlook: mixed
MT outlook: mixed
LT outlook: mixed
Trading position (short-term; our opinion): No positions are justified from the risk/reward perspective at the moment. We will keep you informed should anything change, or should we see a confirmation/invalidation of the above.
USD/JPY
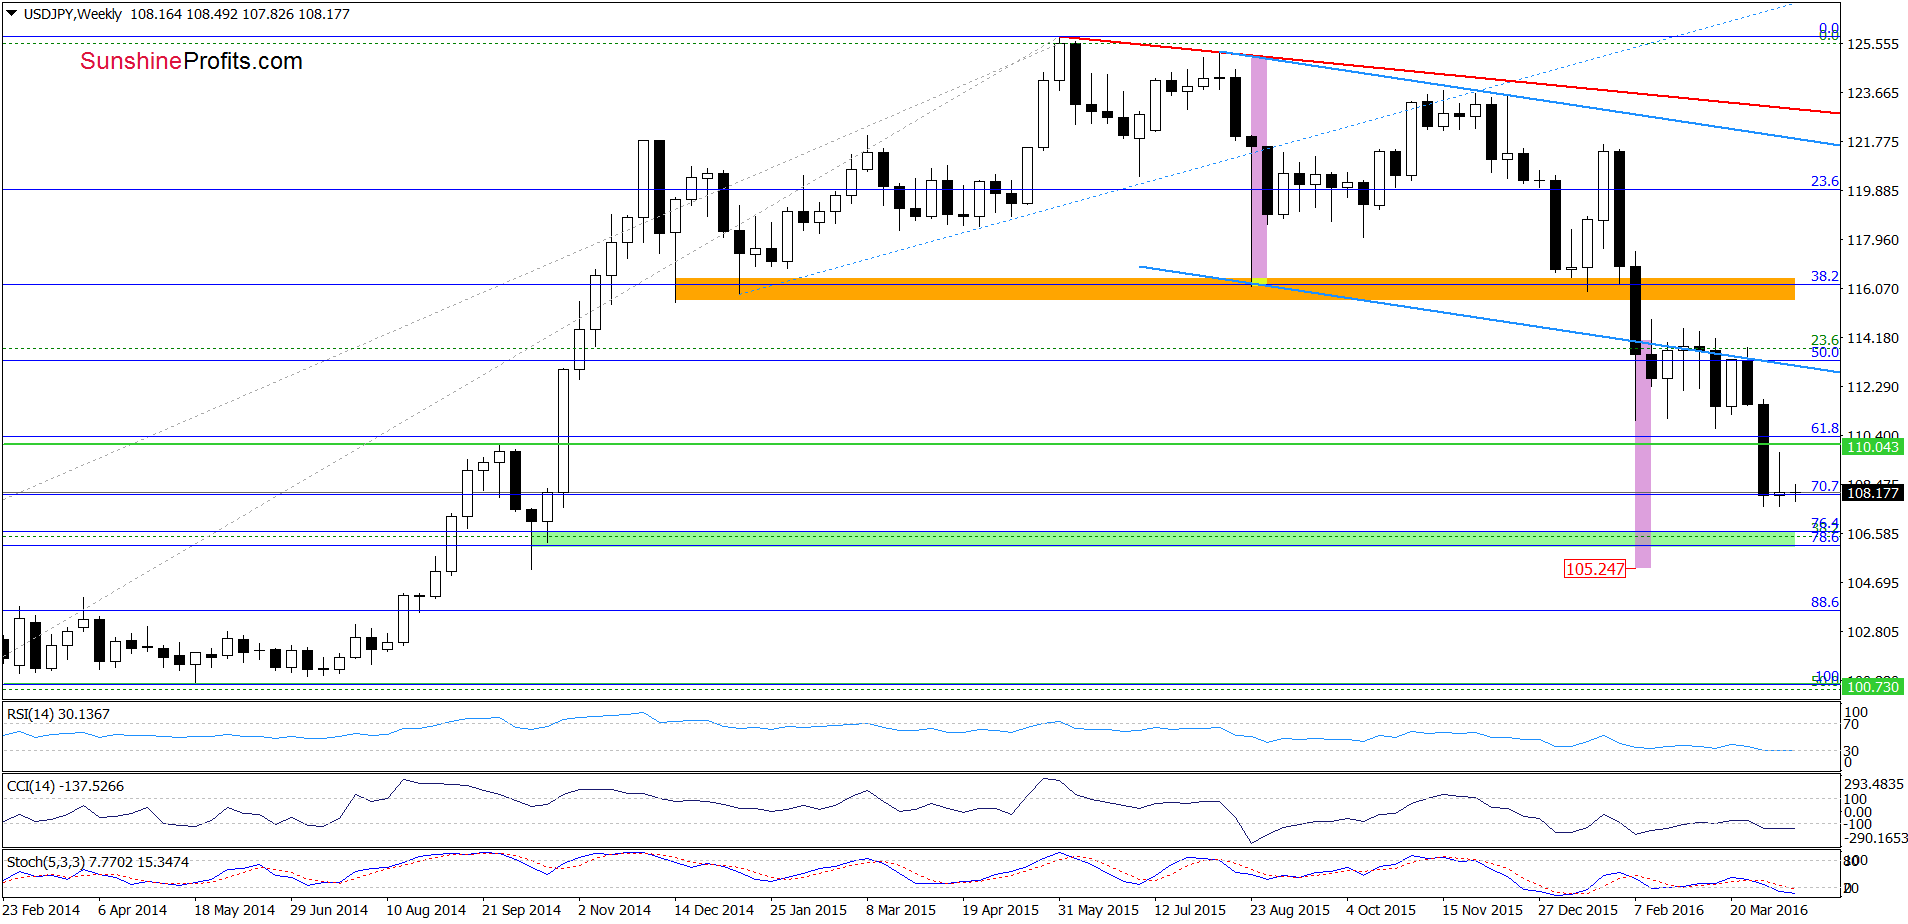
On the weekly chart, we see that the medium-term picture hasn’t changed much as USD/JPY is trading around the 70.7% Fibonacci retracement. Will the daily chart give us more clues about future moves? Let’s check.
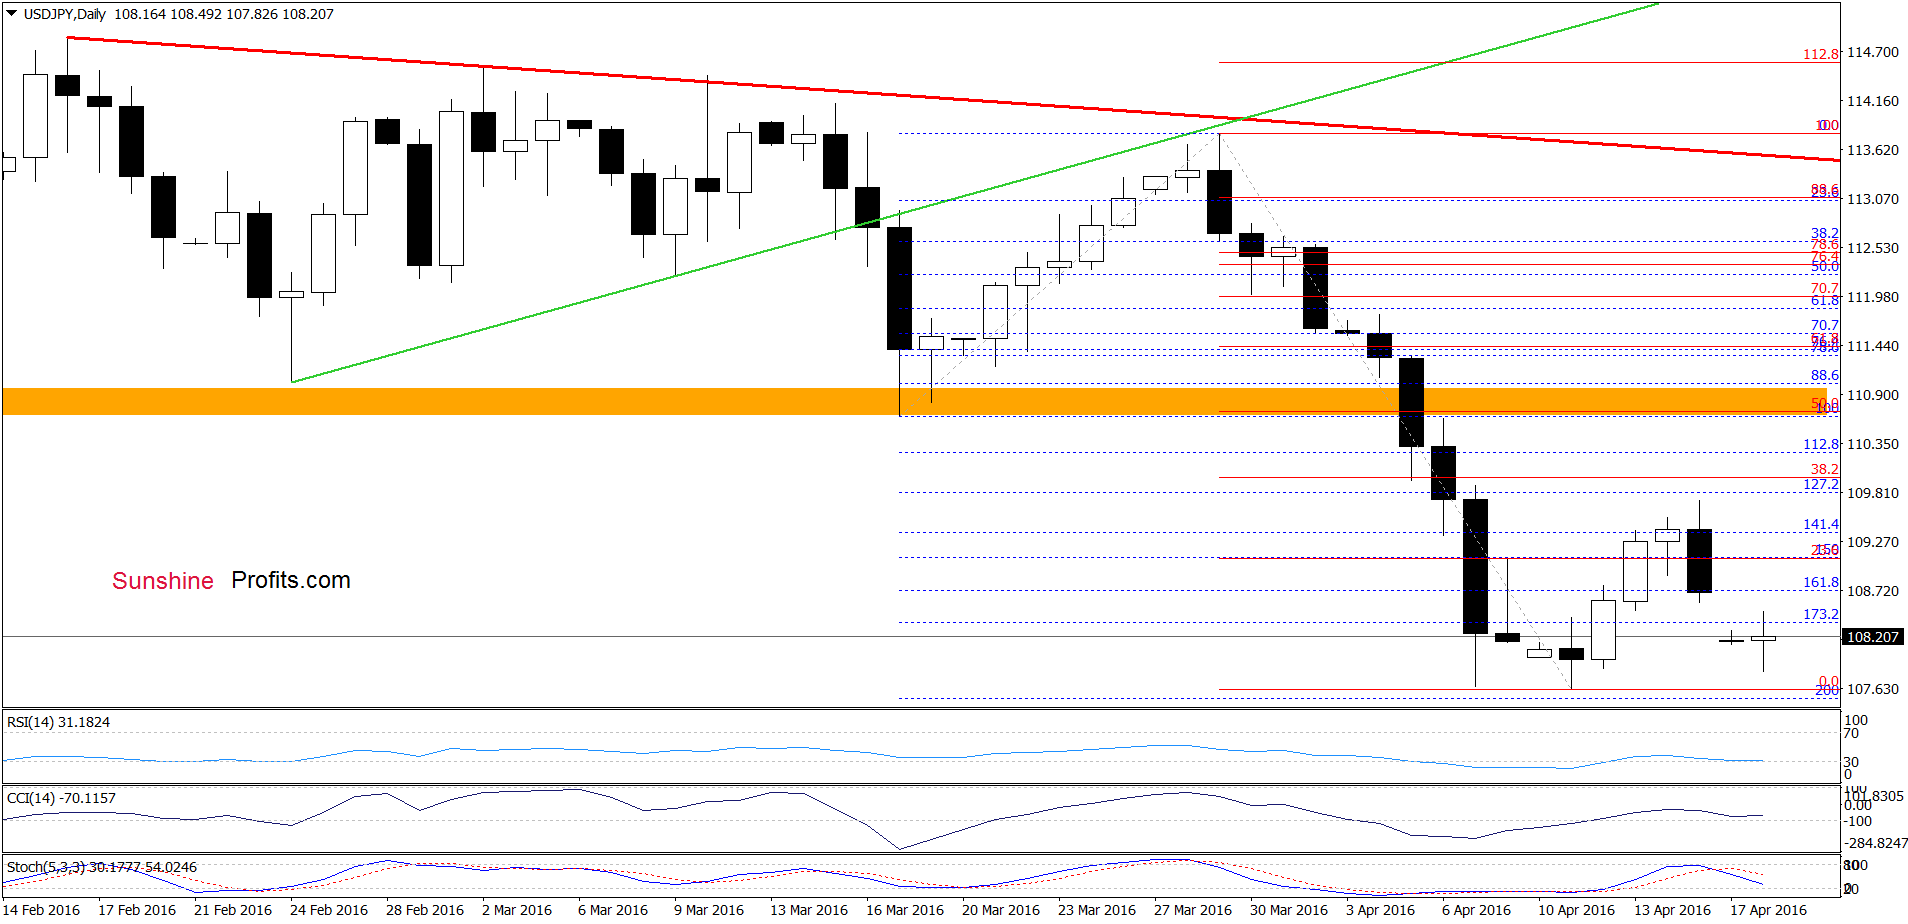
From this perspective, we see that USD/JPY declined sharply and approached the 200% Fibonacci extension once again. Although we may see another rebound from this area (similarly to what we saw in the previous week), sell signal generated by the Stochastic Oscillator is still in play, suggesting another attempt to move lower in the coming days.
Very short-term outlook: mixed
Short-term outlook: mixed
MT outlook: mixed
LT outlook: mixed
Trading position (short-term; our opinion): No positions are justified from the risk/reward perspective at the moment. We will keep you informed should anything change, or should we see a confirmation/invalidation of the above.
USD/CAD
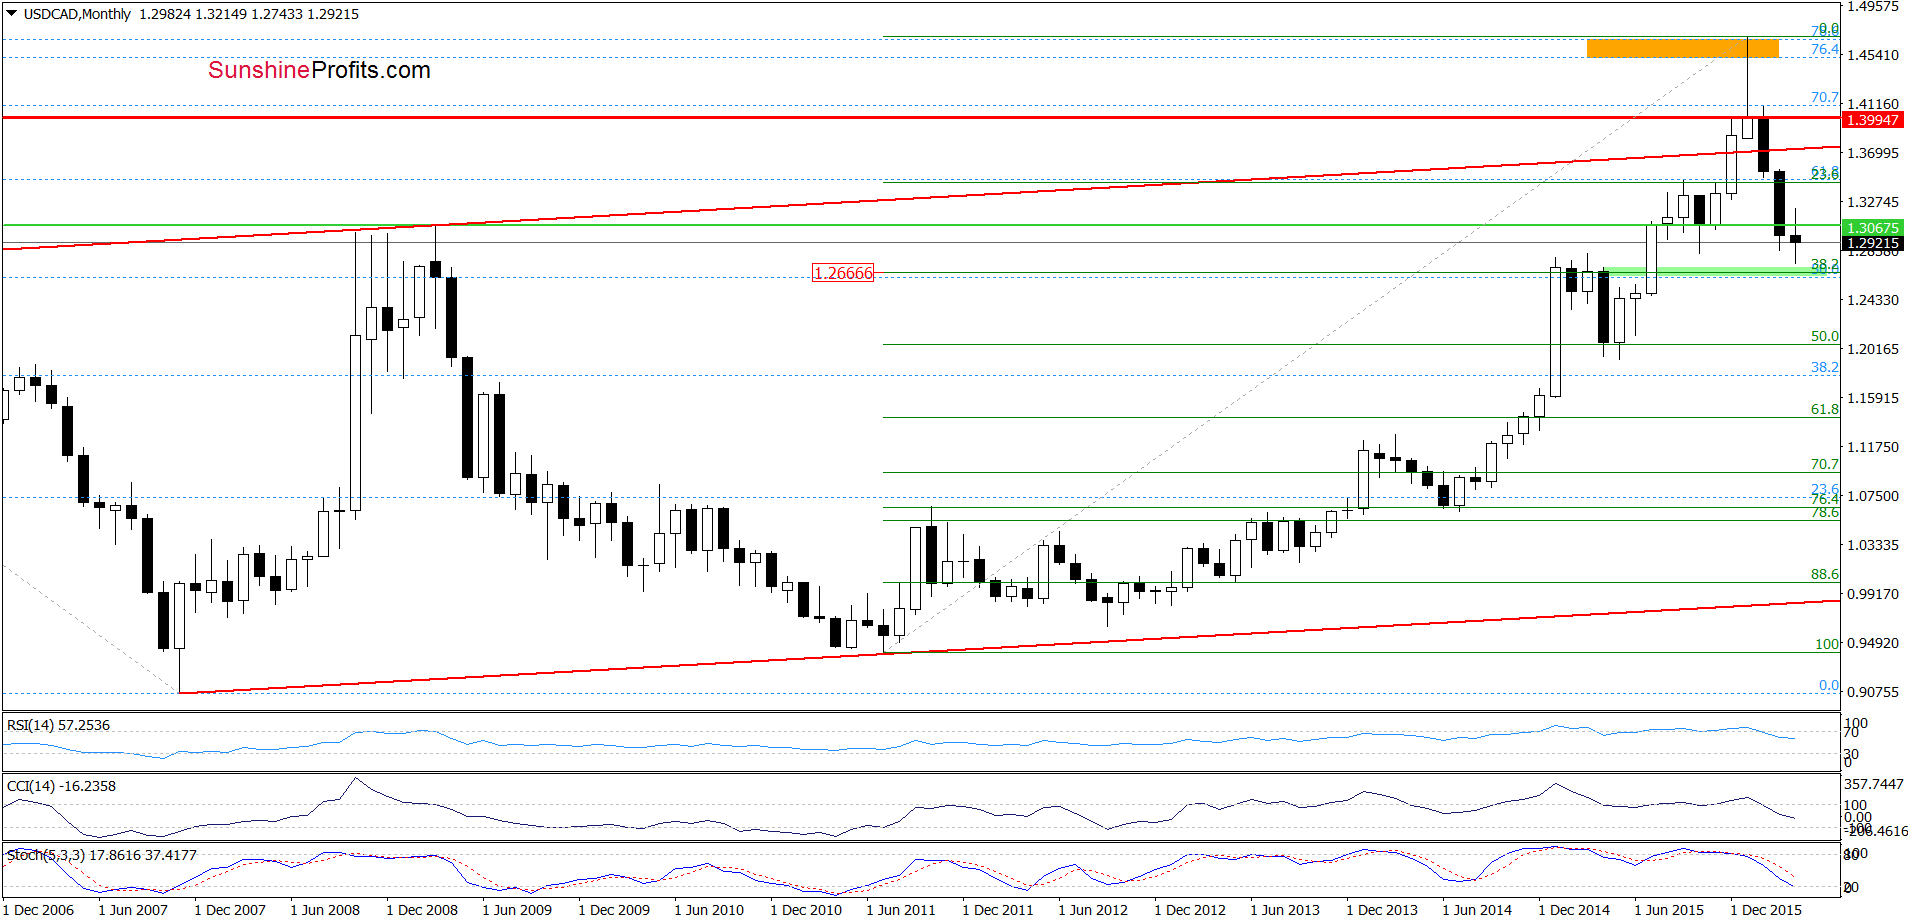
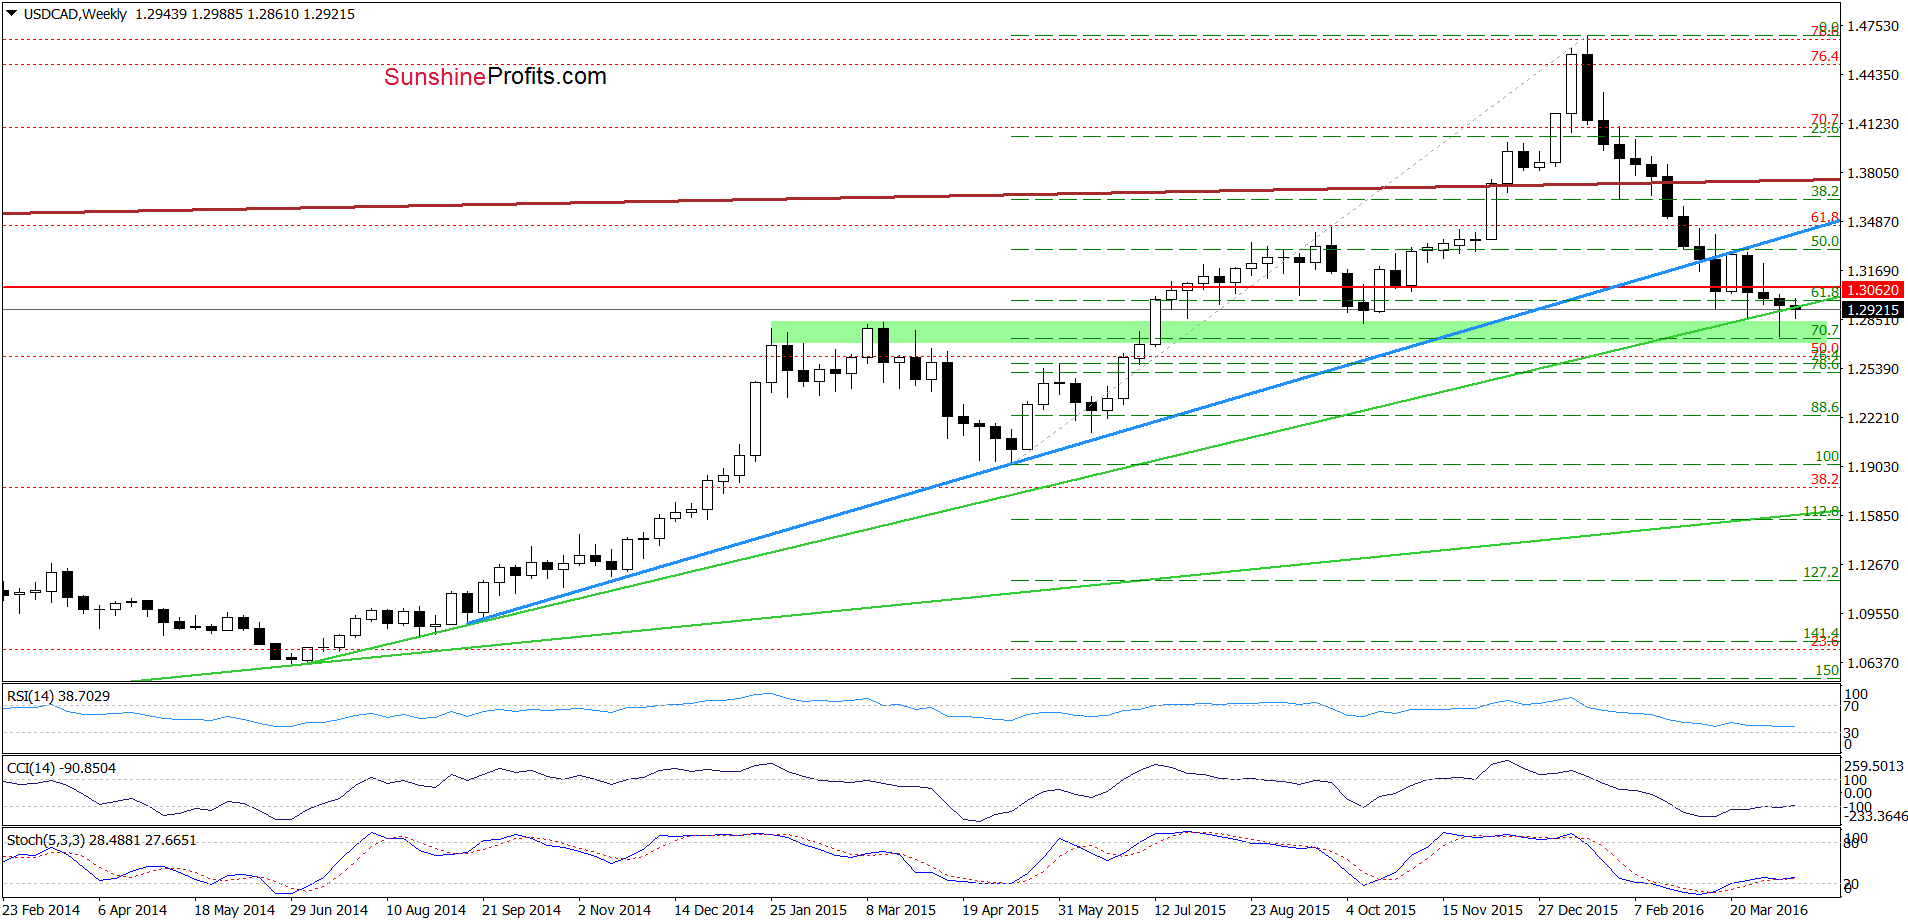
From today’s point of view, we see that USD/CAD is still trading under the previously-broken long-term green support line, which means that our Wednesday’s commentary is up-to-date also today:
(…) USD/CAD (…) declined under the long-term green support line, which resulted in a drop to the green support zone created by the Jan and March 2015 highs and reinforced by the 70.7% Fibonacci retracement (based on May-Jan rally). Taking this fact into account, we think that reversal is just around the corner – even if the exchange rate moves lower once again and test the strength of the 38.2% Fibonacci retracement based on the entire Jul 2011-Jan 2016 upward move (around 1.2666) in the coming week.
Very short-term outlook: mixed
Short-term outlook: mixed
MT outlook: mixed
LT outlook: mixed
Trading position (short-term; our opinion): No positions are justified from the risk/reward perspective at the moment. We will keep you informed should anything change, or should we see a confirmation/invalidation of the above.
USD/CHF
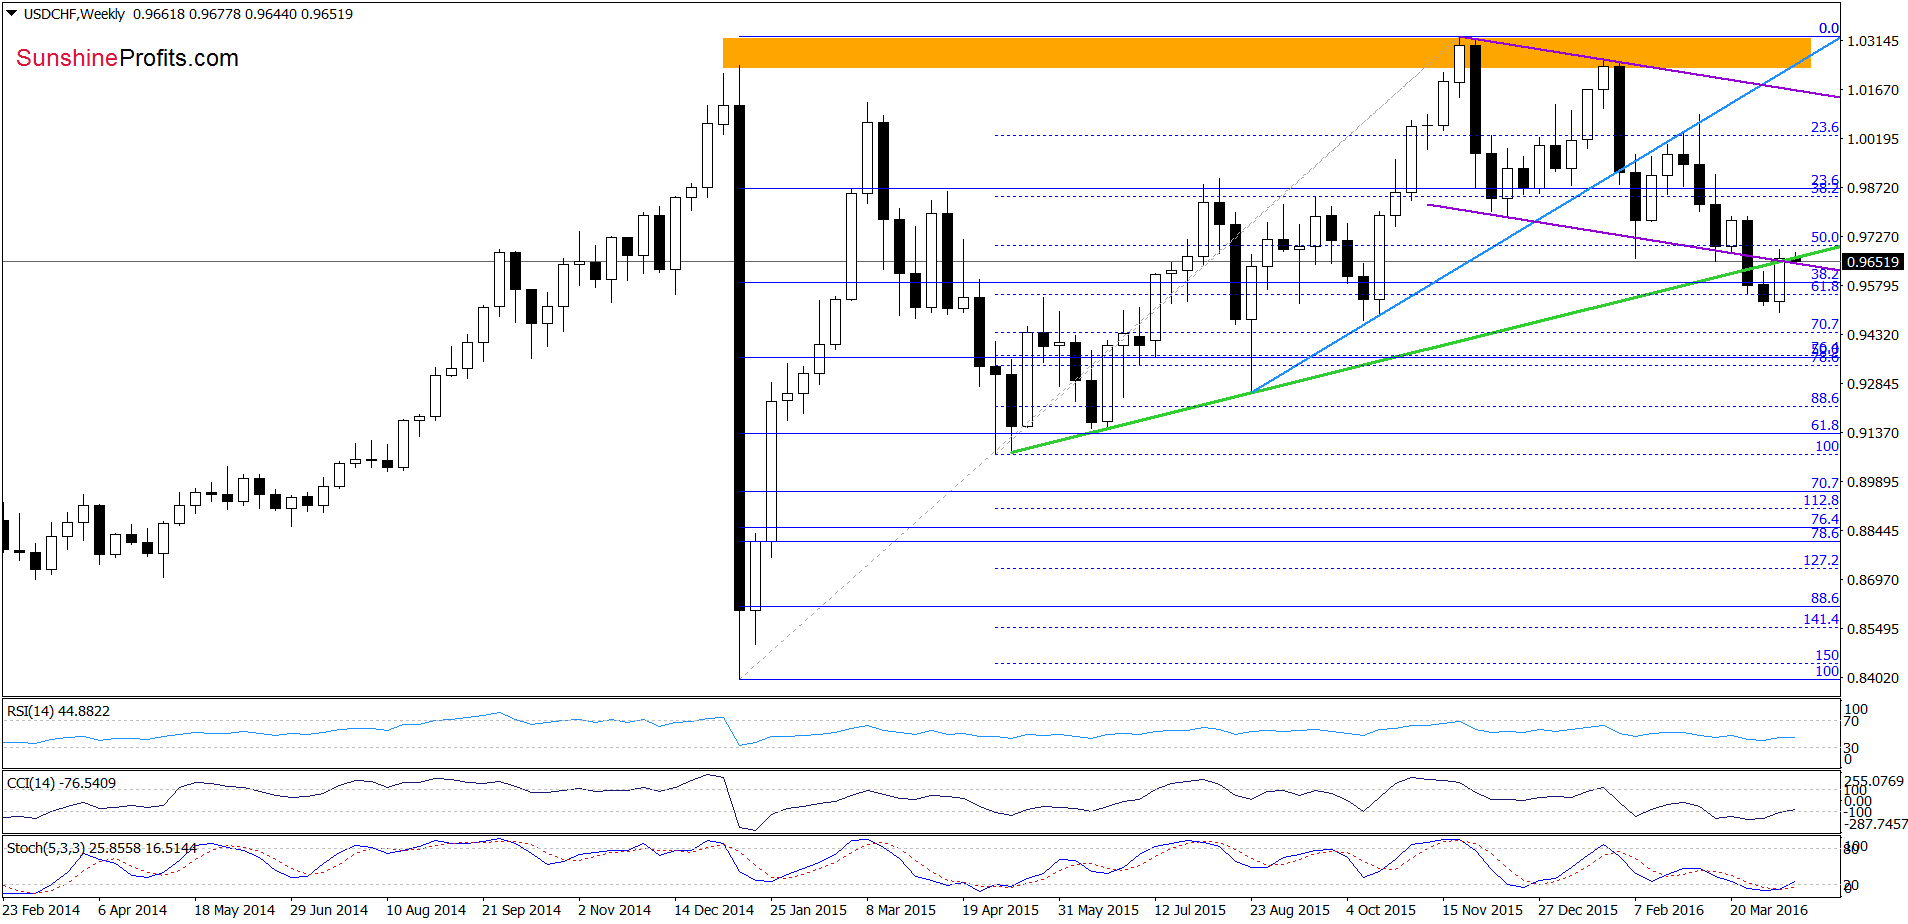
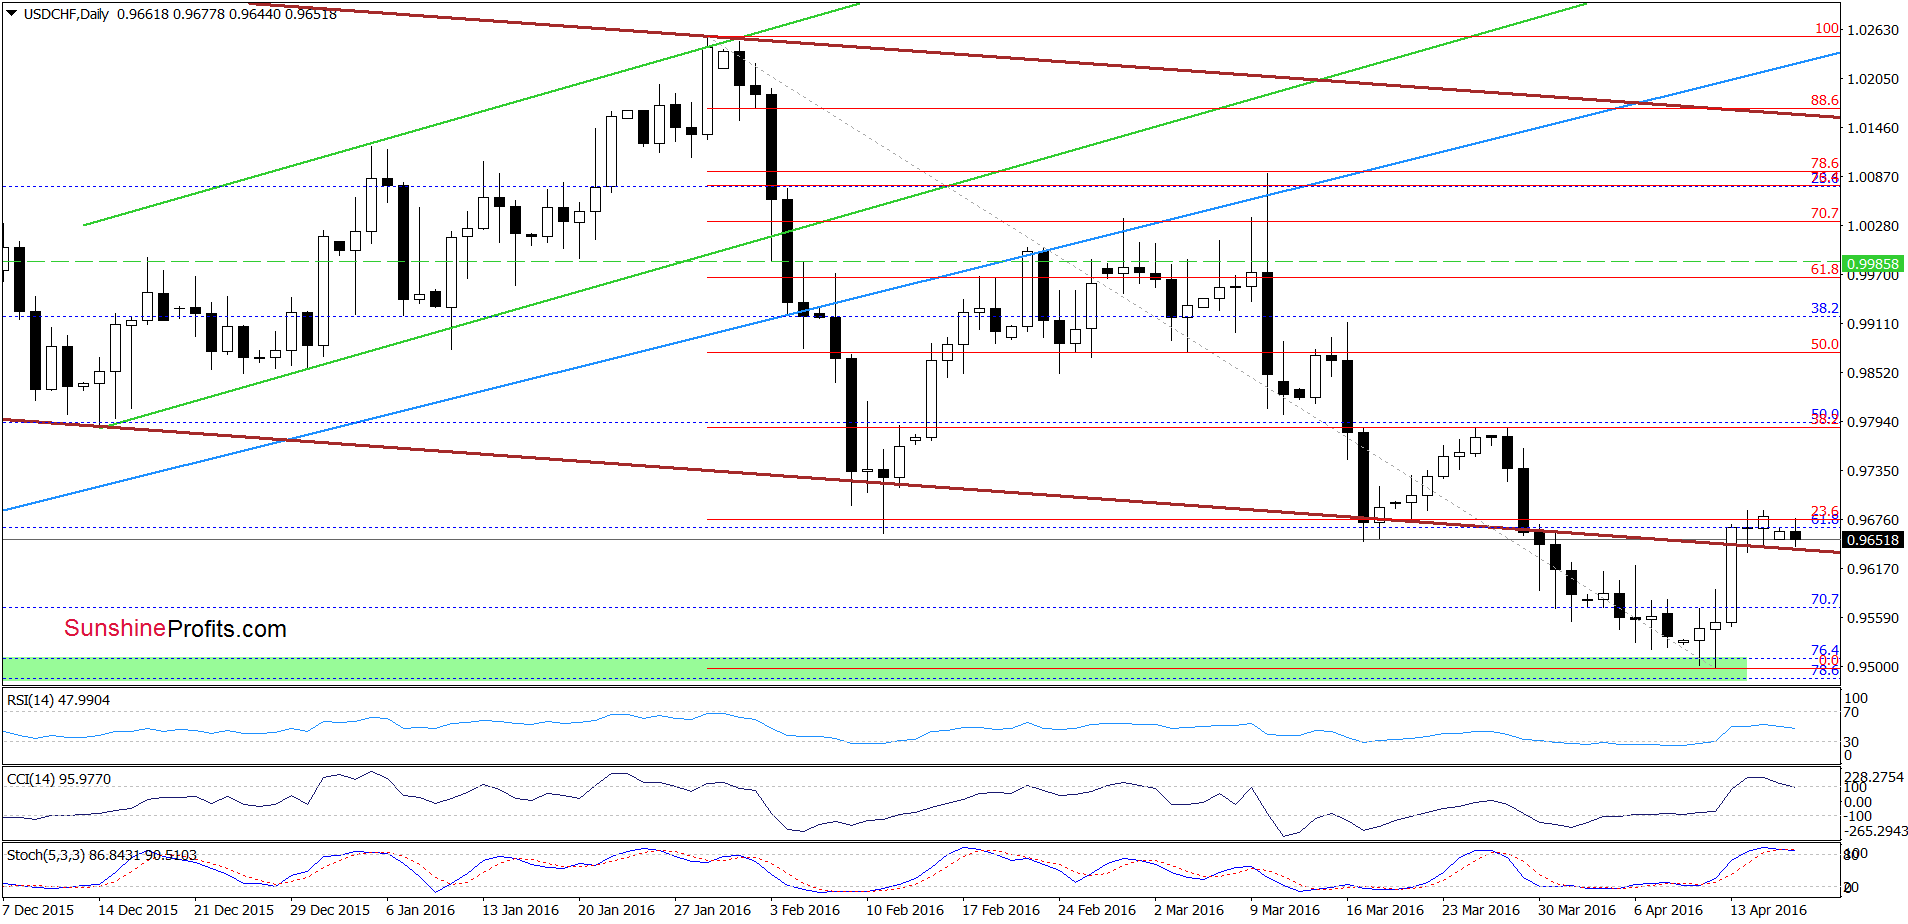
Quoting our previous commentary on this currency pair:
(…) USD/CHF climbed above the lower border of the brown declining trend channel and the green support/resistance line. Although this is a positive signal that suggests further improvement (an invalidation of the breakout), we should keep in mind that the pair reached the 23.6% Fibonacci retracement (based on the Jan 29-Apr 12 downward move), which could encourage currency bears to act – especially when we factor in the fact that the CCI and Stochastic Oscillator are overbought and close to generating sell signals.
As you see on the charts, the situation developed in line with the above scenario and USD/CHF moved little lower, slipping to the previously-broken lower border of the brown declining trend channel. Nevertheless, the CCI and Stochastic Oscillator generated sell signals, which suggests that further deterioration is just around the corner.
Very short-term outlook: mixed
Short-term outlook: mixed
MT outlook: mixed
LT outlook: mixed
Trading position (short-term; our opinion): No positions are justified from the risk/reward perspective. We will keep you informed should anything change, or should we see a confirmation/invalidation of the above.
AUD/USD
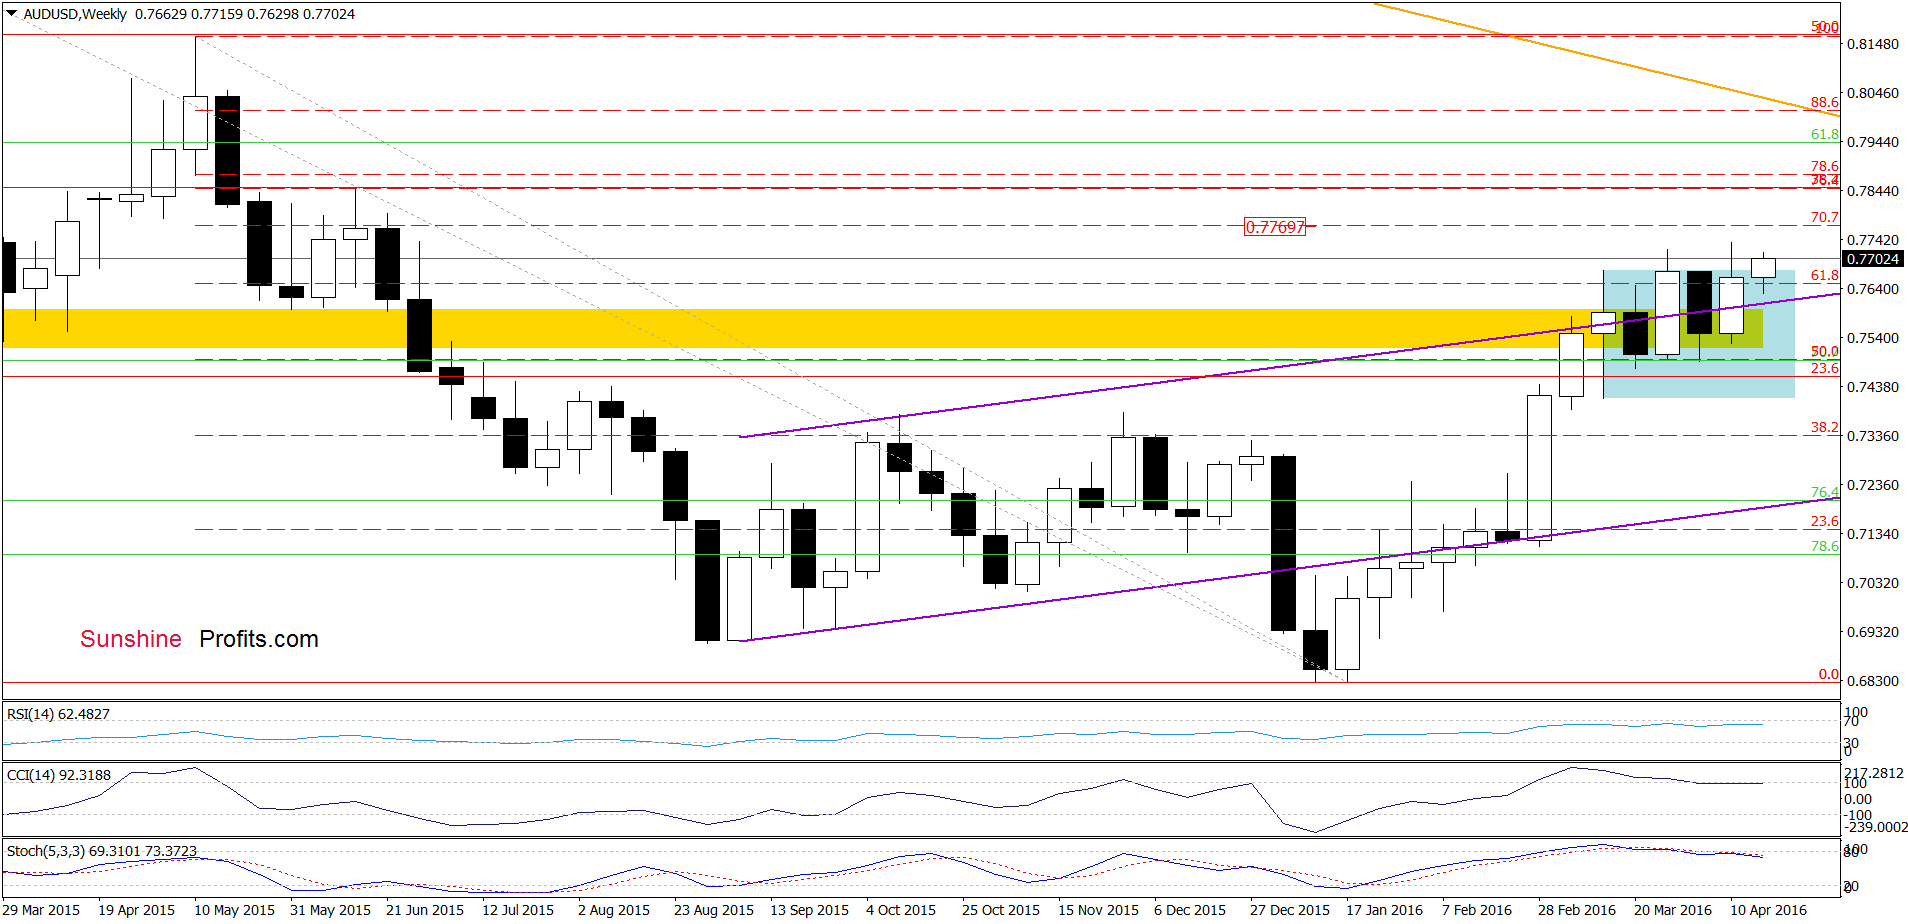
Looking at the medium-term chart, we see that AUD/USD climbed above the upper line of the blue consolidation once again, which suggests a test of the 70.7% Fibonacci retracement (based on the May-Jan downward move) around 0.7769 in the coming week.
Are there any factors that could hinder the realization of the above scenario? Let’s examine the very short-term chart and find out.
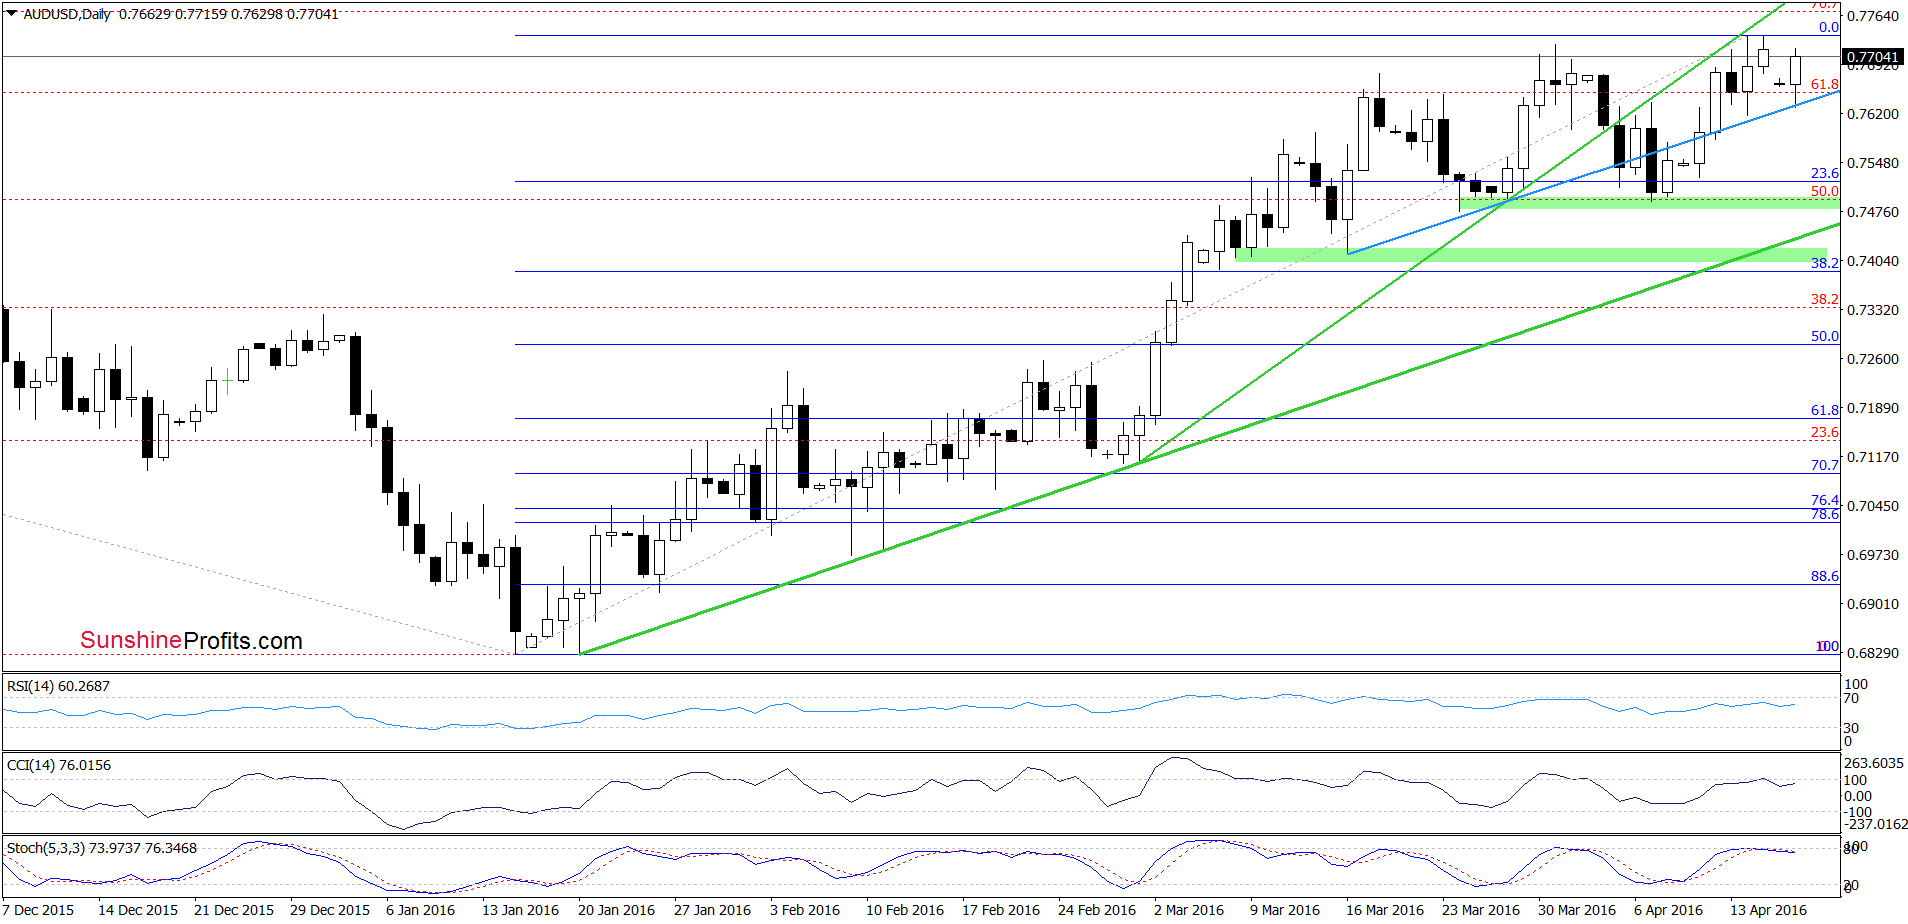
On the daily chart, we see that although AUD/USD moved lower earlier today, the previously-broken blue support/resistance line encouraged currency bulls to act, which triggered a rebound. Although this is a positive signal, we should keep in mind that the CCI and Stochastic Oscillator are overbought, which suggests that reversal in the coming days should not surprise us.
Very short-term outlook: mixed with bearish bias
Short-term outlook: mixed
MT outlook: mixed
LT outlook: mixed
Trading position (short-term; our opinion): No positions are justified from the risk/reward perspective. We will keep you informed should anything change, or should we see a confirmation/invalidation of the above.
Thank you.
Nadia Simmons
Forex & Oil Trading Strategist
Przemyslaw Radomski, CFA
Founder, Editor-in-chief
Gold & Silver Trading Alerts
Forex Trading Alerts
Oil Investment Updates
Oil Trading Alerts

