

Recent increases in crude oil pushed the U.S. dollar lower against its Canadian counterpart, which resulted in a breakdown under the long-term support line. Thanks to this drop, USD/CAD reached the medium-term support zone, but is it enough to encourage currency bulls to act in the coming week?
In our opinion the following forex trading positions are justified - summary:
- EUR/USD: short (stop-loss order at 1.1512; initial downside target at 1.0572)
- GBP/USD: none
- USD/JPY: none
- USD/CAD: none
- USD/CHF: none
- AUD/USD: none
EUR/USD
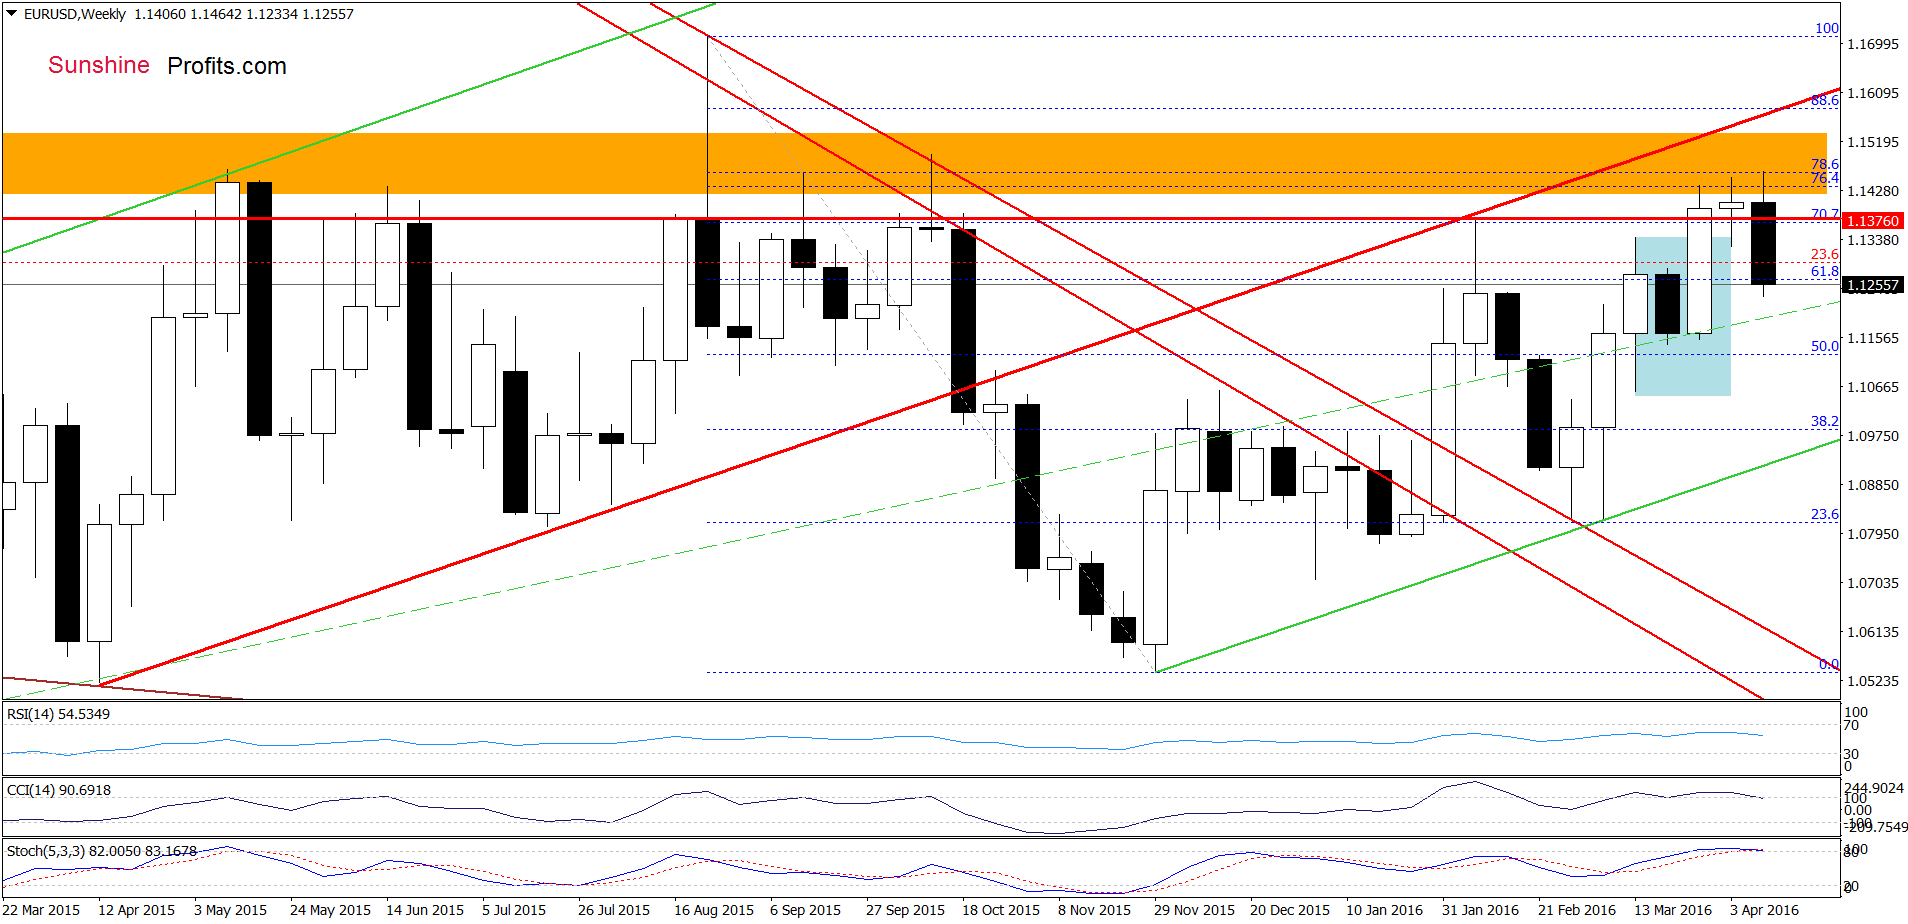
On the weekly chart, we see that EUR/USD remains under the orange resistance zone and the Feb high, which means that what we wrote on Tuesday is up-to-date:
(…) the (…) key resistance zone stopped currency bulls once again, triggering a pullback. With this drop the exchange rate slipped under the Feb high, invalidating earlier breakout, which is a negative signal that suggests further deterioration. Additionally, the CCI and Stochastic Oscillator are very close to generating sell signals, which increases the probability of further declines.
Having said the above, let’s examine the very short-term picture.
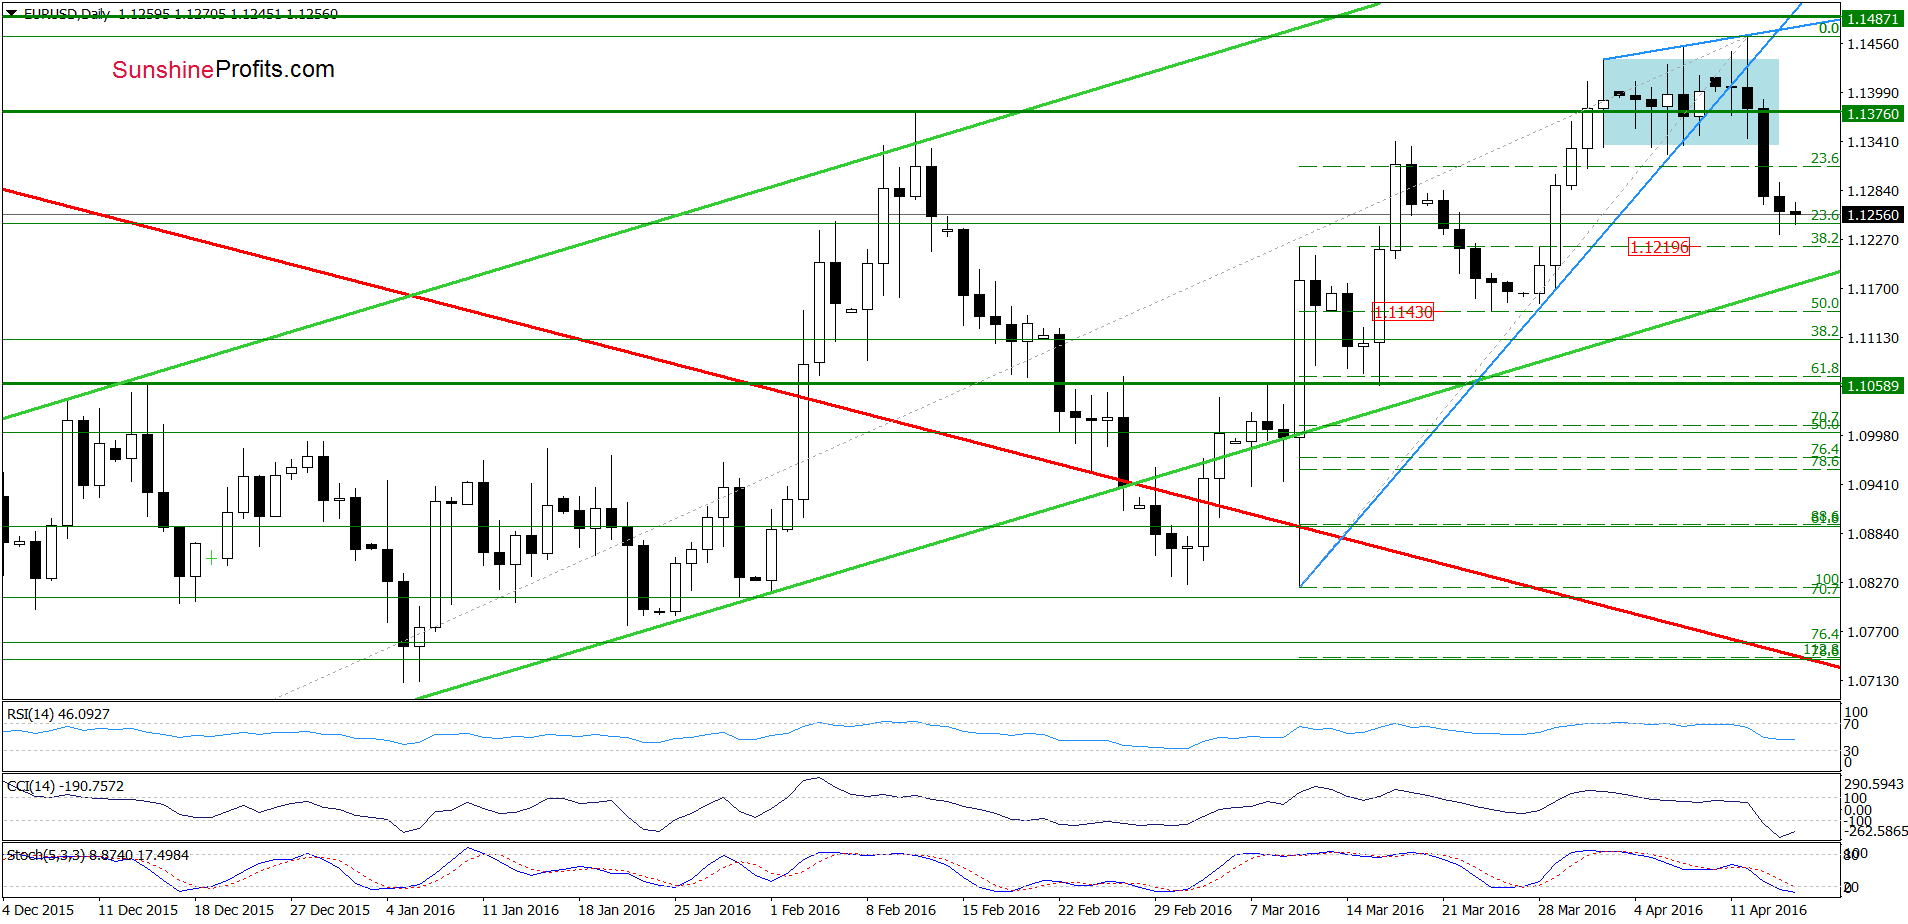
Looking at the daily chart, we see that although EUR/USD rebounded slightly yesterday, currency bulls didn’t manage to push the pair higher, which resulted in another small drop earlier today. Therefore, we believe that our previous commentary is up-to-date:
(…) the exchange rate remains under the lower border of the blue consolidation and well below the lower line of the rising wedge, which in combination with sell signals generated by the indicators suggests another attempt to move lower in the coming days. Therefore, if the pair declines once again and drops under today’s low, the next downside target would be the support zone created by the late-March lows and the 50% retracement (around 1.1143-1.1163).
Very short-term outlook: bearish
Short-term outlook: bearish
MT outlook: mixed with bearish bias
LT outlook: mixed
Trading position (short-term; our opinion): Short positions (with a stop-loss order at 1.1512 and the initial downside target at 1.0572) are justified from the risk/reward perspective. We will keep you informed should anything change, or should we see a confirmation/invalidation of the above.
USD/CAD
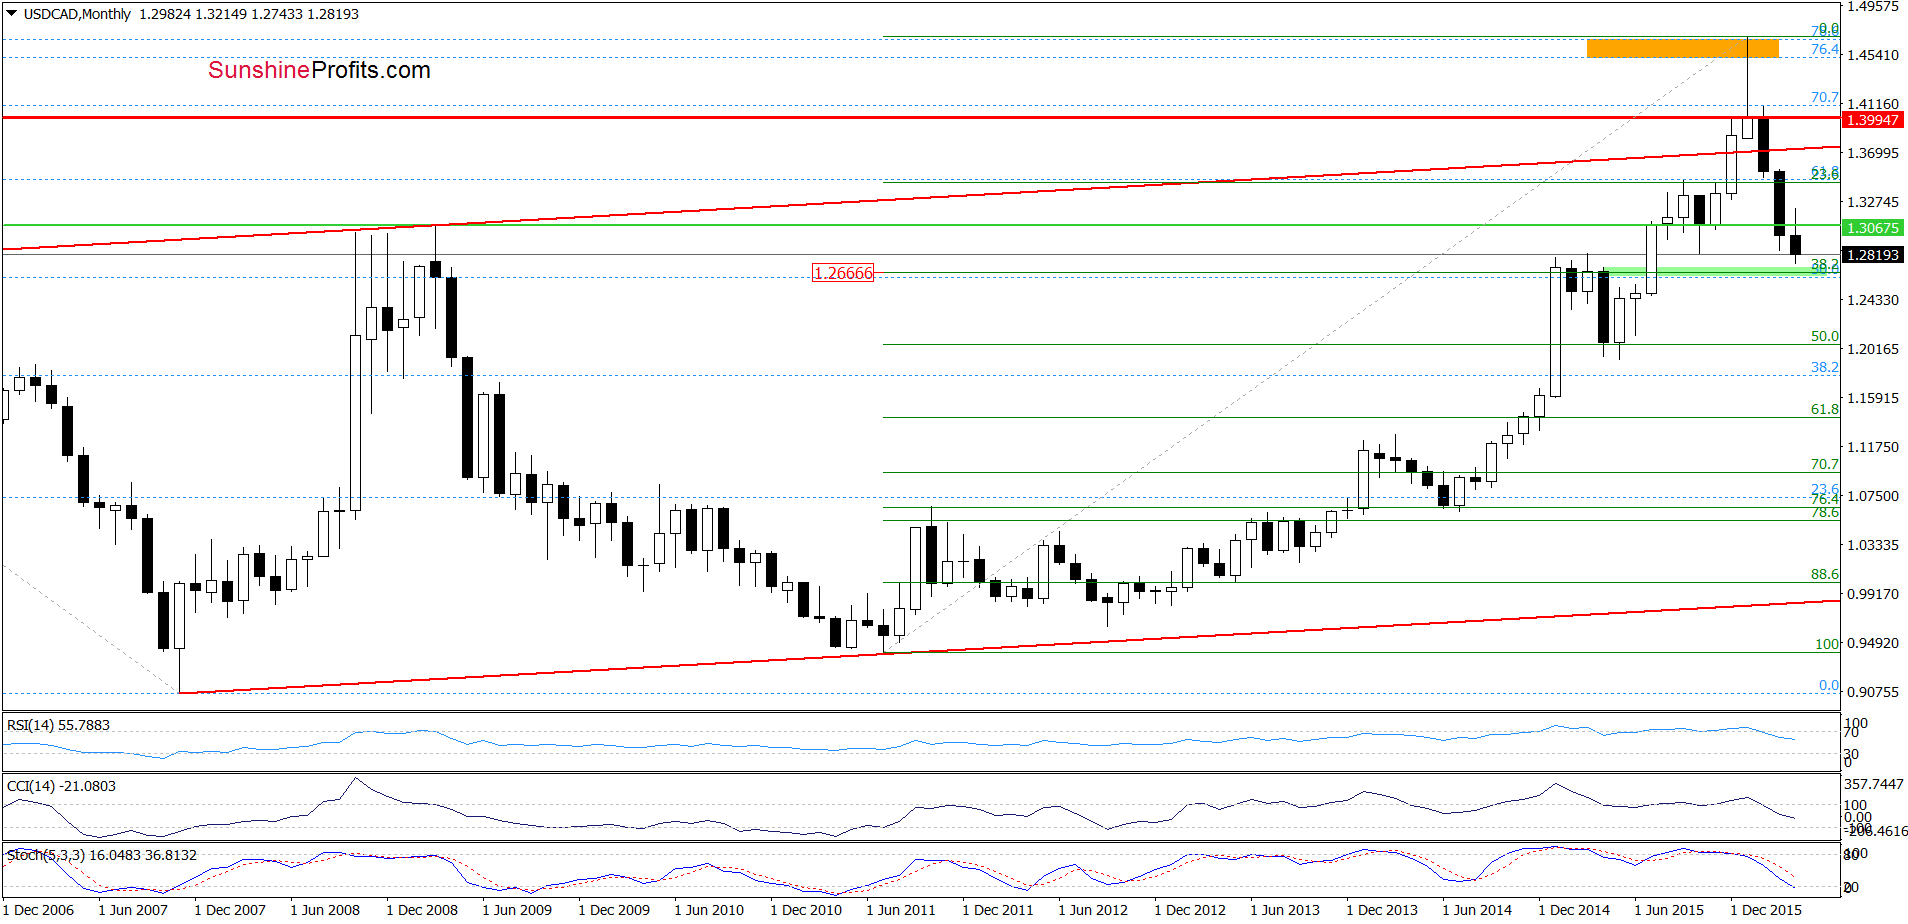
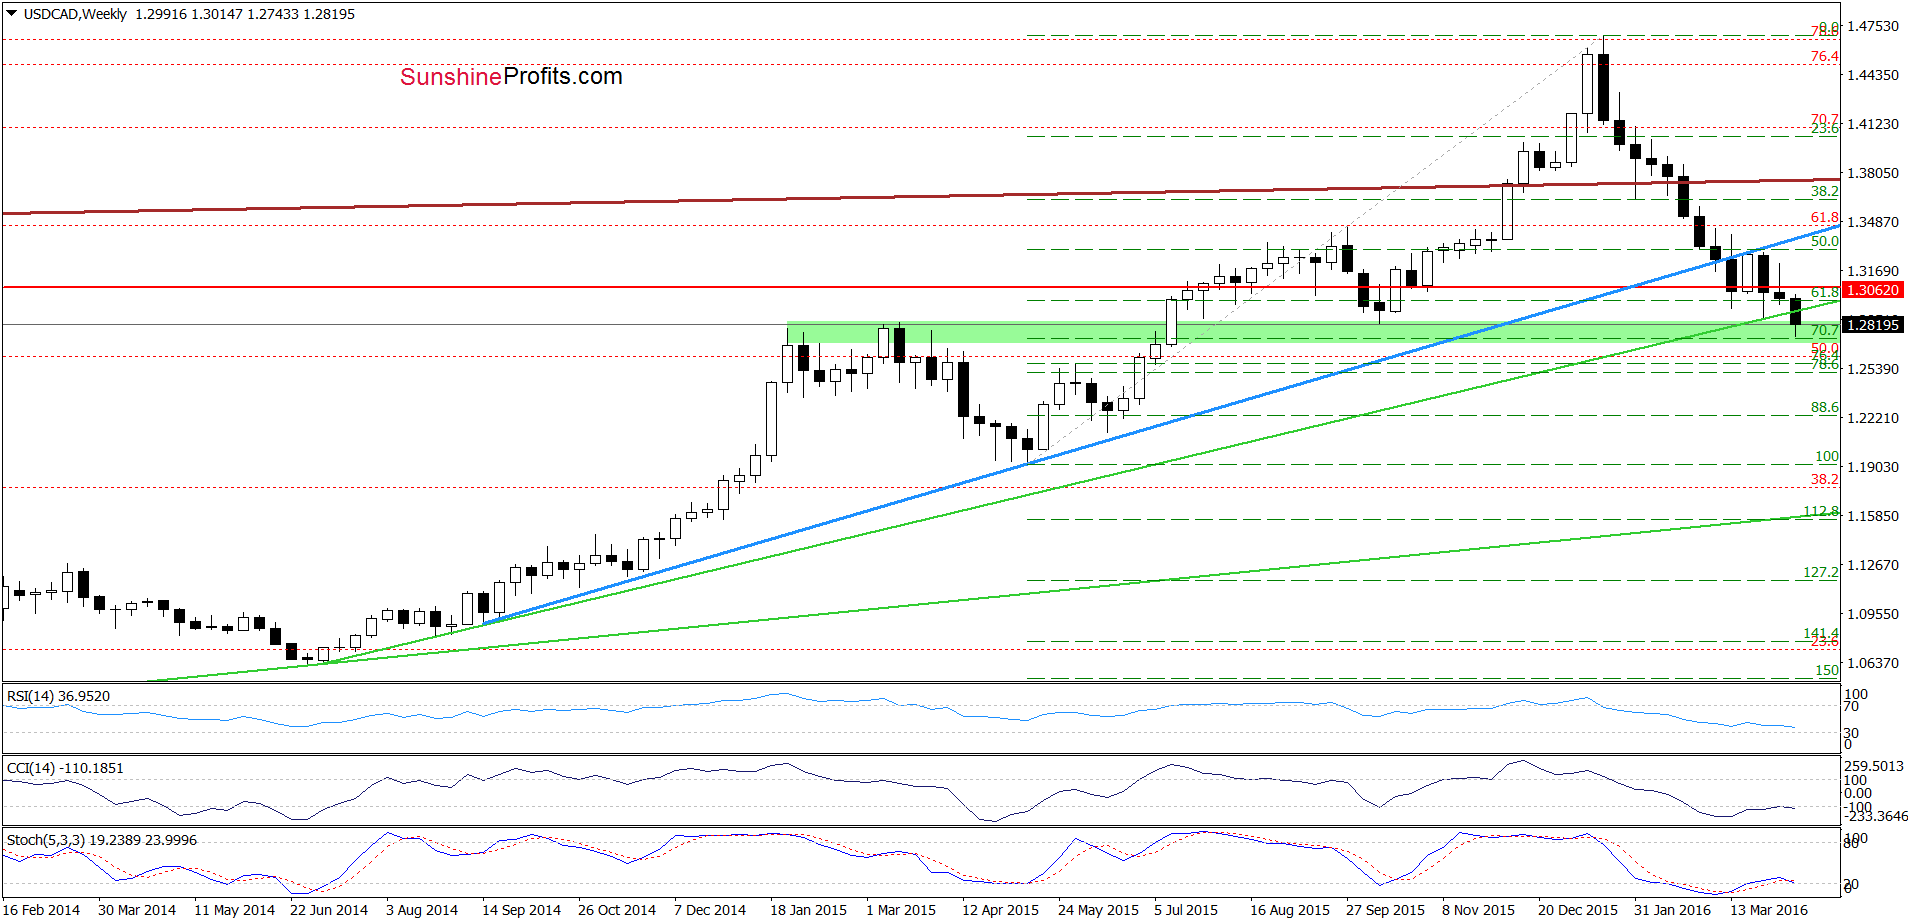
From today’s point of view, we see that USD/CAD is still trading under the previously-broken long-term green support line, which means that our Wednesday’s alert is still valid:
(…) USD/CAD (…) declined under the long-term green support line, which resulted in a drop to the green support zone created by the Jan and March 2015 highs and reinforced by the 70.7% Fibonacci retracement (based on May-Jan rally). Taking this fact into account, we think that reversal is just around the corner – even if the exchange rate moves lower once again and test the strength of the 38.2% Fibonacci retracement based on the entire Jul 2011-Jan 2016 upward move (around 1.2666) in the coming week.
Very short-term outlook: mixed
Short-term outlook: mixed
MT outlook: mixed
LT outlook: mixed
Trading position (short-term; our opinion): No positions are justified from the risk/reward perspective at the moment. We will keep you informed should anything change, or should we see a confirmation/invalidation of the above.
USD/CHF
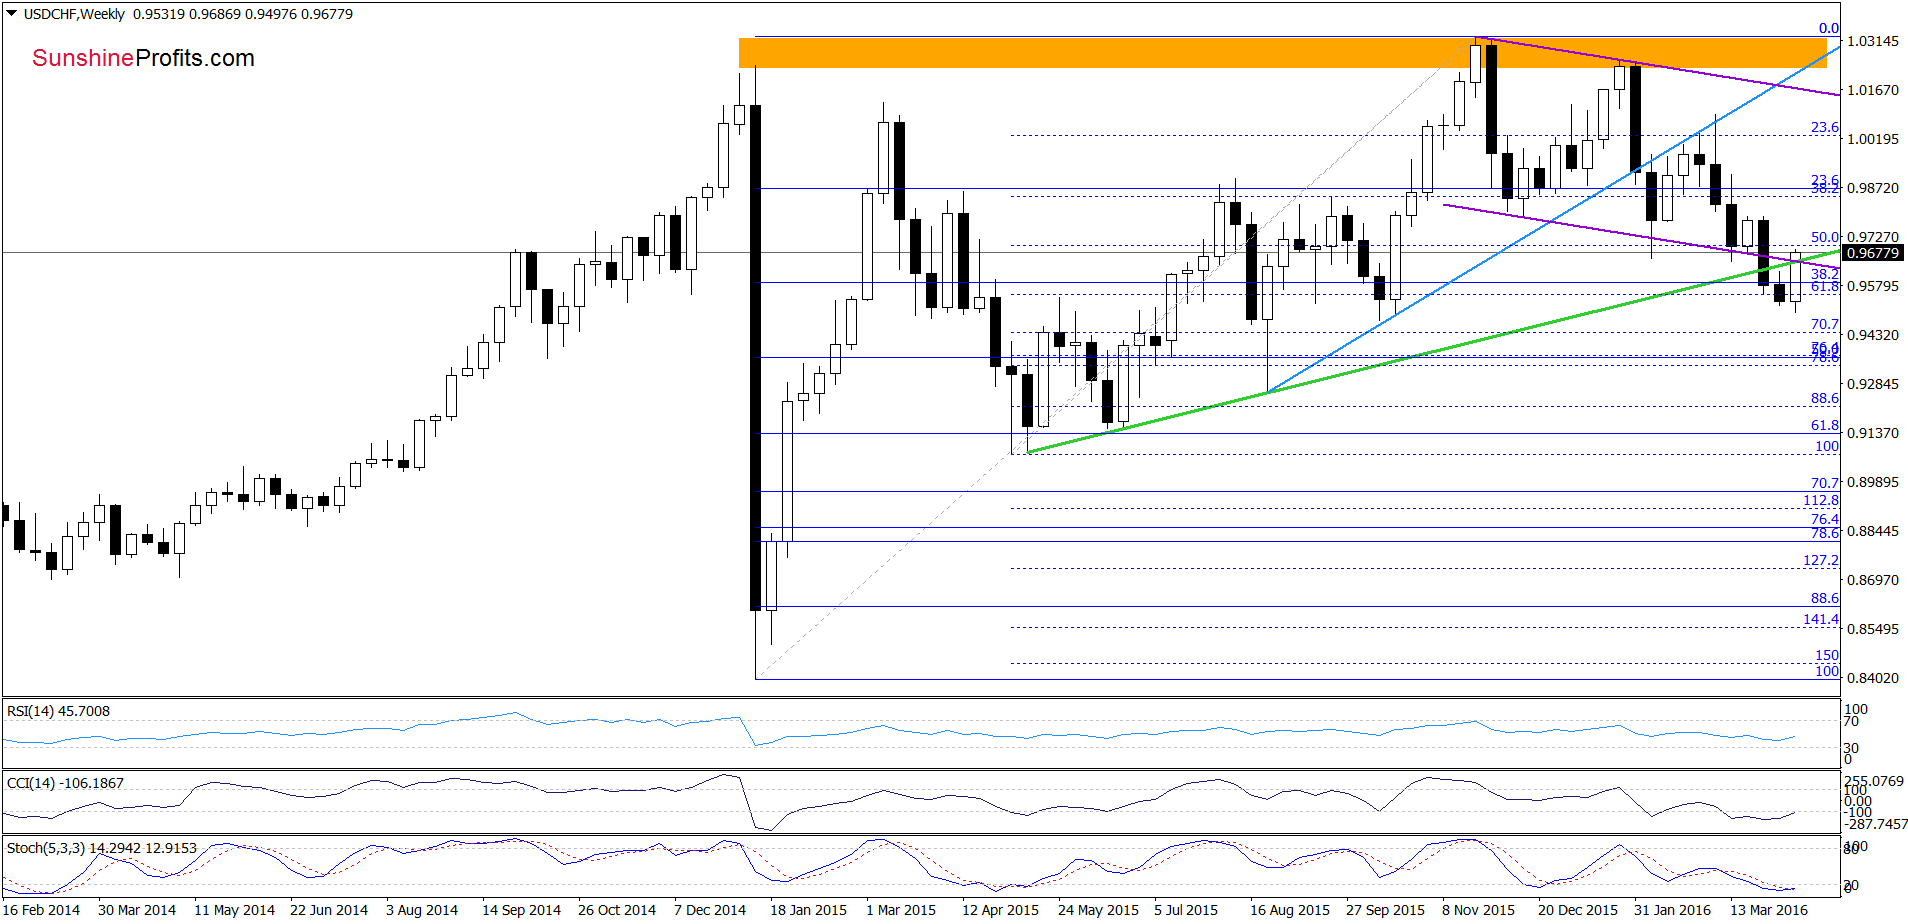
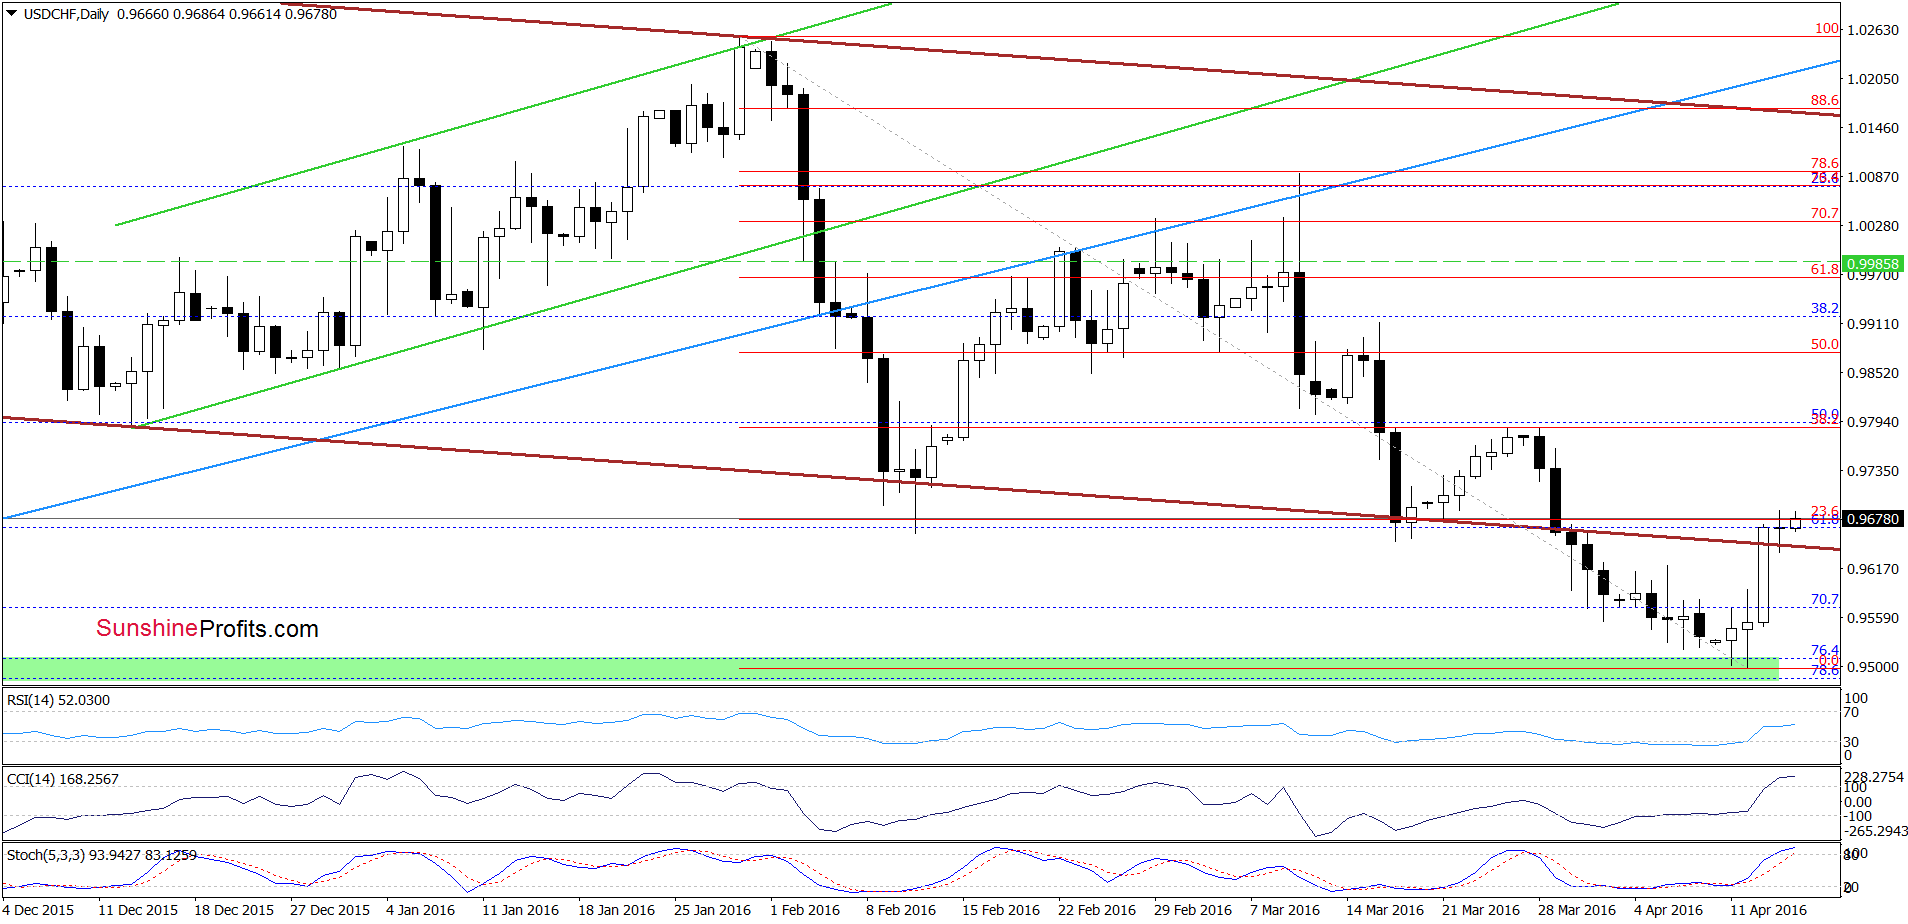
Quoting our previous commentary on this currency pair:
(…) although USD/CHF moved little lower yesterday, the green support zone marked on the daily chart (created by the 76.4% and 78.6% Fibonacci retracement levels based on entire Aug-Nov upward move) encouraged currency bulls to act, which resulted in a rebound. Earlier today, the exchange rate extended gains, which in combination with buy signals generated by the daily indicators suggests a test of the lower border of the brown declining trend channel and the green support/resistance line (marked on the weekly chart) in the coming day(s).
As you see on the charts, the situation developed in line with the above scenario and USD/CHF climbed above the lower border of the brown declining trend channel and the green support/resistance line. Although this is a positive signal that suggests further improvement (an invalidation of the breakout), we should keep in mind that the pair reached the 23.6% Fibonacci retracement (based on the Jan 29-Apr 12 downward move), which could encourage currency bears to act – especially when we factor in the fact that the CCI and Stochastic Oscillator are overbought and close to generating sell signals. Therefore, waiting at the side lines for a weekly closure is justified from the risk/reward perspective at the moment.
Very short-term outlook: mixed
Short-term outlook: mixed
MT outlook: mixed
LT outlook: mixed
Trading position (short-term; our opinion): No positions are justified from the risk/reward perspective. We will keep you informed should anything change, or should we see a confirmation/invalidation of the above.
Thank you.
Nadia Simmons
Forex & Oil Trading Strategist
Przemyslaw Radomski, CFA
Founder, Editor-in-chief
Gold & Silver Trading Alerts
Forex Trading Alerts
Oil Investment Updates
Oil Trading Alerts

