

Although EUR/USD moved higher yesterday, the pair reversed and declined, invalidating earlier breakout above resistance levels. Will this negative signal encourage currency bears to act in the coming days?
In our opinion the following forex trading positions are justified - summary:
- EUR/USD: short (stop-loss order at 1.1512; initial downside target at 1.0572)
- GBP/USD: none
- USD/JPY: none
- USD/CAD: none
- USD/CHF: long (stop-loss order at 0.9633; initial downside target at 1.0239)
- AUD/USD: none
EUR/USD
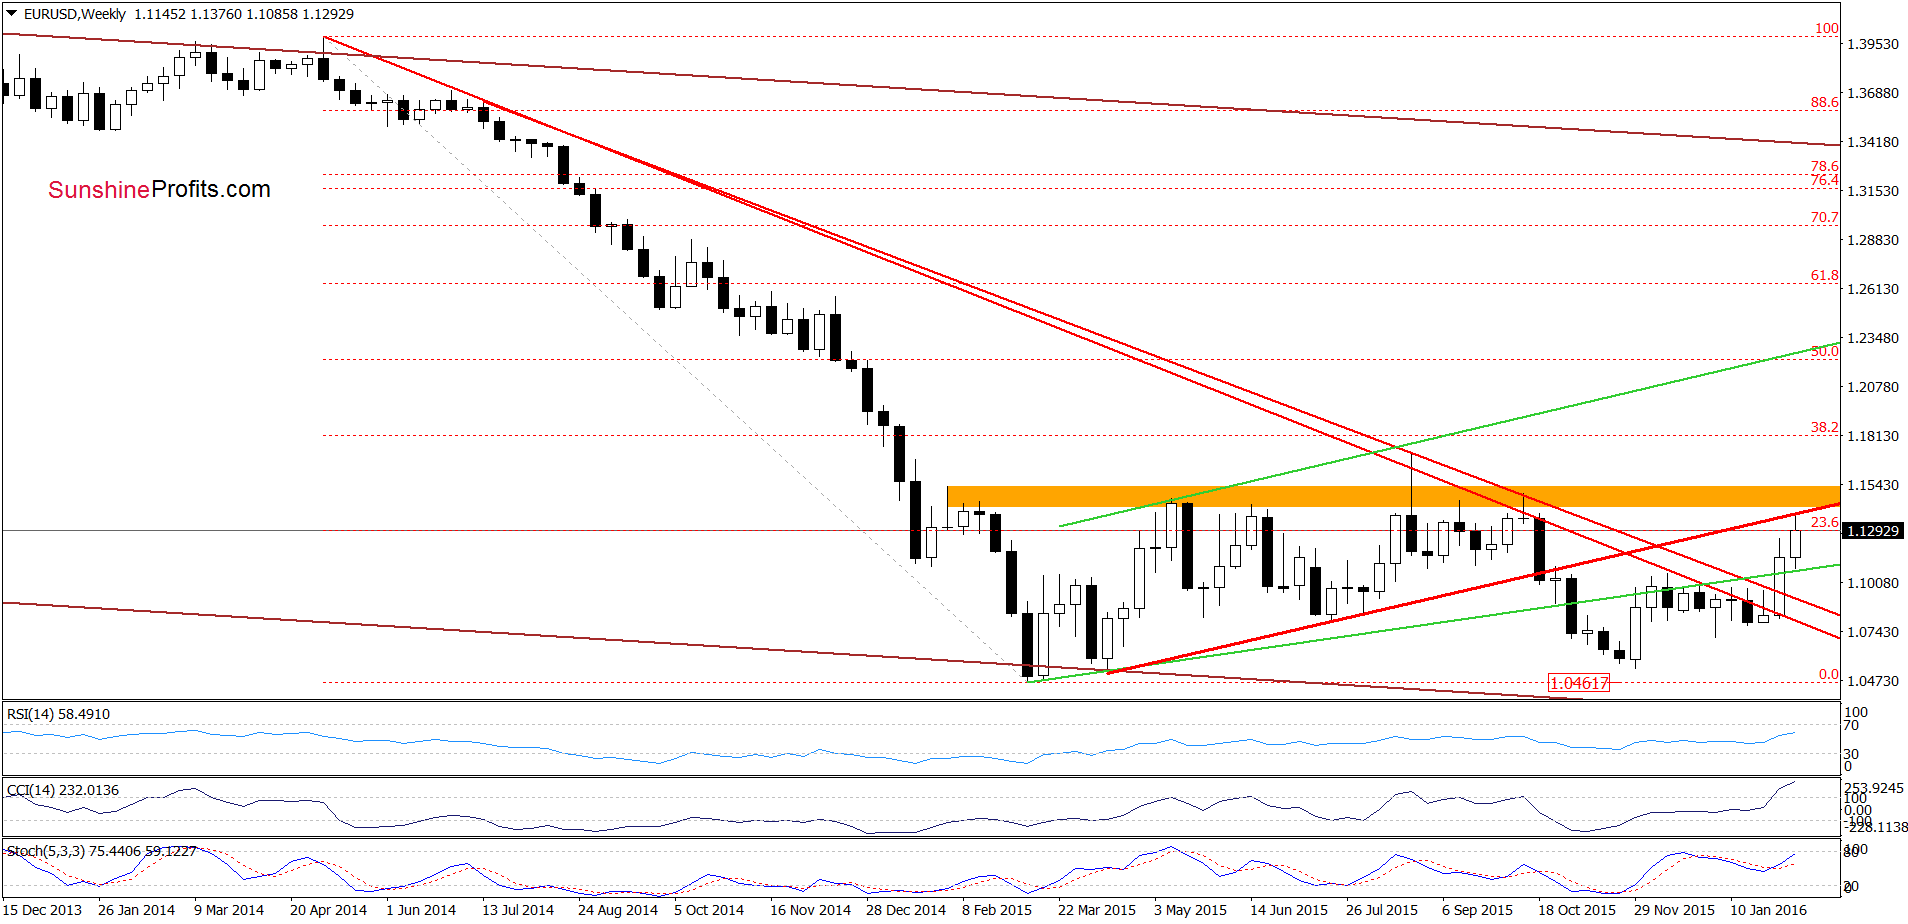
Looking at the weekly chart we see that EUR/USD extended gains and climbed to the previously-broken medium-term red resistance line based on the Apr, Jul and Aug lows. With this upward move, the pair also approached the orange resistance zone, which suggests a reversal from here in the coming week.
Are there any other factors that could encourage currency bears to act? Let’s examine the daily chart and find out.
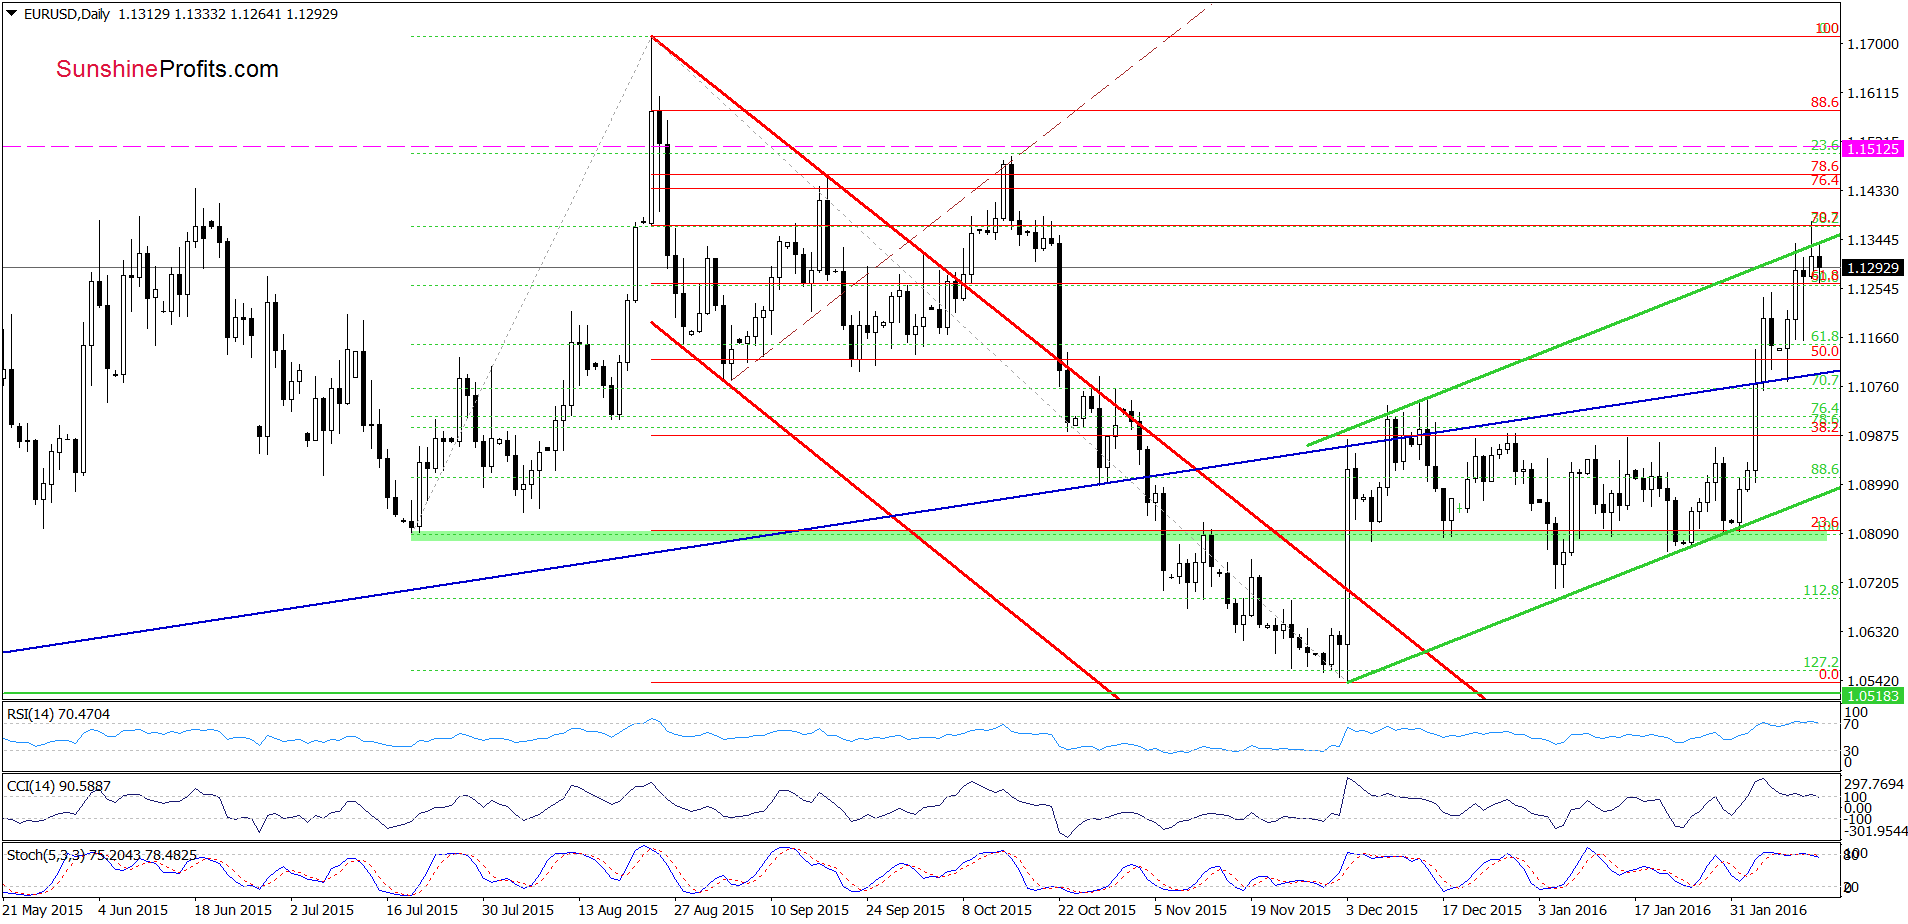
From this perspective, we see that although EUR/USD moved higher once again, the upper border of the green rising trend channel and the 70.7% Fibonacci retracement stopped further improvement, triggering a pullback. With this move, the exchange rate invalidated earlier small breakout, which in combination with the current position of the indicators suggests lower values of EUR/USD in the coming days. If this is the case, and the pair declined from here, the initial downside target would be the previously-broken navy blue support line (currently around 1.110)). If it is broken, the pair will test the lower border of the green rising trend channel (currently at 1.0881).
Very short-term outlook: bearish
Short-term outlook: bearish
MT outlook: mixed with bearish bias
LT outlook: mixed
Trading position (short-term; our opinion): The previous stop-loss level was temporarily reached yesterday - if the position was automatically close, in our opinion it’s justified from the risk/reward perspective to re-enter this position with a higher stop-loss level. If it wasn’t closed, we still think that adjusting the stop-loss level to 1.1512 is justified from the risk/reward perspective. We will keep you informed should anything change, or should we see a confirmation/invalidation of the above.
GBP/USD
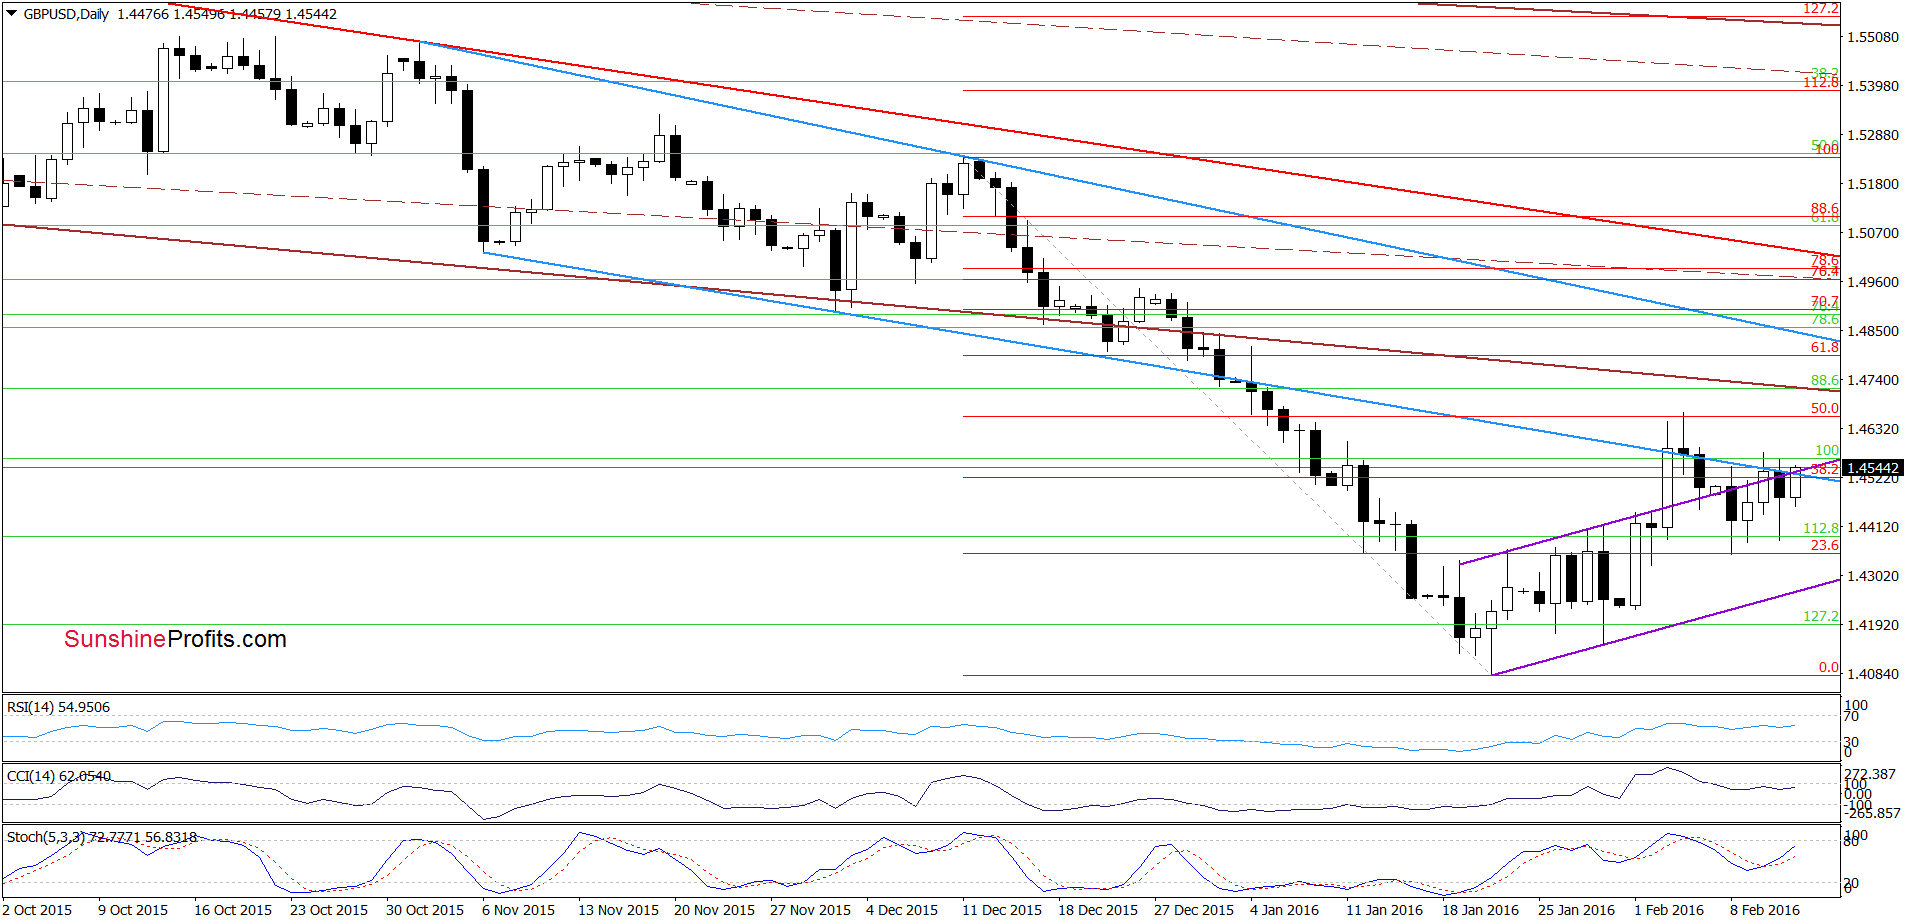
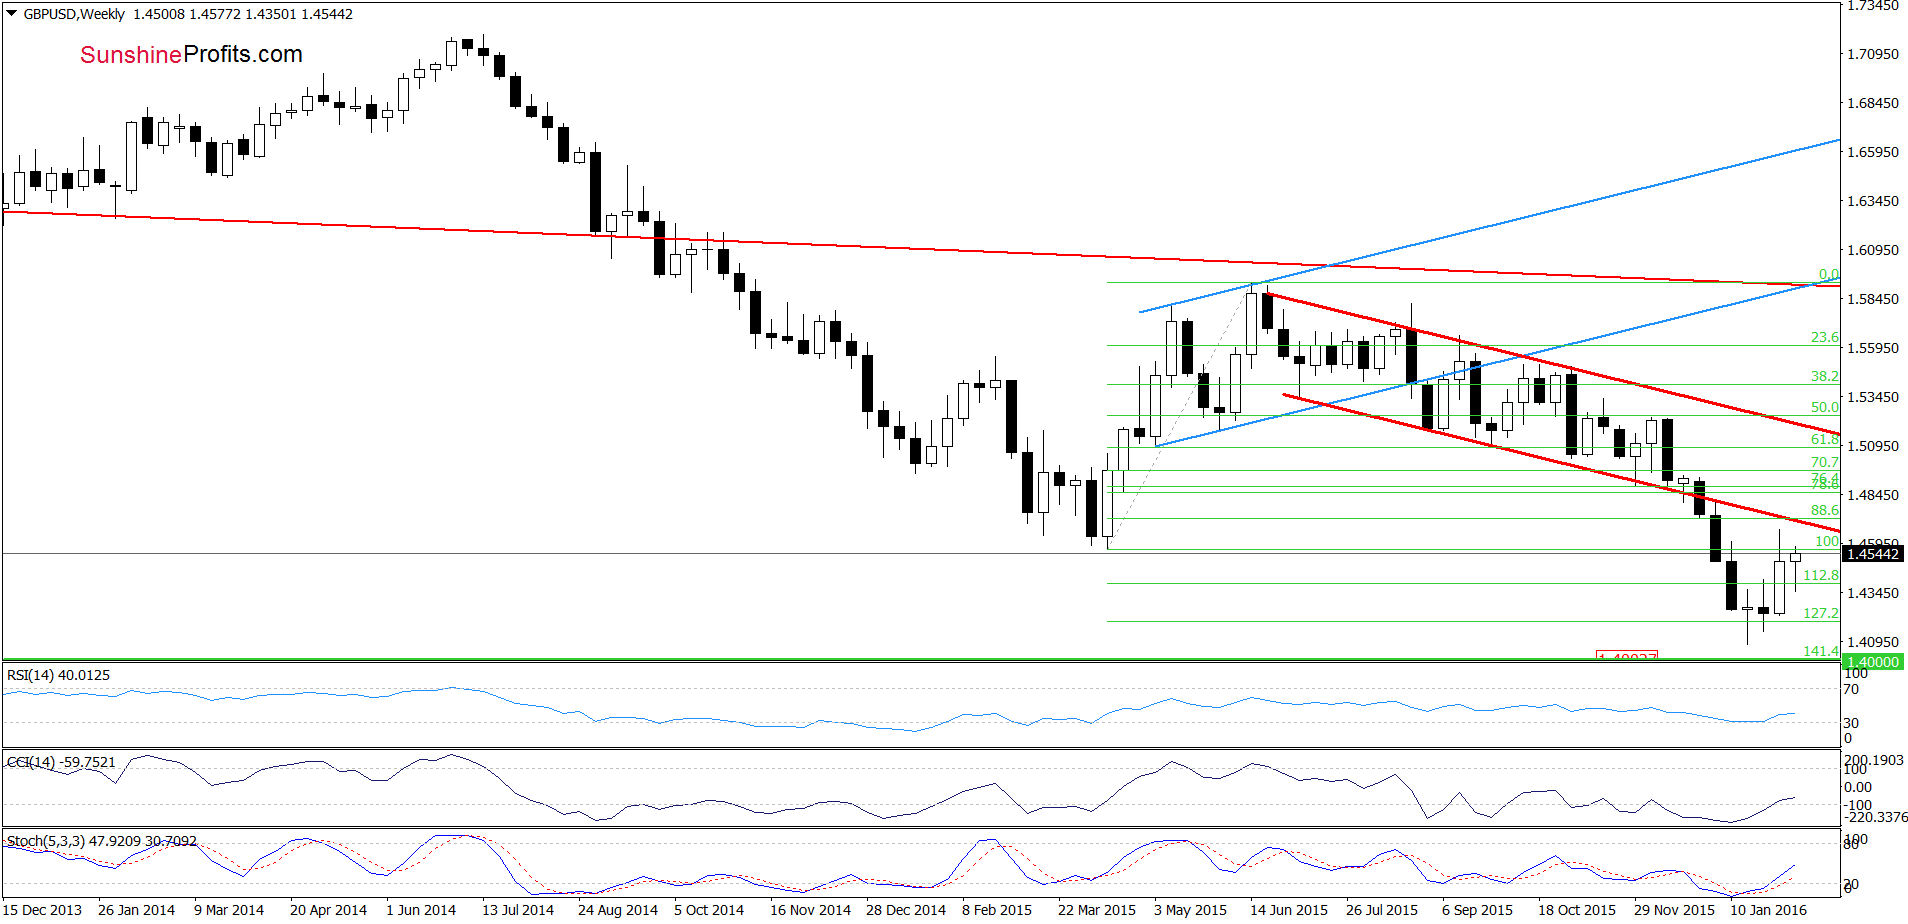
On the daily chart, we see that GBP/USD moved higher earlier today and came back above the previously-broken upper border of the purple rising trend channel. With this move, the pair also climbed above the blue resistance line, which is a positive signal that suggests further improvement. Nevertheless, in our opinion, such price action will be more likely and reliable if the exchange rate closes today’s session above these lines. If we see such price action, the initial upside target would be the 50% Fibonacci retracement level and recent highs. If this area is broken, GBP/USD will test the lower border of the red declining trend channel (marked on the weekly chart below).
Very short-term outlook: mixed with bullish bias
Short-term outlook: mixed
MT outlook: mixed
LT outlook: mixed
Trading position (short-term; our opinion): No positions are justified from the risk/reward perspective at the moment. We will keep you informed should anything change, or should we see a confirmation/invalidation of the above.
USD/CAD
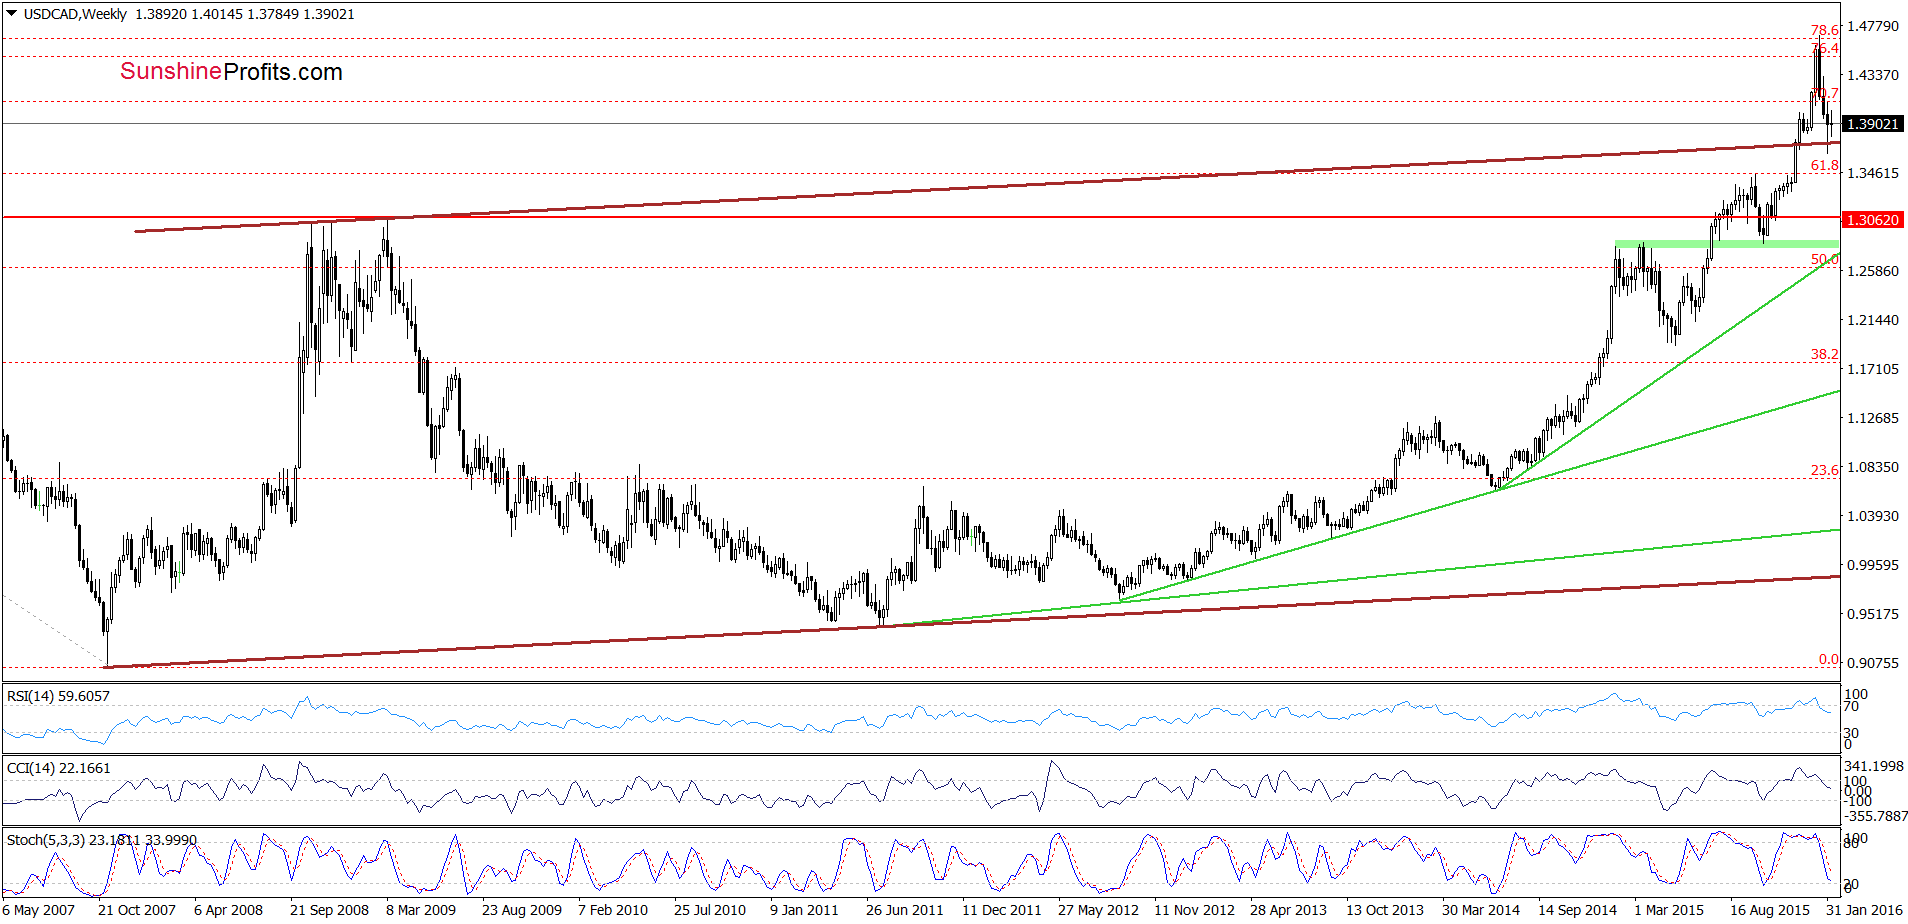
Looking at the weekly chart we see that USD/CAD is still trading above the upper border of the long-term rising trend channel. Today, we’ll focus on the very short-term changes.
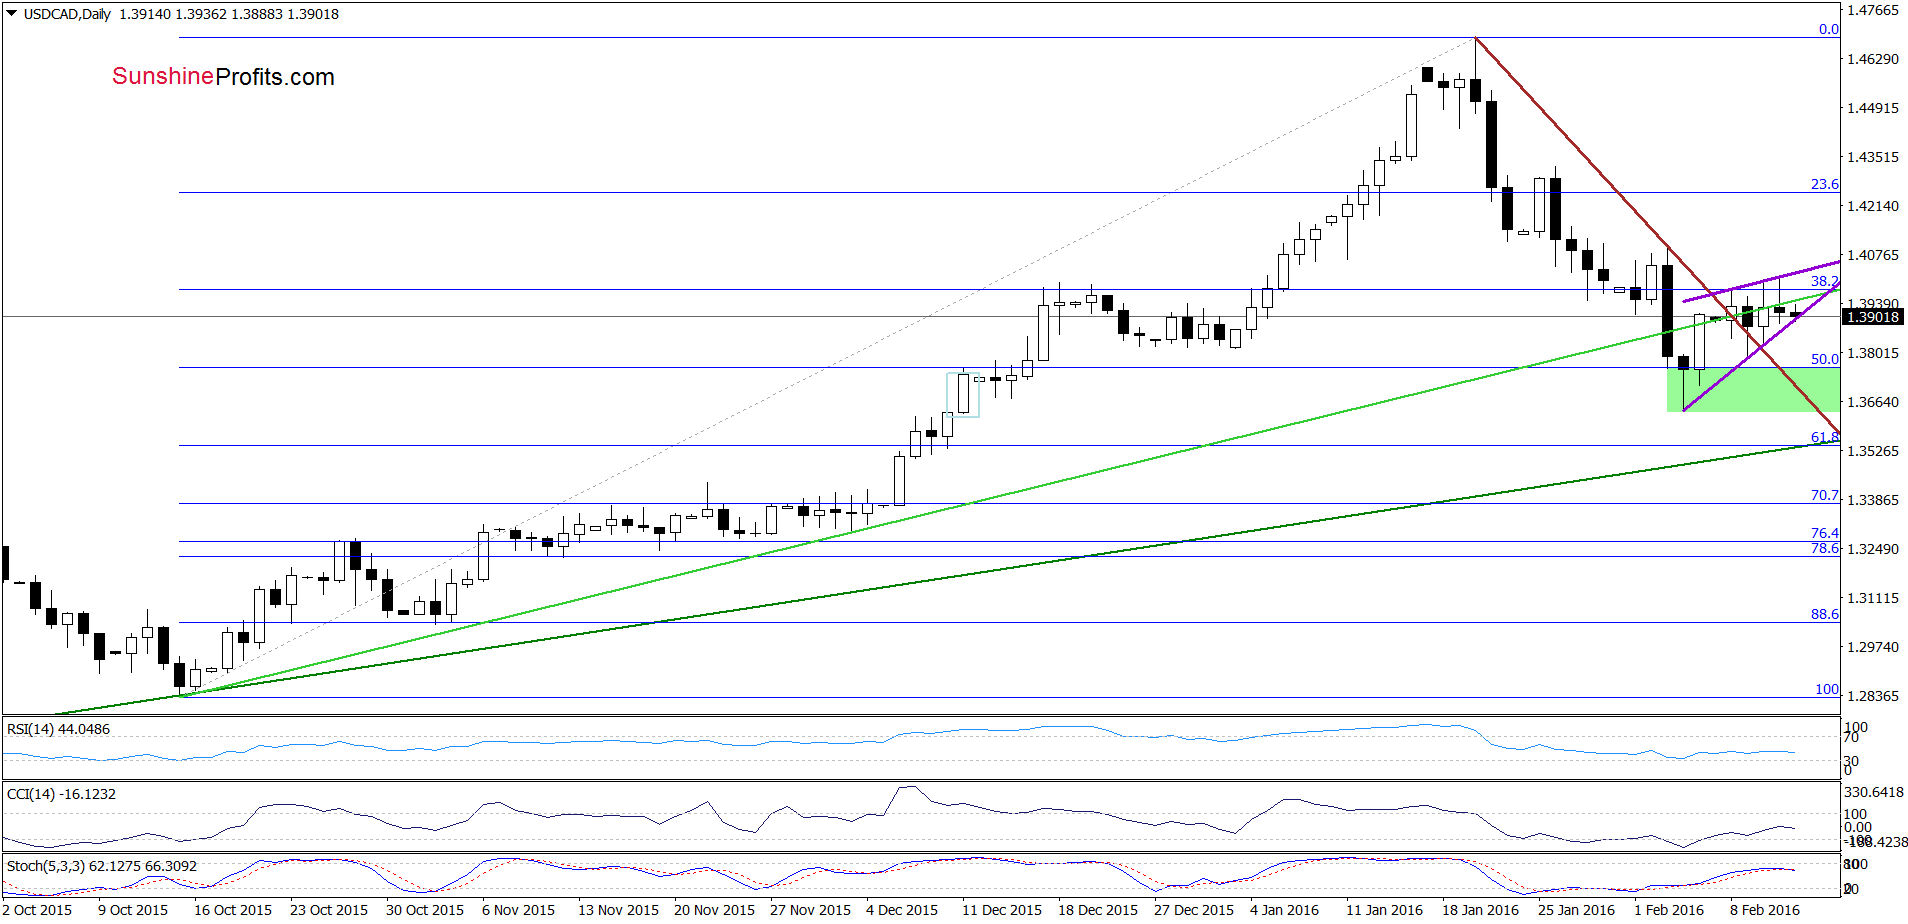
On the daily chart, we see that although USD/CAD moved little higher in previous days (compared to the recent decline) , the pair remains in a purple triangle/rising wedge around the medium-term green support/resistance line. From today’s point of view such price action looks like a flag pattern, which is a bearish signal that suggests further deterioration. If this is the case, and the exchange rate declines under the lower purple line, we’ll see (at least) a test of the green support zone created by the 50% Fibonacci retracement and the Feb low of 1.3637. If this area is broken, the next target for currency bears would be the lower medium-term green line based on the May, Jun and Oct lows (around 1.3541 at the moment), which currently intersects the 61.8% Fibonacci retracement. Finishing today’s commentary on this pair, it is also worth noting that the Stochastic Oscillator is very close to generating a sell signal, which increases the probability of this pro bearish scenario.
Very short-term outlook: mixed with bearish bias
Short-term outlook: mixed
MT outlook: mixed
LT outlook: mixed
Trading position (short-term; our opinion): No positions are justified from the risk/reward perspective at the moment. We will keep you informed should anything change, or should we see a confirmation/invalidation of the above.
On an administrative note, today’s alert is much shorter than our usual Friday’s Forex Trading Alerts. You will find the current technical picture of all our six currency pairs next week. Thank you for understanding.
Thank you.
Nadia Simmons
Forex & Oil Trading Strategist
Forex Trading Alerts
Oil Investment Updates
Oil Trading Alerts

