

Yesterday, the USD Index declined sharply and reached the level of 97. With this downswing, the index dropped under the Dec lows, which encouraged currency bears to push the greenback lower earlier today. As a result, the U.S. dollar declined to an intraday low of 96.65. How did this sharp downward move affect our six currency pairs? Let’s examine charts and find out.
In our opinion the following forex trading positions are justified - summary:
EUR/USD
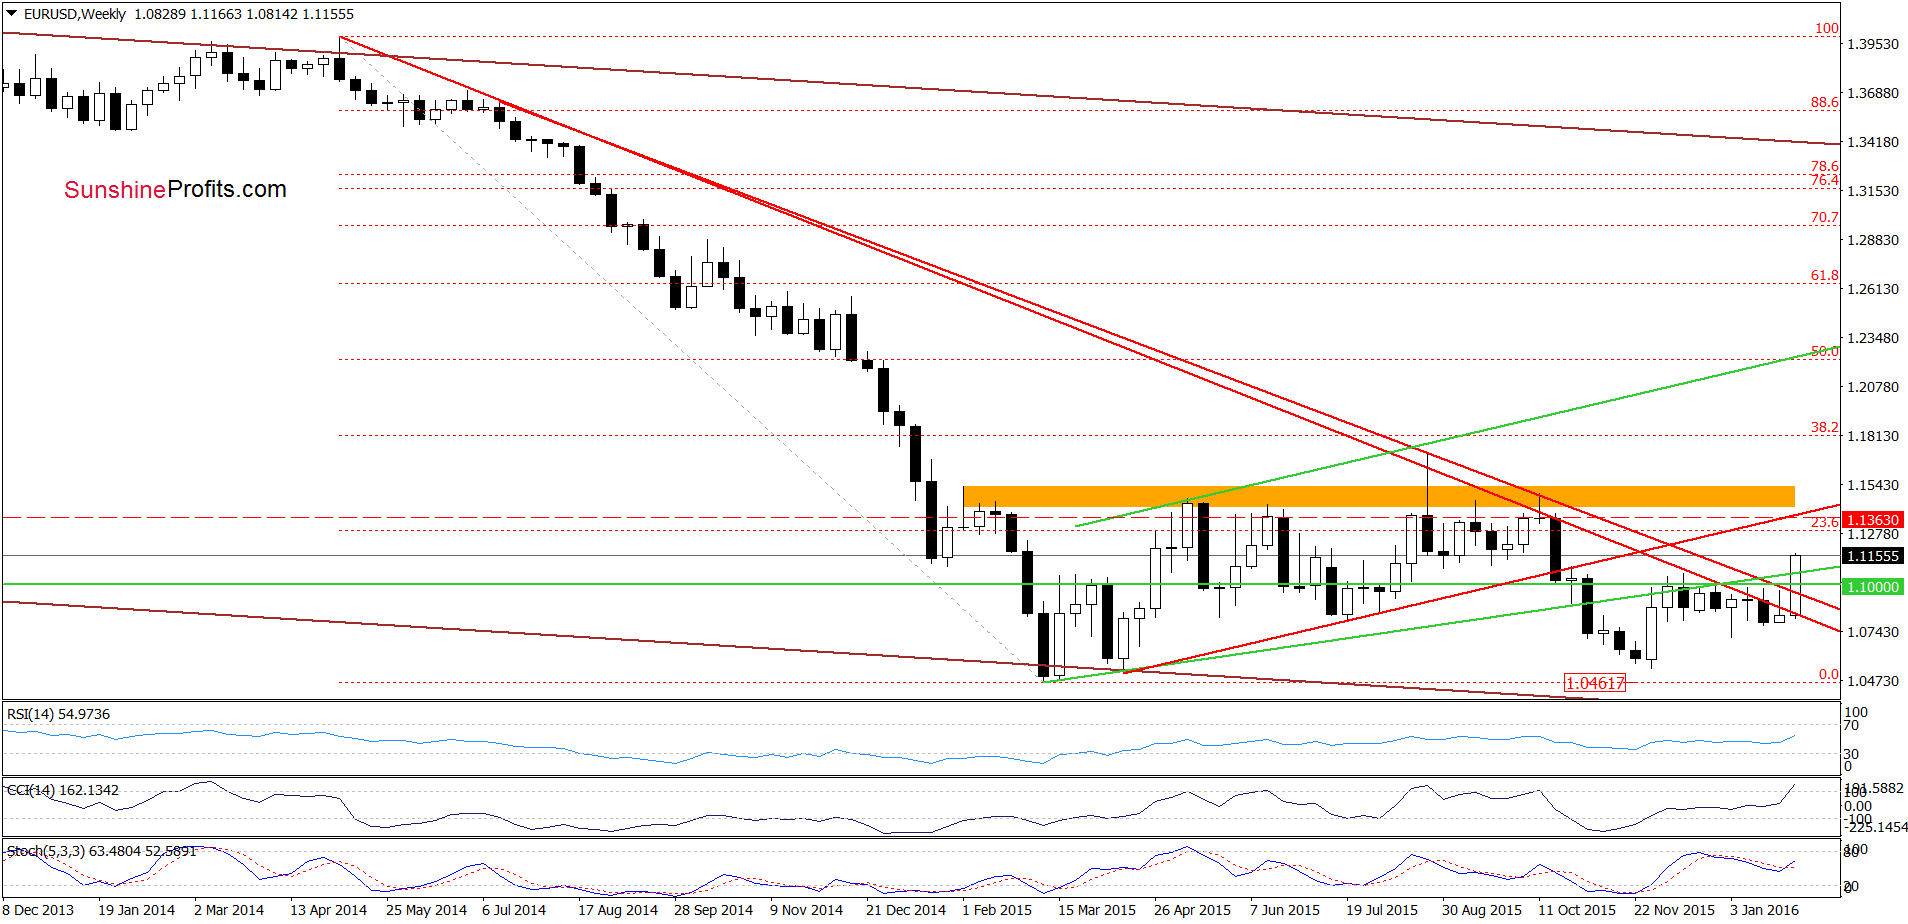
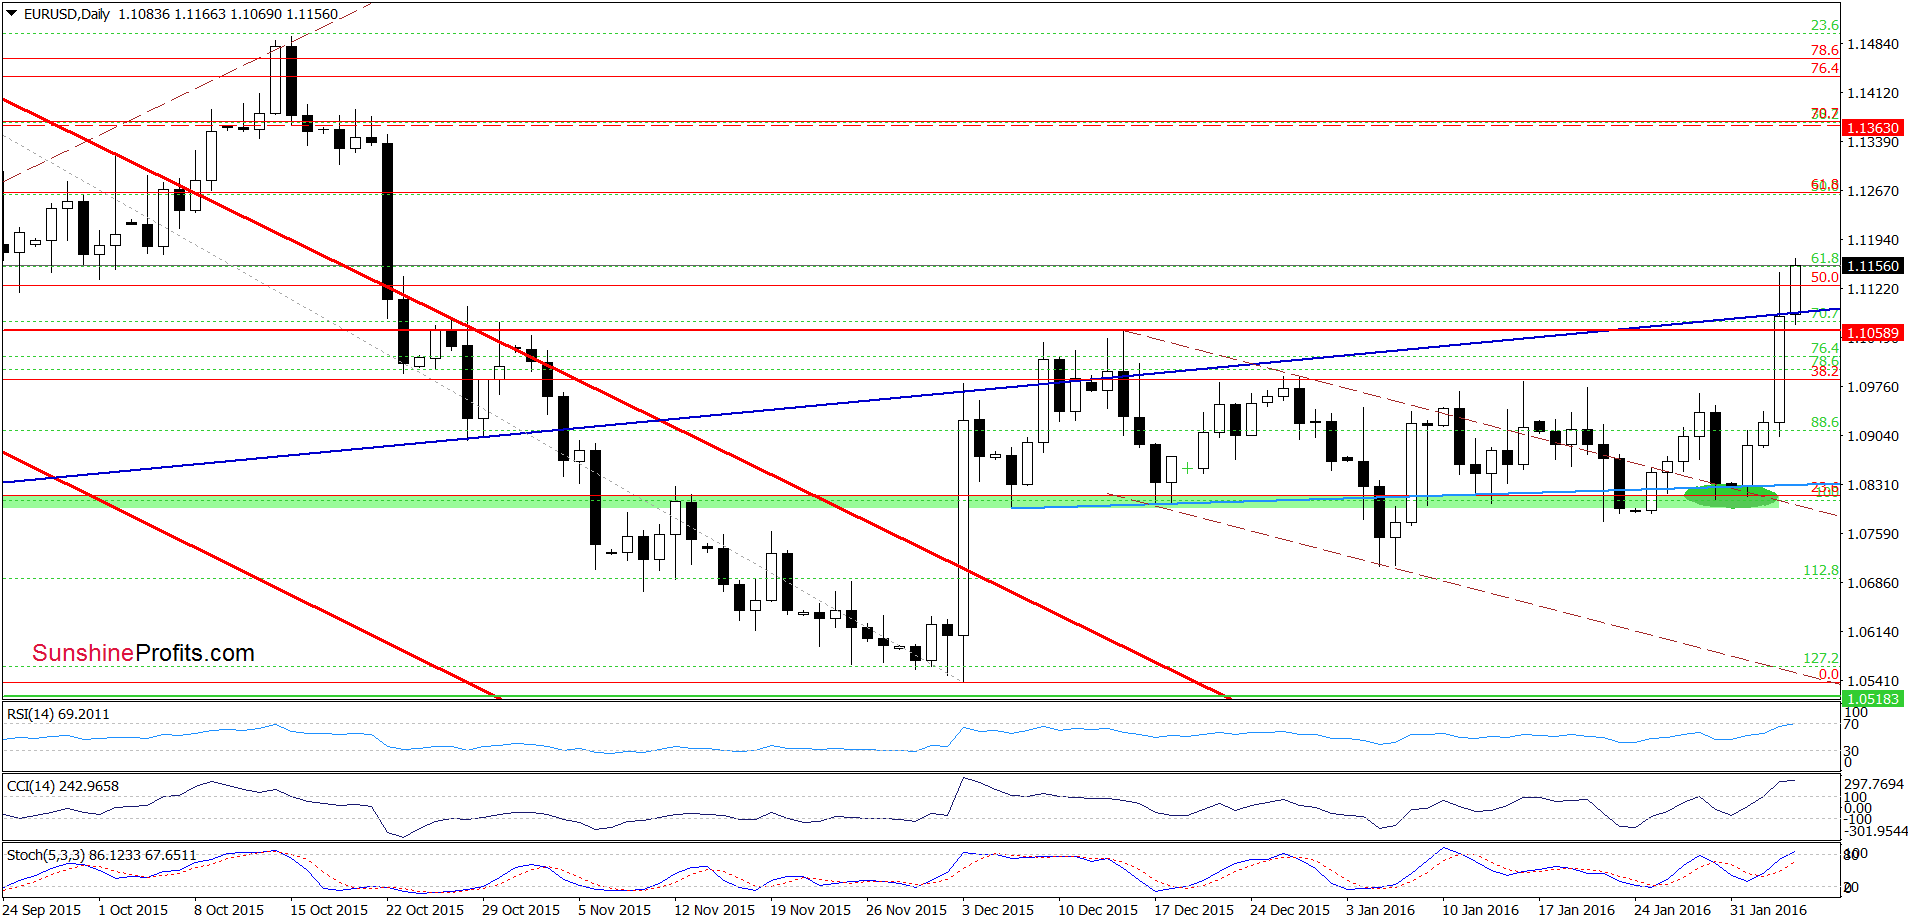
Yesterday, EUR/USD broke not only above the mid-Dec highs, but also climbed above the medium-term green resistance line, which suggests that the exchange rate could increase to the 61.8% Fibonacci retracement based on the Aug-Dec decline (around 1.1261) or even to the red resistance line based on the Apr, Jul and Aug lows (marked on the weekly chart; currently around 1.1363). Therefore, in our opinion, closing short positions is justified from the risk/reward perspective. We will keep monitoring the market and will report to you once the risk to reward ratio once again favors opening a position in EUR/USD. This will probably take place at higher prices and it will probably once again be a short position, but this may change as the situation develops. We’ll keep you informed.
Very short-term outlook: bullish
Short-term outlook: mixed with bullish bias
MT outlook: mixed
LT outlook: mixed
Trading position (short-term; our opinion): No positions are justified from the risk/reward perspective at the moment. We will keep you informed should anything change, or should we see a confirmation/invalidation of the above.
GBP/USD
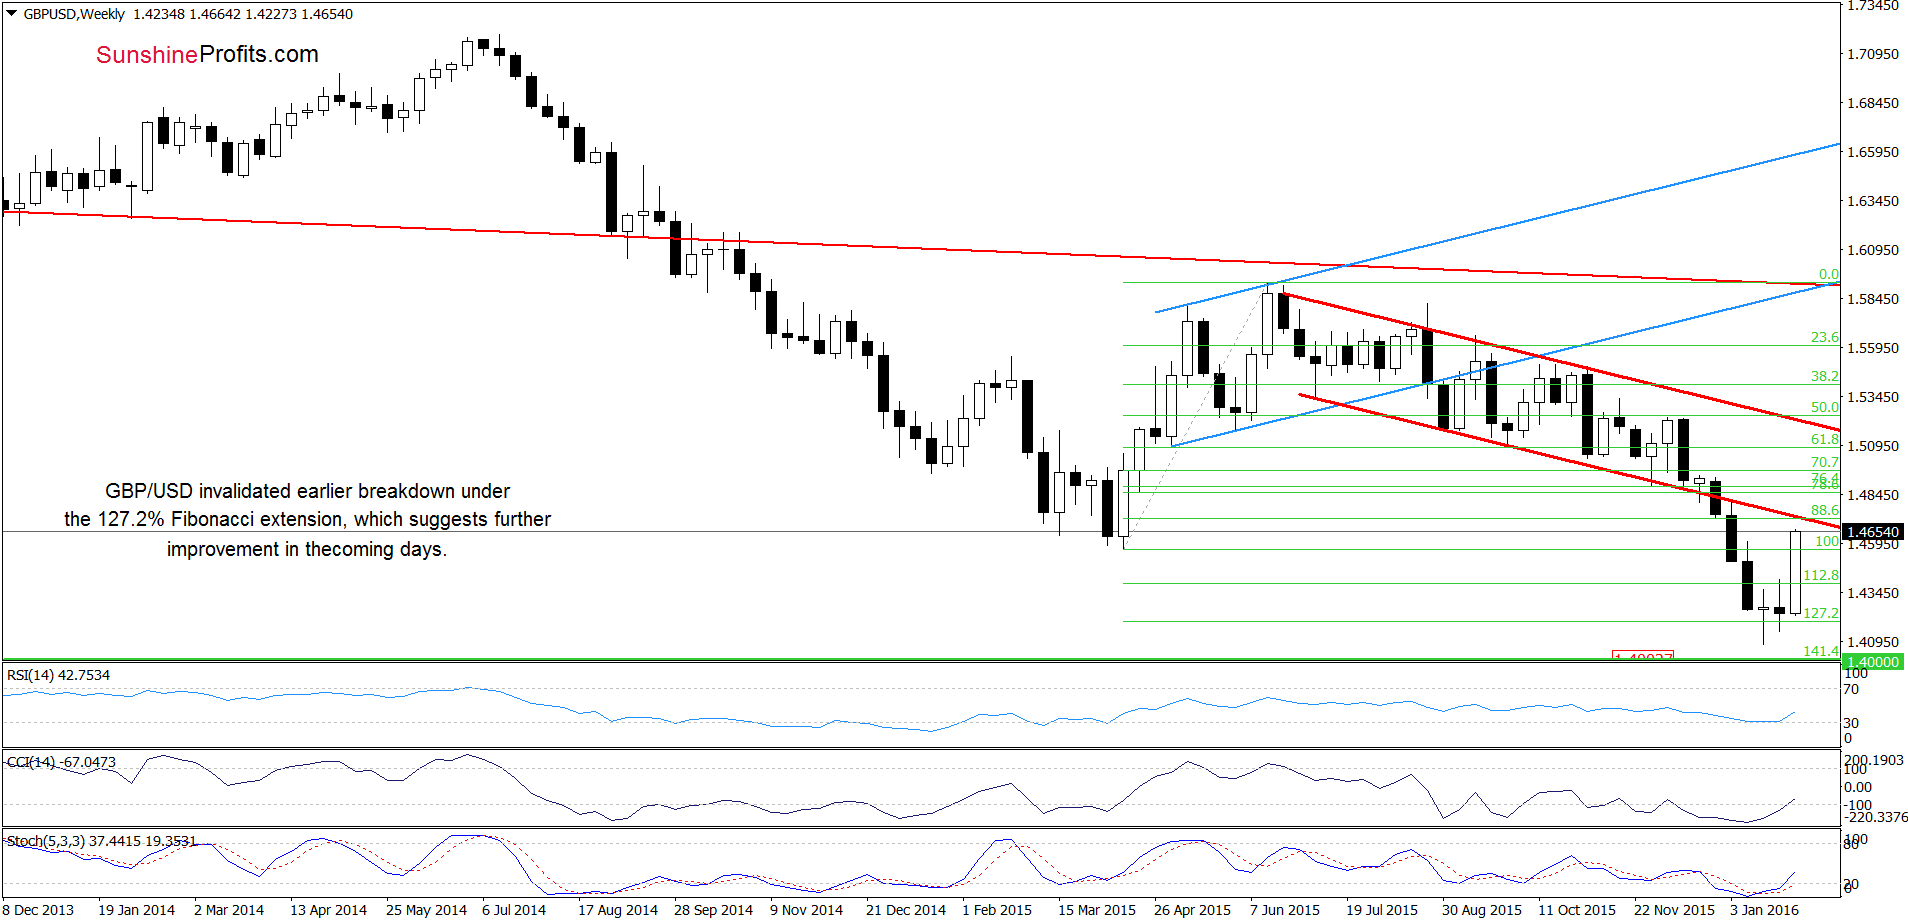
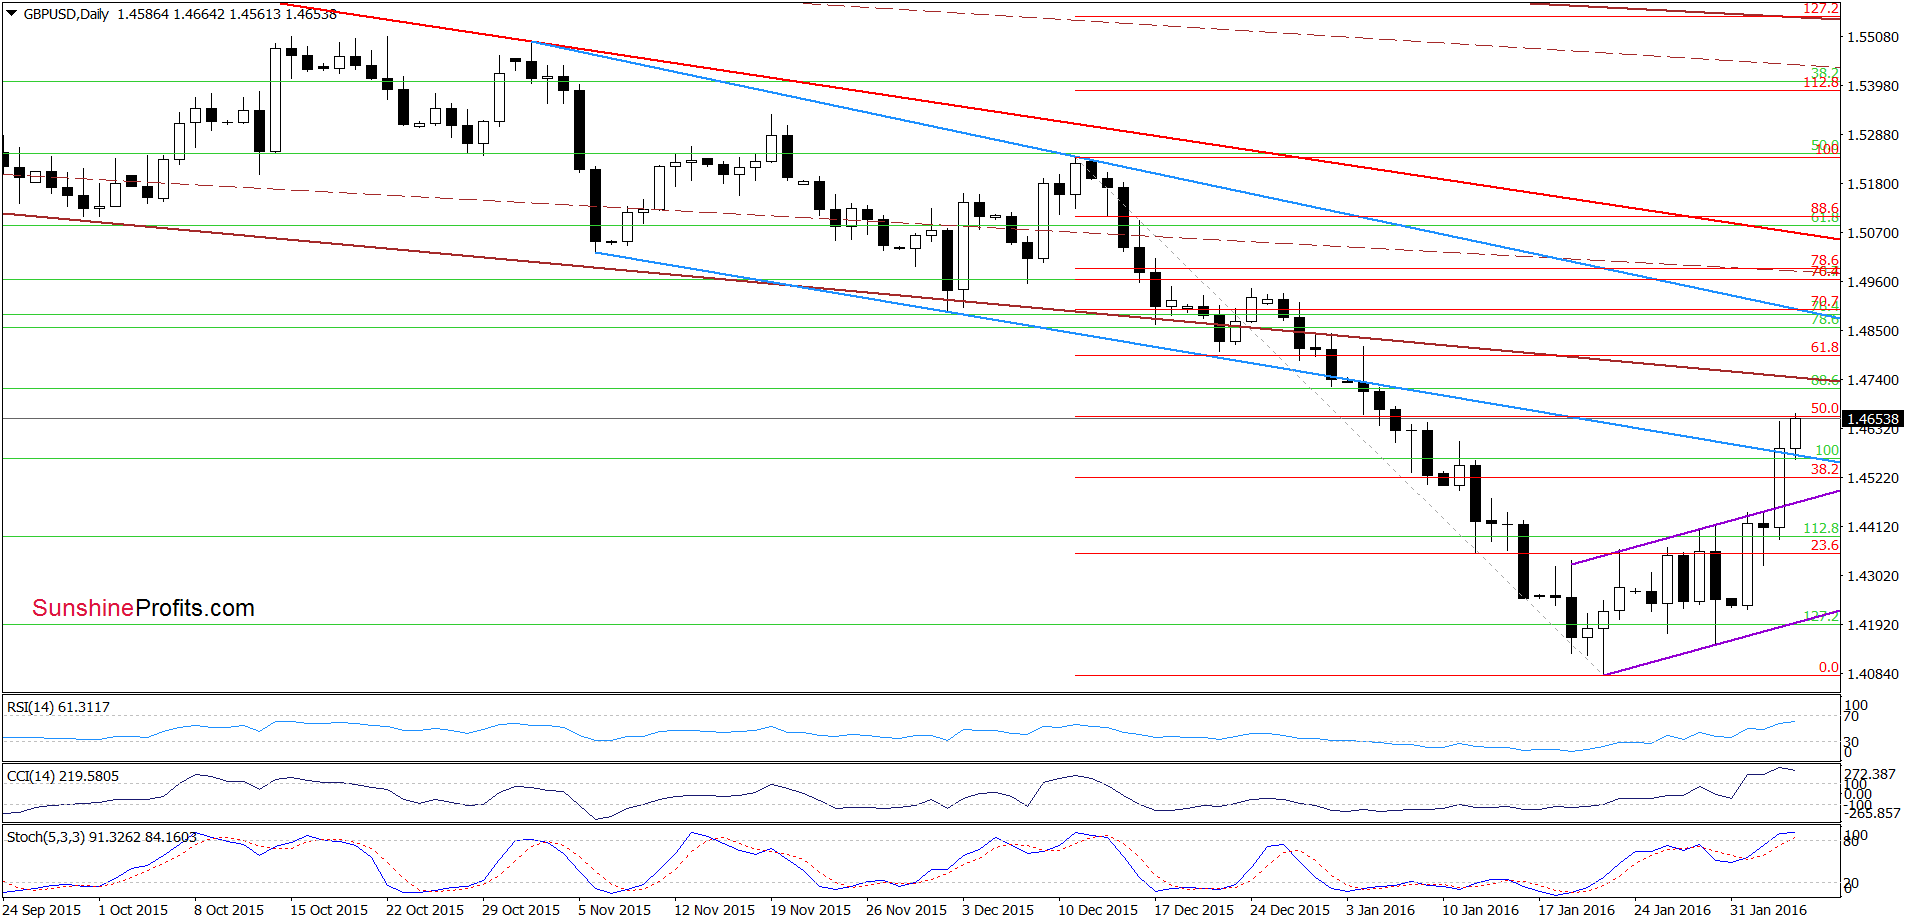
Looking at the daily chart, we see that GBP/USD broke above the upper border of the very short-term rising trend channel, which triggered a sharp rebound. With this upward move, the pair climbed above the blue resistance line, which suggests an increase to the lower border of the red declining trend channel (marked on the weekly chart) in the coming days (currently around 1.4740).
Very short-term outlook: mixed with bullish bias
Short-term outlook: mixed with bullish bias
MT outlook: mixed
LT outlook: mixed
Trading position (short-term; our opinion): No positions are justified from the risk/reward perspective at the moment. We will keep you informed should anything change, or should we see a confirmation/invalidation of the above.
USD/JPY
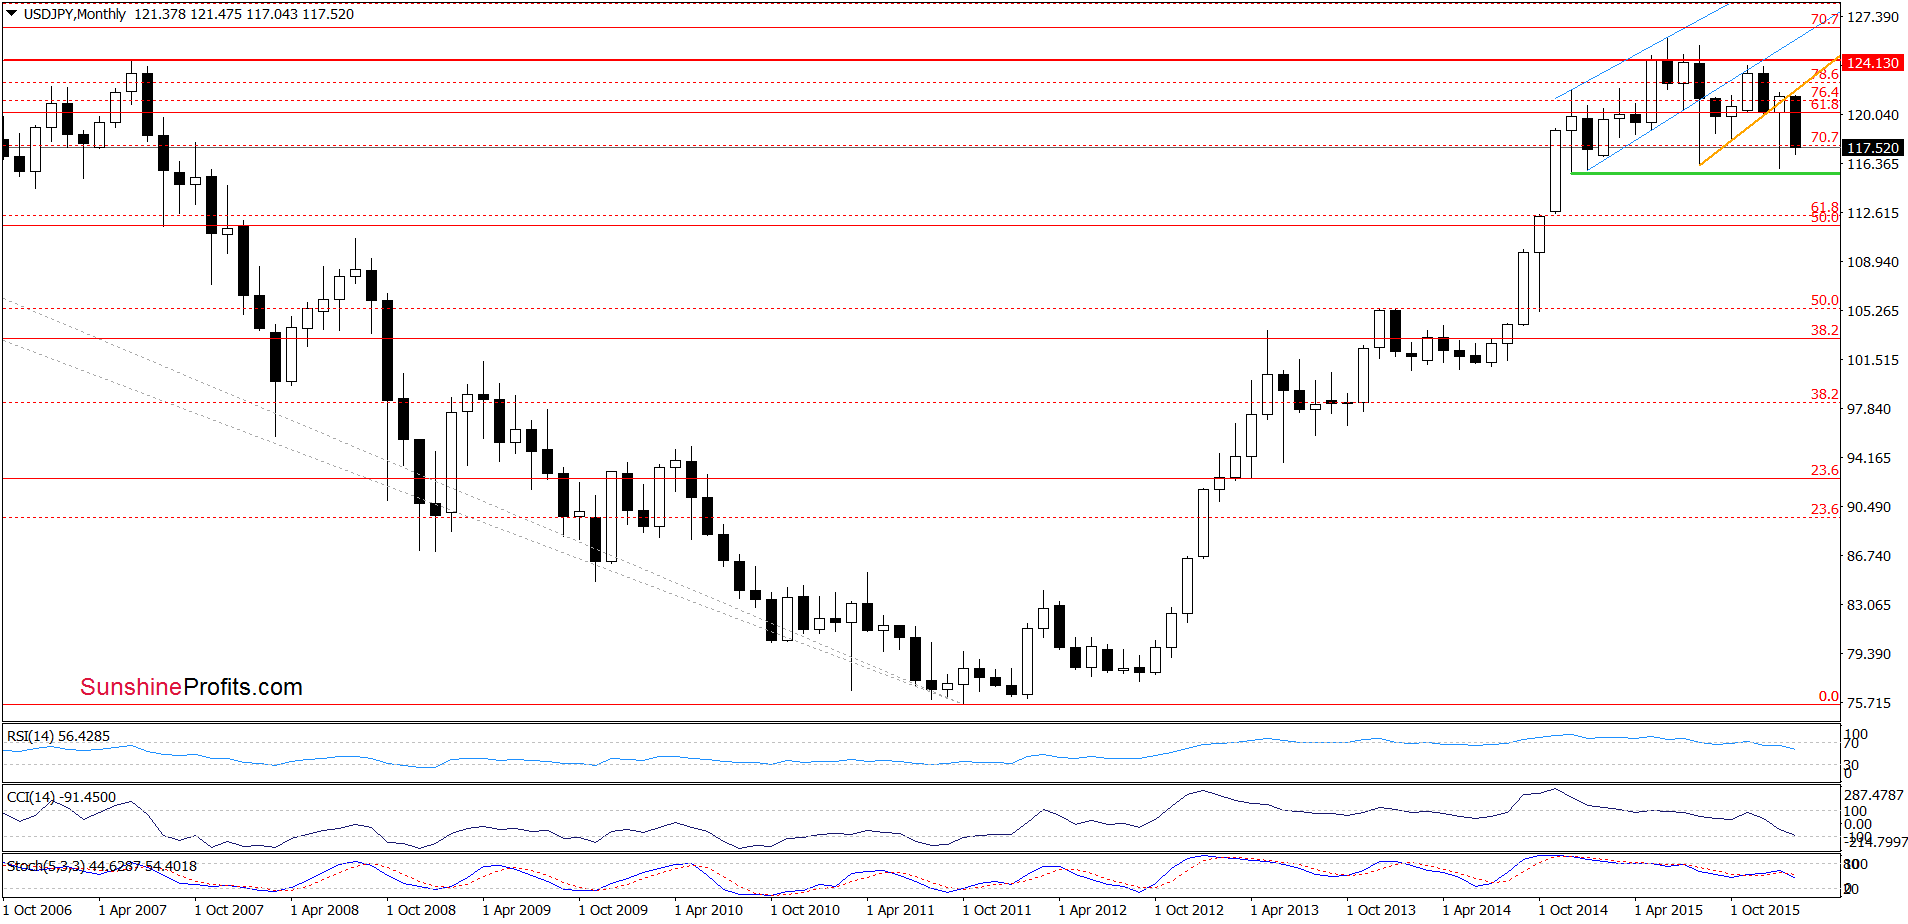
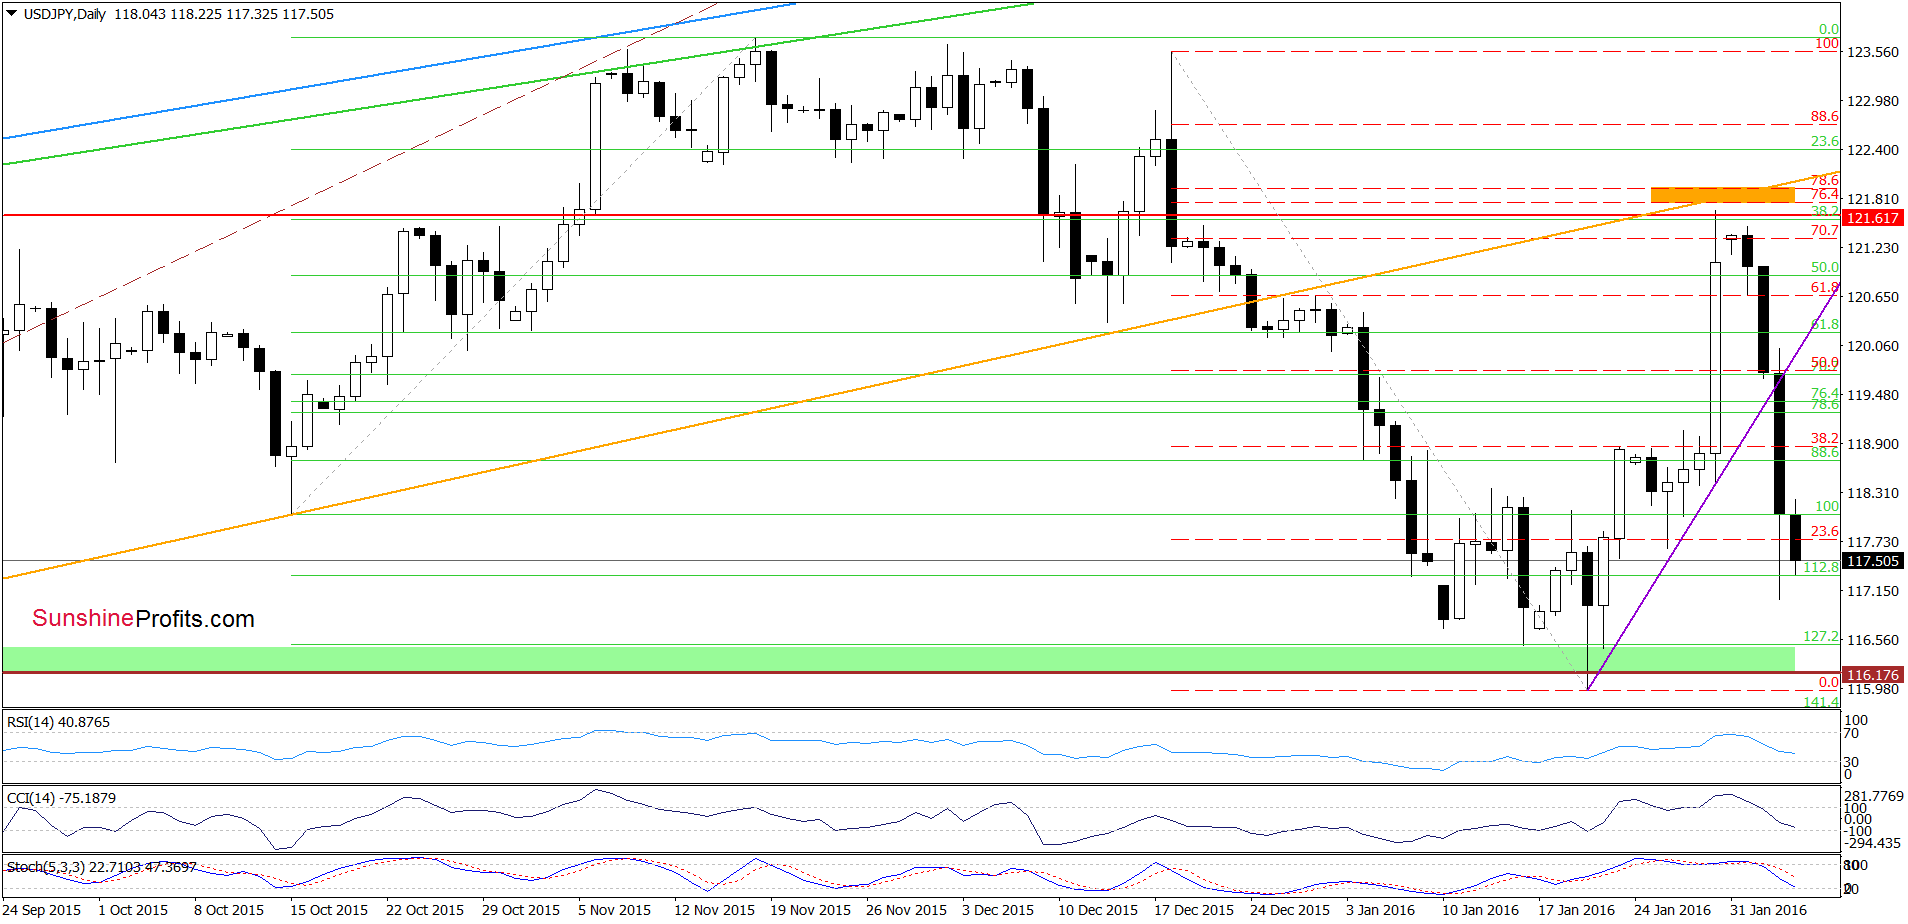
On the long-term chart, we see that the orange resistance line triggered a correction of the recent upward move. How did this drop affect the very short-term picture? Let’s check.

On Tuesday, we wrote the following:
(…) the exchange rate gave up some gains. Taking this fact into account, and combining it with the long-term picture and the current position of the indicators (the CCI and Stochastic Oscillator are very close to generating sell signals), it seems that further deterioration is just around the corner. If this is the case, and the exchange rate extends losses, we may see a test of the purple rising support line in the coming days.
As you see on the daily chart, currency bears not only took the pair to the purple support line, but also managed to push USD/JPY below it, which resulted in a sharp decline. Taking into account the size of yesterday’s drop and sell signals generated by the indicators, it seems that the exchange rate will test the green support zone in near future.
Very short-term outlook: bearish
Short-term outlook: mixed with bearish bias
MT outlook: mixed
LT outlook: mixed
Trading position (short-term; our opinion): No positions are justified from the risk/reward perspective at the moment. We will keep you informed should anything change, or should we see a confirmation/invalidation of the above.
USD/CAD
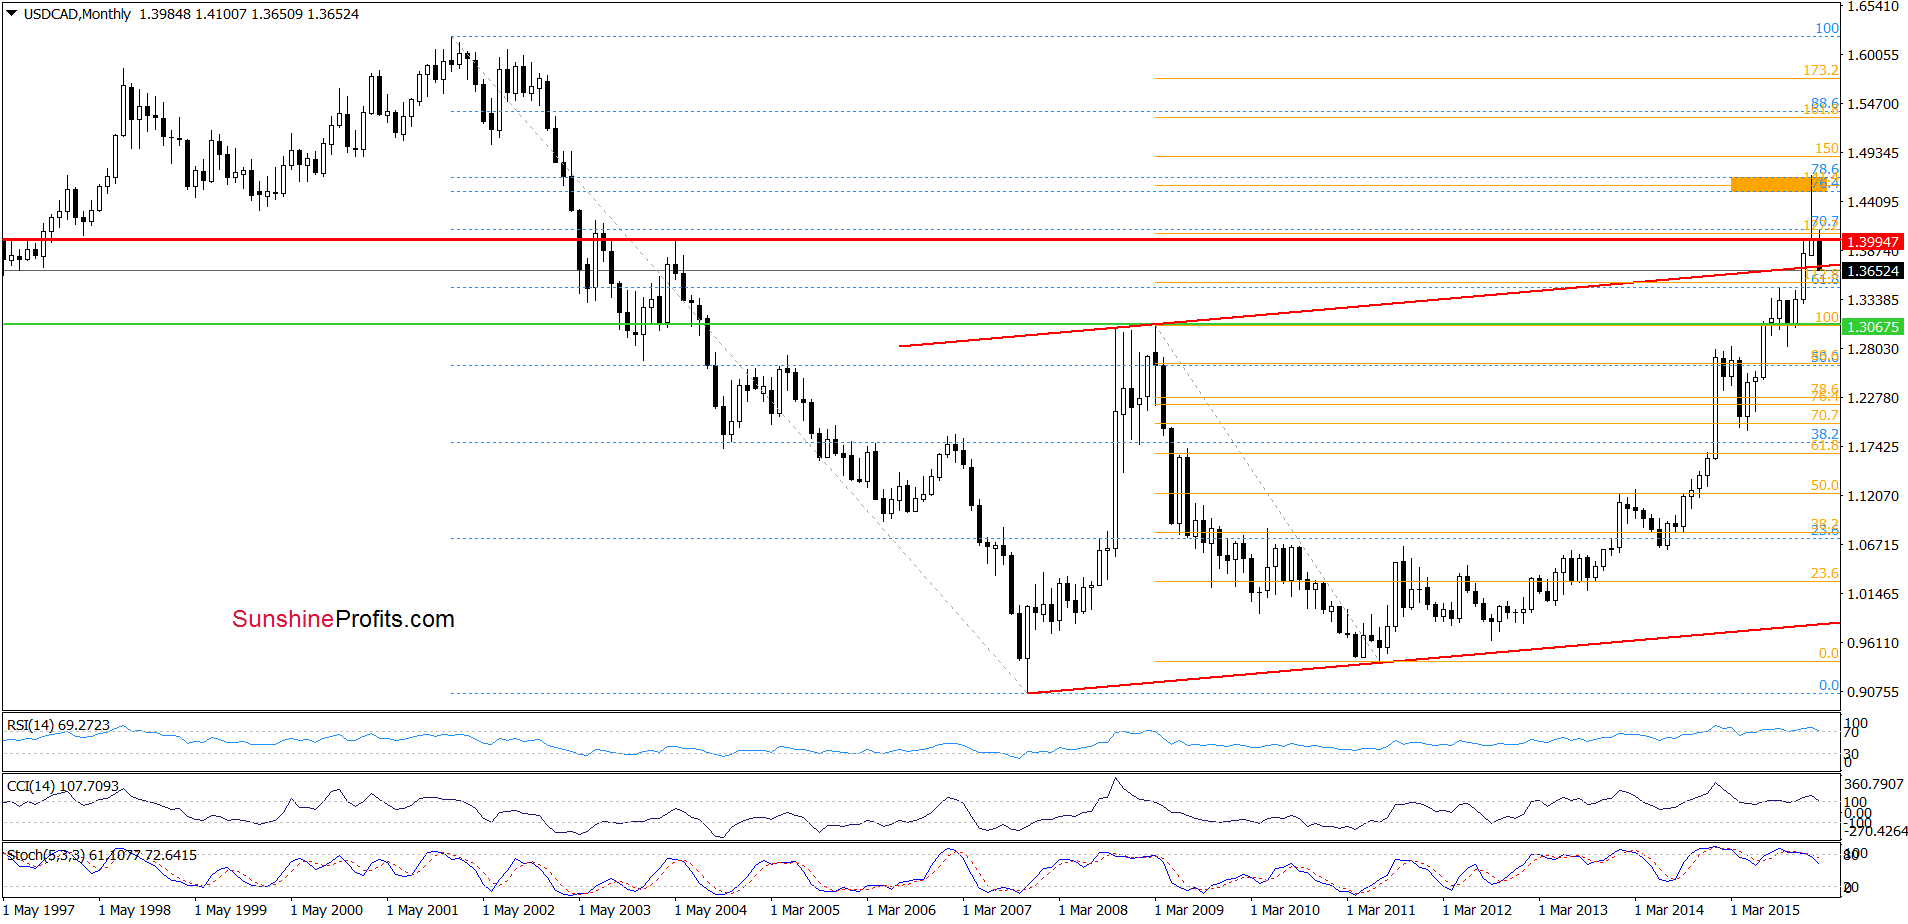
On the above chart, we see that USD/CAD declined below the May 2004 high (marked with red horizontal line), which resulted in further deterioration and a drop under the previously-broken upper border of the red rising trend channel. This is a bearish signal, which suggests further deterioration.
What impact did this move have on the very short-term picture? Let’s check.
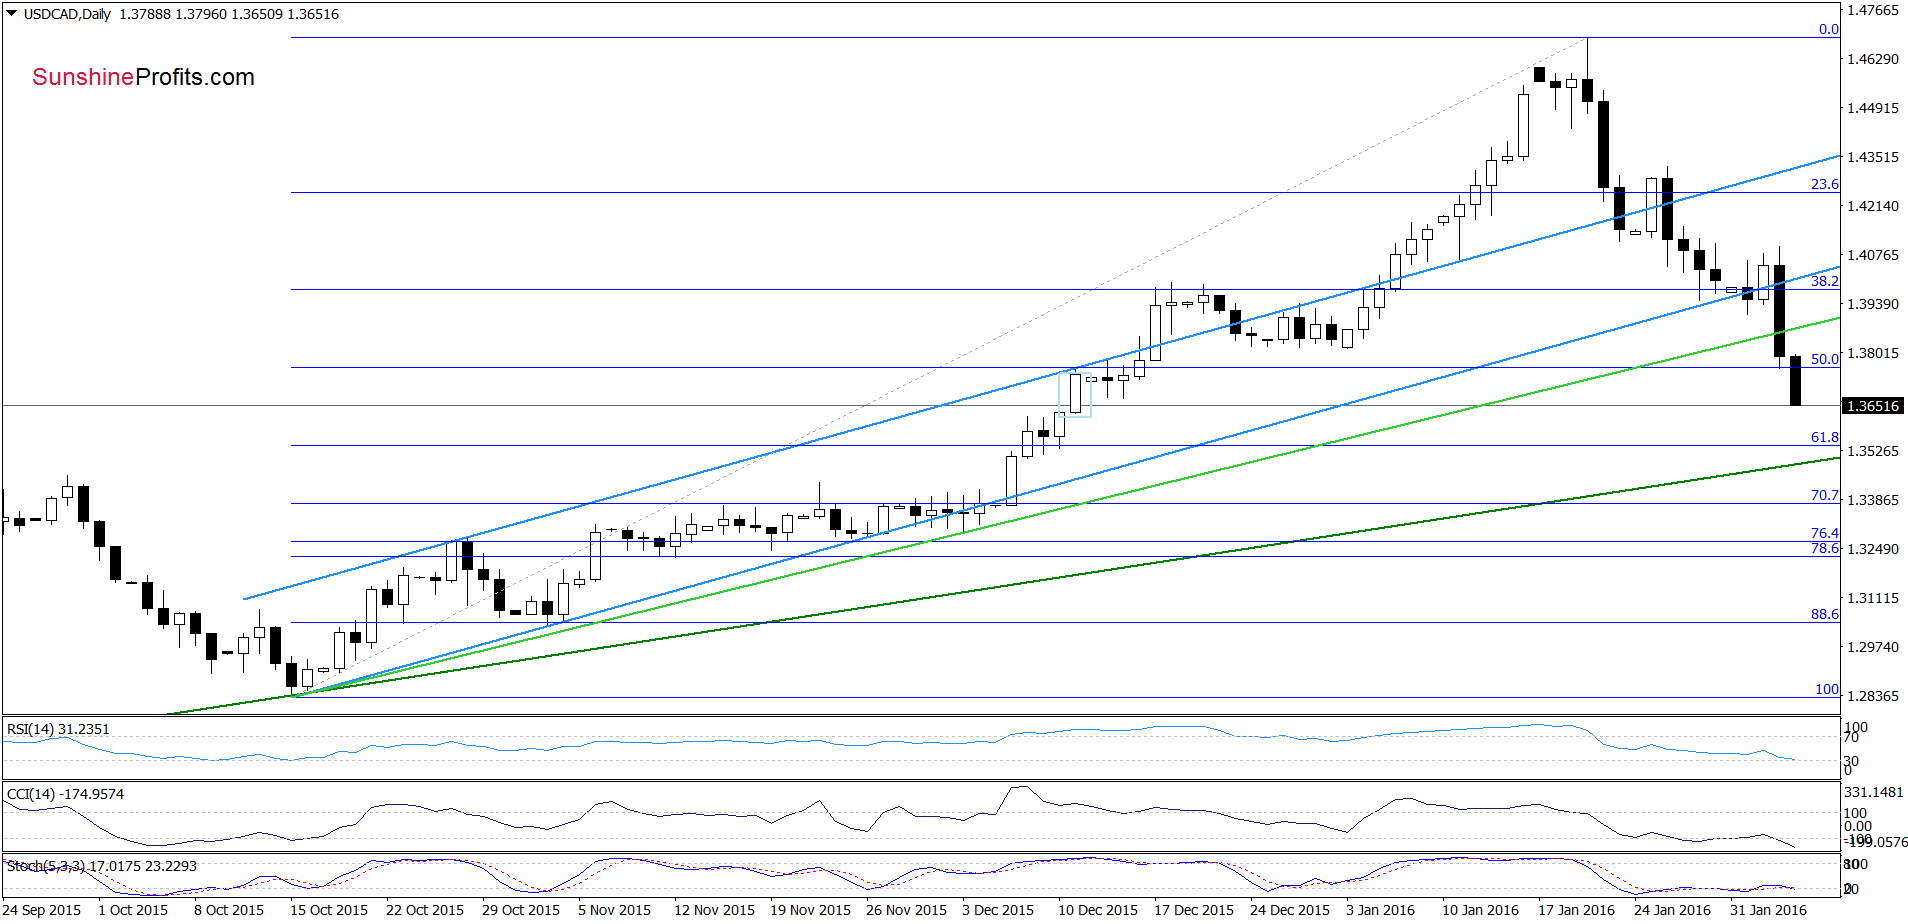
On the daily chart, we see that USD/CAD broke below the lower border of the blue trend channel, which triggered a sharp decline and took the pair under the green support line based on the mid-Oct and Dec lows (thanks to the stop-loss order our short positions were closed, which protected trading capital and resulted in a relatively small loss). With yesterday’s move the exchange rate reached the 50% Fibonacci retracement (based on the entire Oct-Jan rally), but currency bears pushed the pair below it earlier today. Taking these negative signals into account, we think that the pair will extend losses and drop to the 61.8% Fibonacci retracement (around 1.3545) or even test the next green support line (currently at 1.3490).
Very short-term outlook: bearish
Short-term outlook: mixed with bearish bias
MT outlook: mixed
LT outlook: mixed
Trading position (short-term; our opinion): No positions are justified from the risk/reward perspective at the moment. We will keep you informed should anything change, or should we see a confirmation/invalidation of the above.
USD/CHF
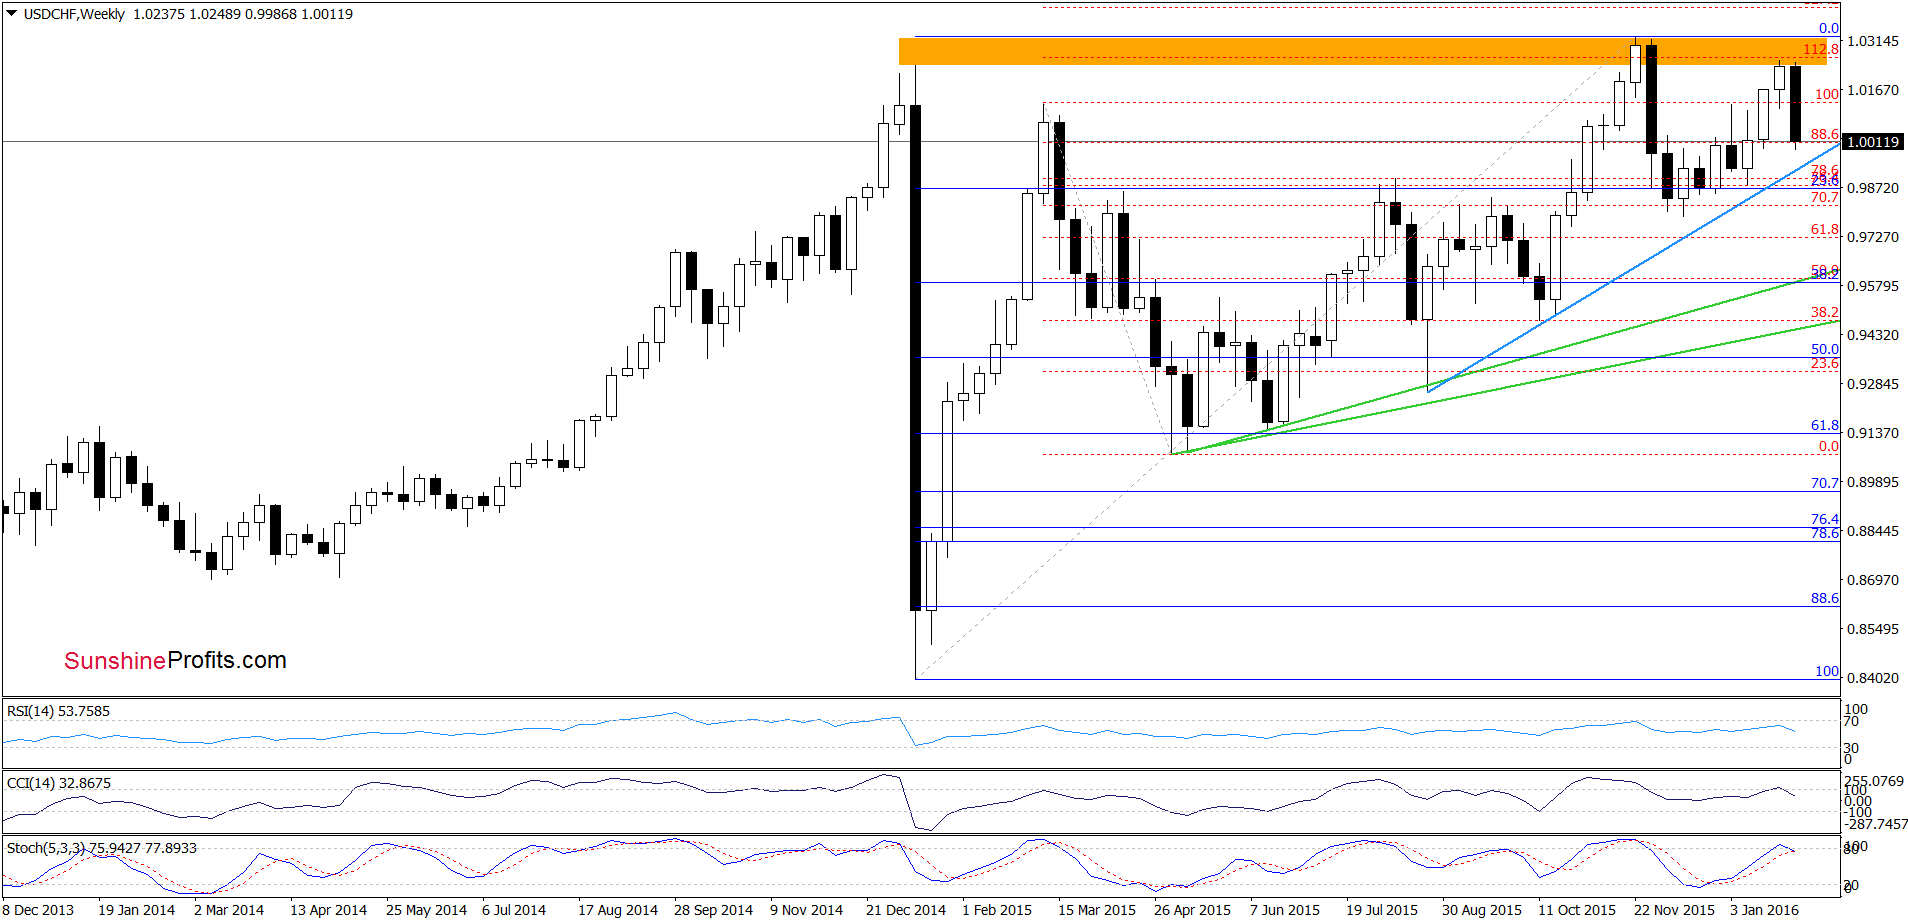
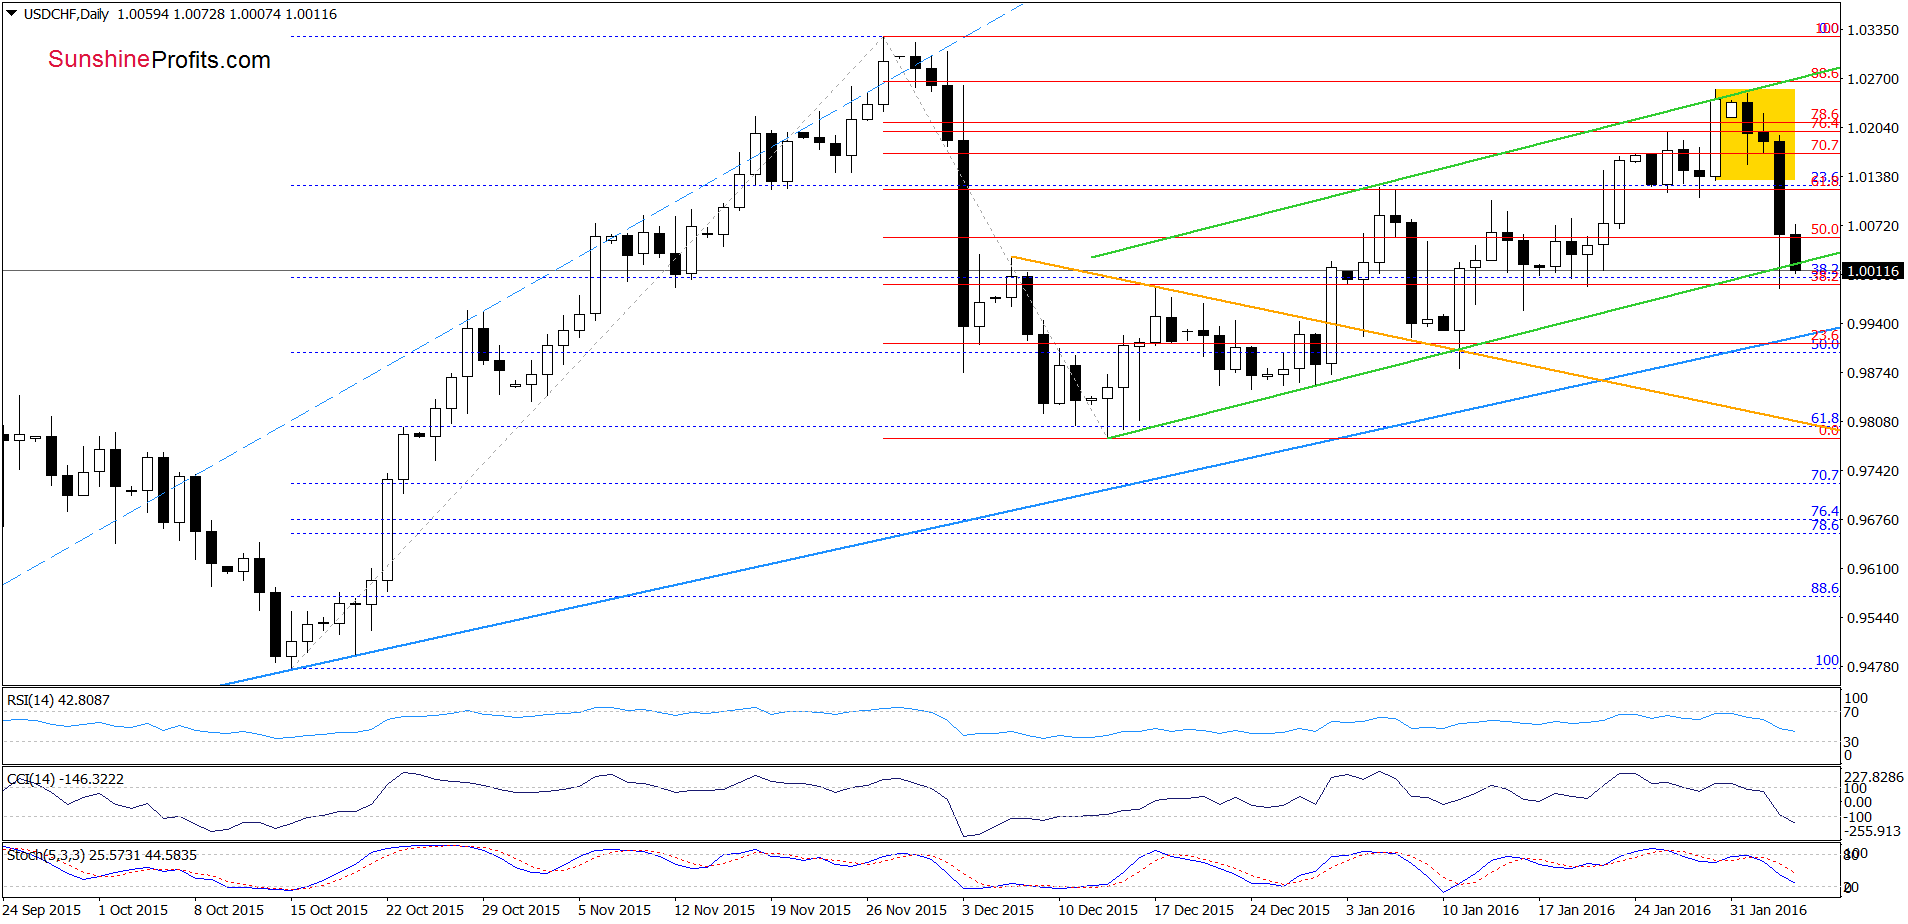
Yesterday, we wrote:
(…) the orange resistance zone (marked on the weekly chart) triggered a decline which took the exchange rate below the lower border of the yellow consolidation. Taking this fact into account, and combining it with sell signals generated by the indicators, we think that the pair will test the lower border of the green rising trend channel in the coming days.
As you see on the daily chart, currency bears took the pair to our downside target yesterday. Earlier today, USD/CHF moved lower once again (after a small rebound) and came back under the green line, which suggests that the exchange rate may test the blue support line based on the Aug and Oct lows (marked on the weekly chart; currently at 0.9922) in the coming days.
Very short-term outlook: bearish
Short-term outlook: mixed with bearish bias
MT outlook: mixed
LT outlook: mixed
Trading position (short-term; our opinion): No positions are justified from the risk/reward perspective at the moment. We will keep you informed should anything change, or should we see a confirmation/invalidation of the above.
AUD/USD
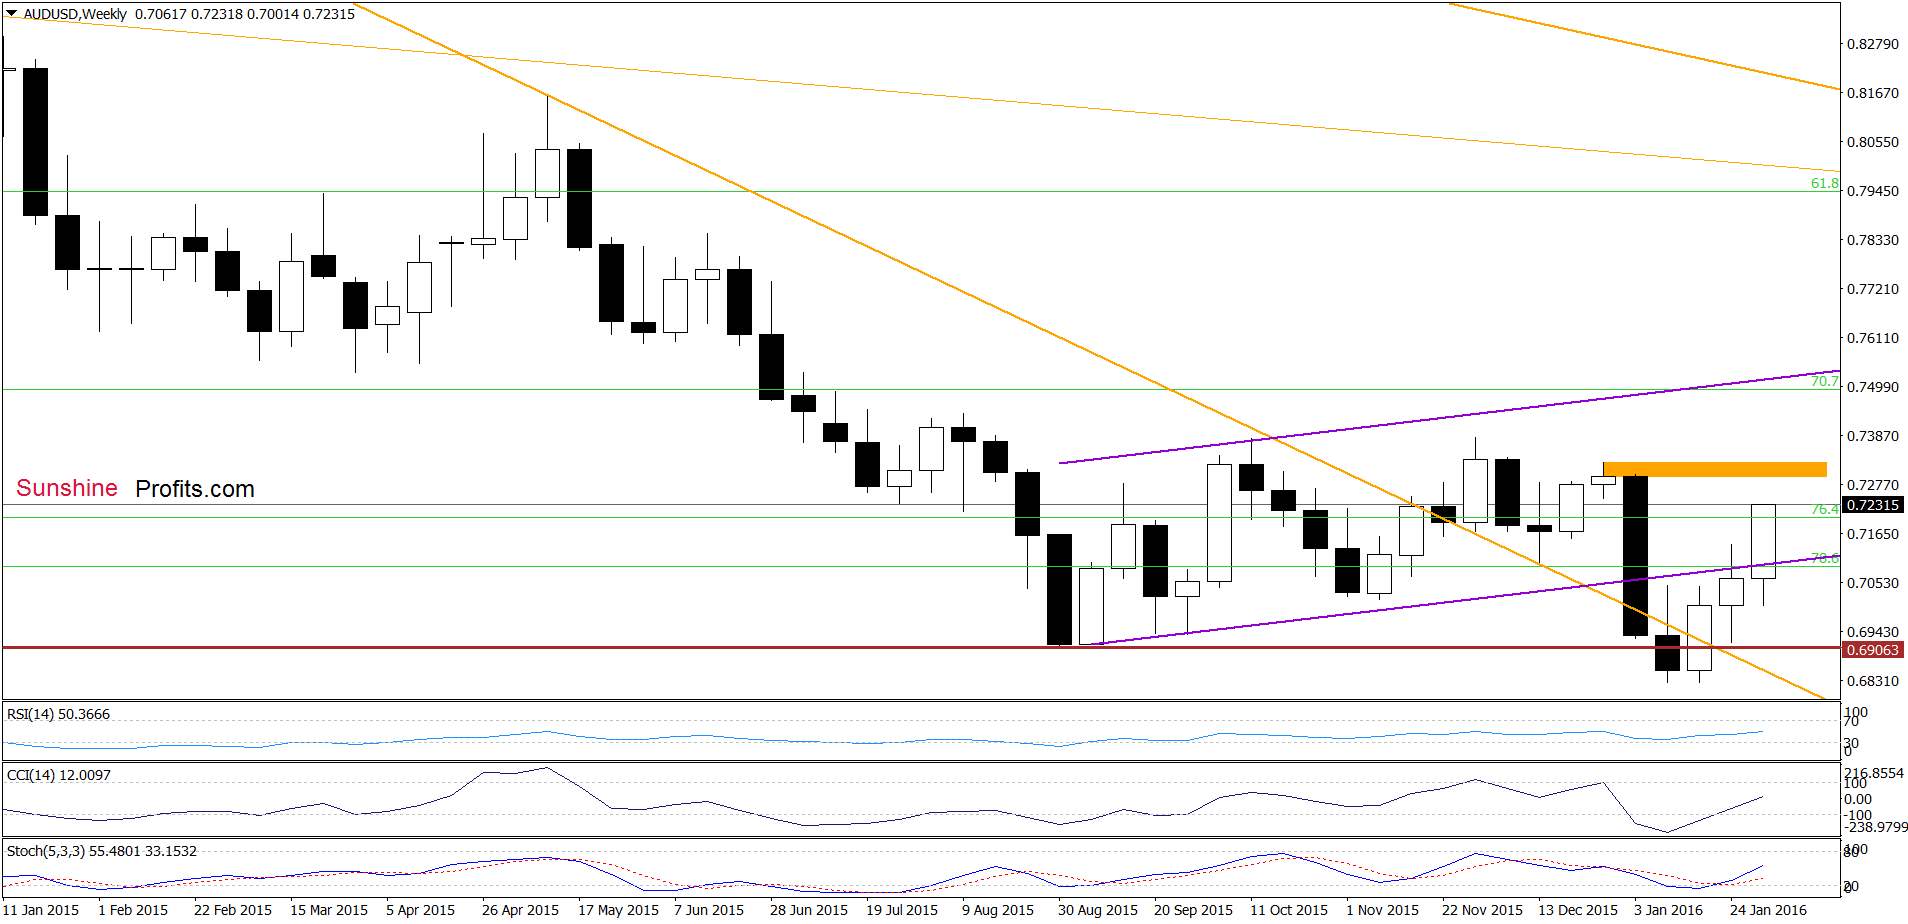
The first thing that catches the eye on the weekly chart is an invalidation of the breakdown under the lower border of the purple rising trend channel. This is a bullish sign, which suggests that we may see further improvement and an increase to the range resistance zone based on the Dec and Jan highs (around 0.7298-0.7325).
Having said that, let’s check how yesterday’s increase affect the daily chart.
Looking at the above chart, we see that AUD/USD extended gains and climbed above previous highs. This improvement encouraged currency bulls to act, which resulted in a rally above the green resistance line. Taking this fact and the medium-term picture into account, we think that the pair will increase to the resistance zone based on the 76.4% and 78.6% Fibonacci retracement. If this area is broken, the next upside target would be the orange zone marked on the weekly chart.
Very short-term outlook: bullish
Short-term outlook: mixed with bullish bias
MT outlook: mixed
LT outlook: mixed
Trading position (short-term; our opinion): No positions are justified from the risk/reward perspective. We will keep you informed should anything change, or should we see a confirmation/invalidation of the above.
Thank you.
Nadia Simmons
Forex & Oil Trading Strategist
Przemyslaw Radomski, CFA
Founder, Editor-in-chief
Gold & Silver Trading Alerts
Forex Trading Alerts
Oil Investment Updates
Oil Trading Alerts

