

Earlier today, official data showed that China’s manufacturing purchasing managers’ index dropped to 49.4 in the previous month, which renewed worries over a slowdown in the world’s second biggest economy and pushed the Australian dollar lower against its U.S. counterpart (China is Australia’s biggest export partner). Will the exchange rate extend losses in the coming week?
In our opinion the following forex trading positions are justified - summary:
- EUR/USD: short (stop-loss order at 1.1363; initial downside target at 1.0462)
- GBP/USD: none
- USD/JPY: none
- USD/CAD: long (stop-loss order at 1.3792; initial upside target at 1.4512)
- USD/CHF: none
- AUD/USD: none
EUR/USD
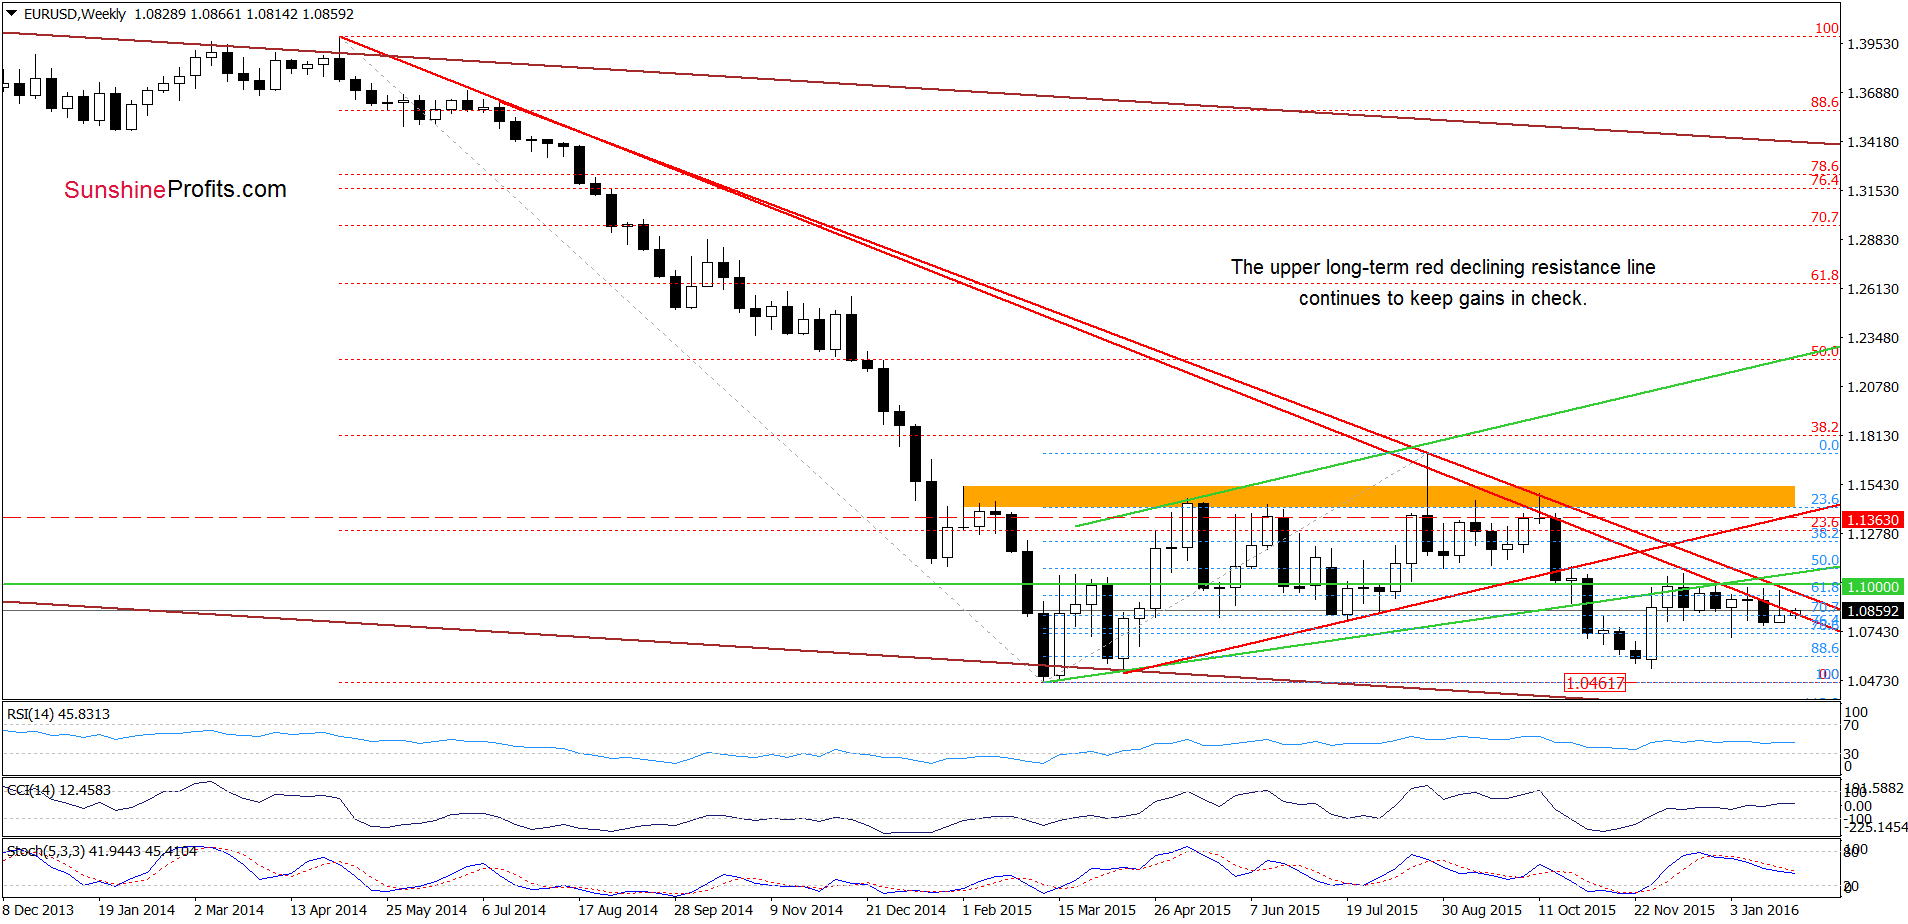
On the weekly chart, we see that the upper long-term resistance line (which stopped currency bulls in Aug and Oct) continues to keep gains in check.
What can we infer from the very short-term chart? Let’s check.
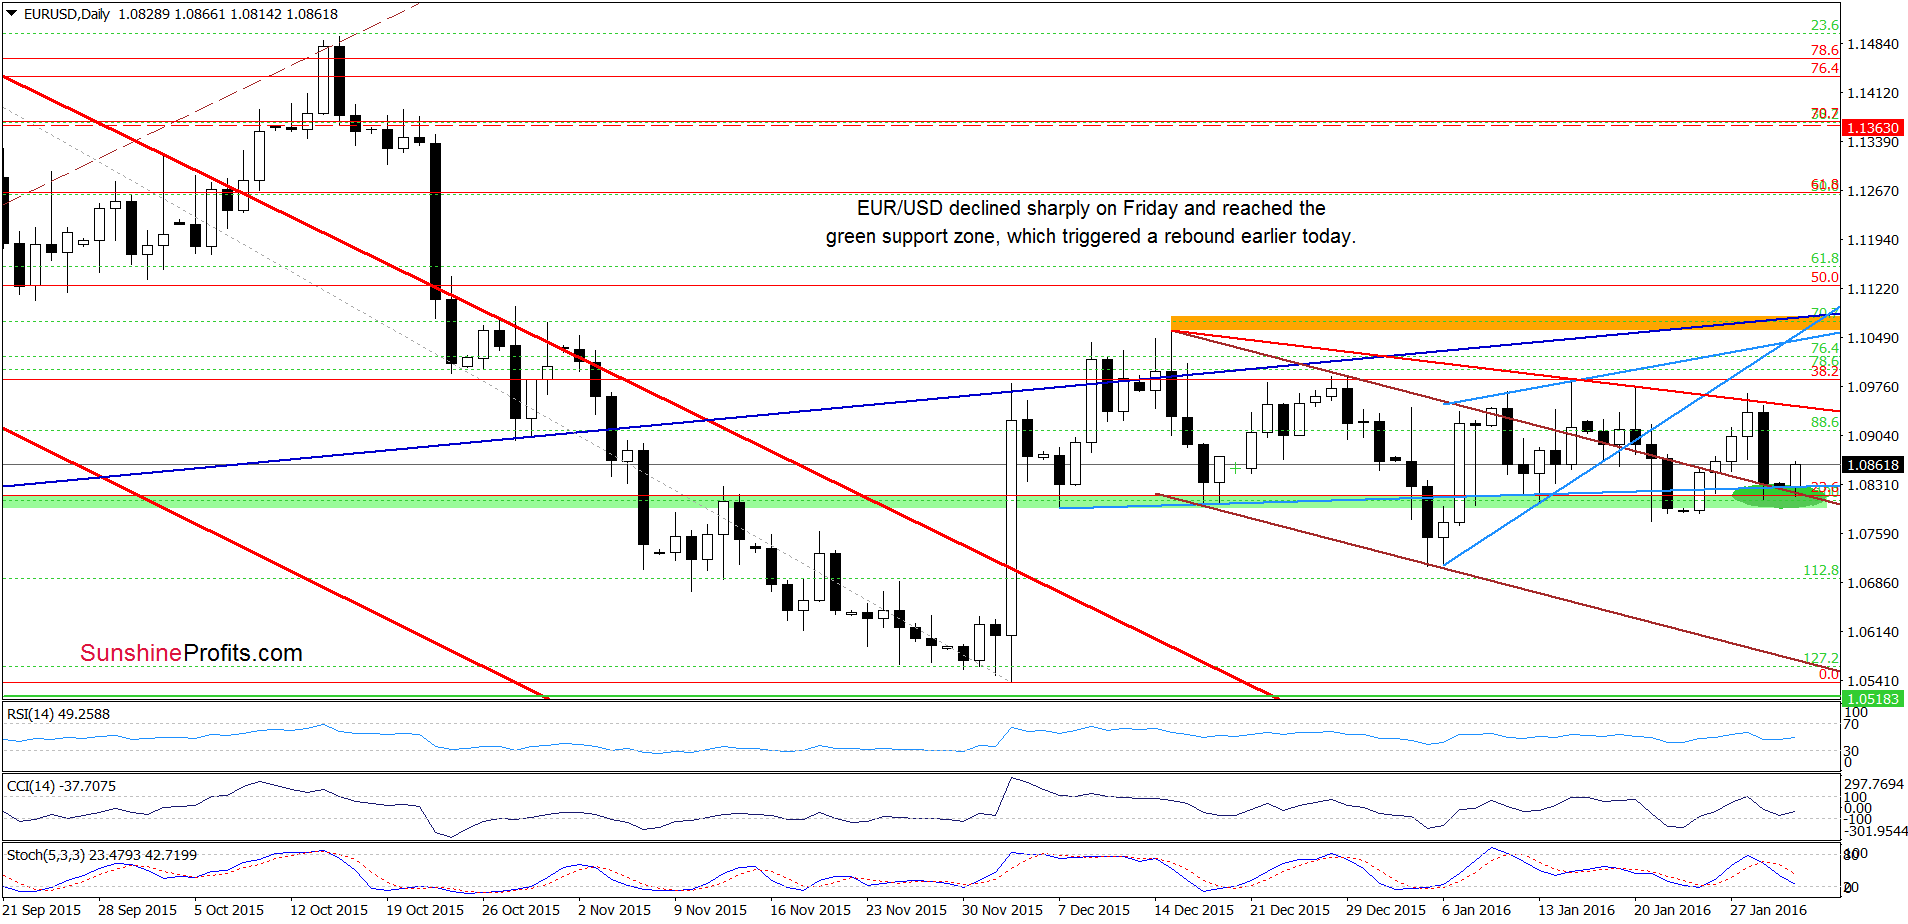
Quoting our Friday’s alert:
(…) EUR/USD extended gains and climbed to the red line based on the recent highs. As you see, this resistance stopped currency bulls once again and triggered a pullback earlier today. Taking this fact into account and the medium-term picture, we believe that (…) if the pair declines from here, the initial downside target would be the green support zone (marked with green ellipse).
Looking at the daily chart, we see that the situation developed in line with the above scenario and EUR/USD reached our first downside target. Although the green support zone triggered a small rebound earlier today, we believe that as long as the pair remains under the previously-broken lower border of the rising wedge (marked with blue), the red resistance line based on the recent highs and the 38.2% Fibonacci retracement another sizable increase is not likely to be seen – especially when we factor in the current position of the indicators (sell signals generated by the CCI and Stochastic Oscillator remain in place, supporting further deterioration).
Very short-term outlook: bearish
Short-term outlook: bearish
MT outlook: bearish
LT outlook: mixed
Trading position (short-term; our opinion): Short positions (with a stop-loss order at 1.1363 and the initial downside target at 1.0462) are justified from the risk/reward perspective. We will keep you informed should anything change, or should we see a confirmation/invalidation of the above.
USD/CAD
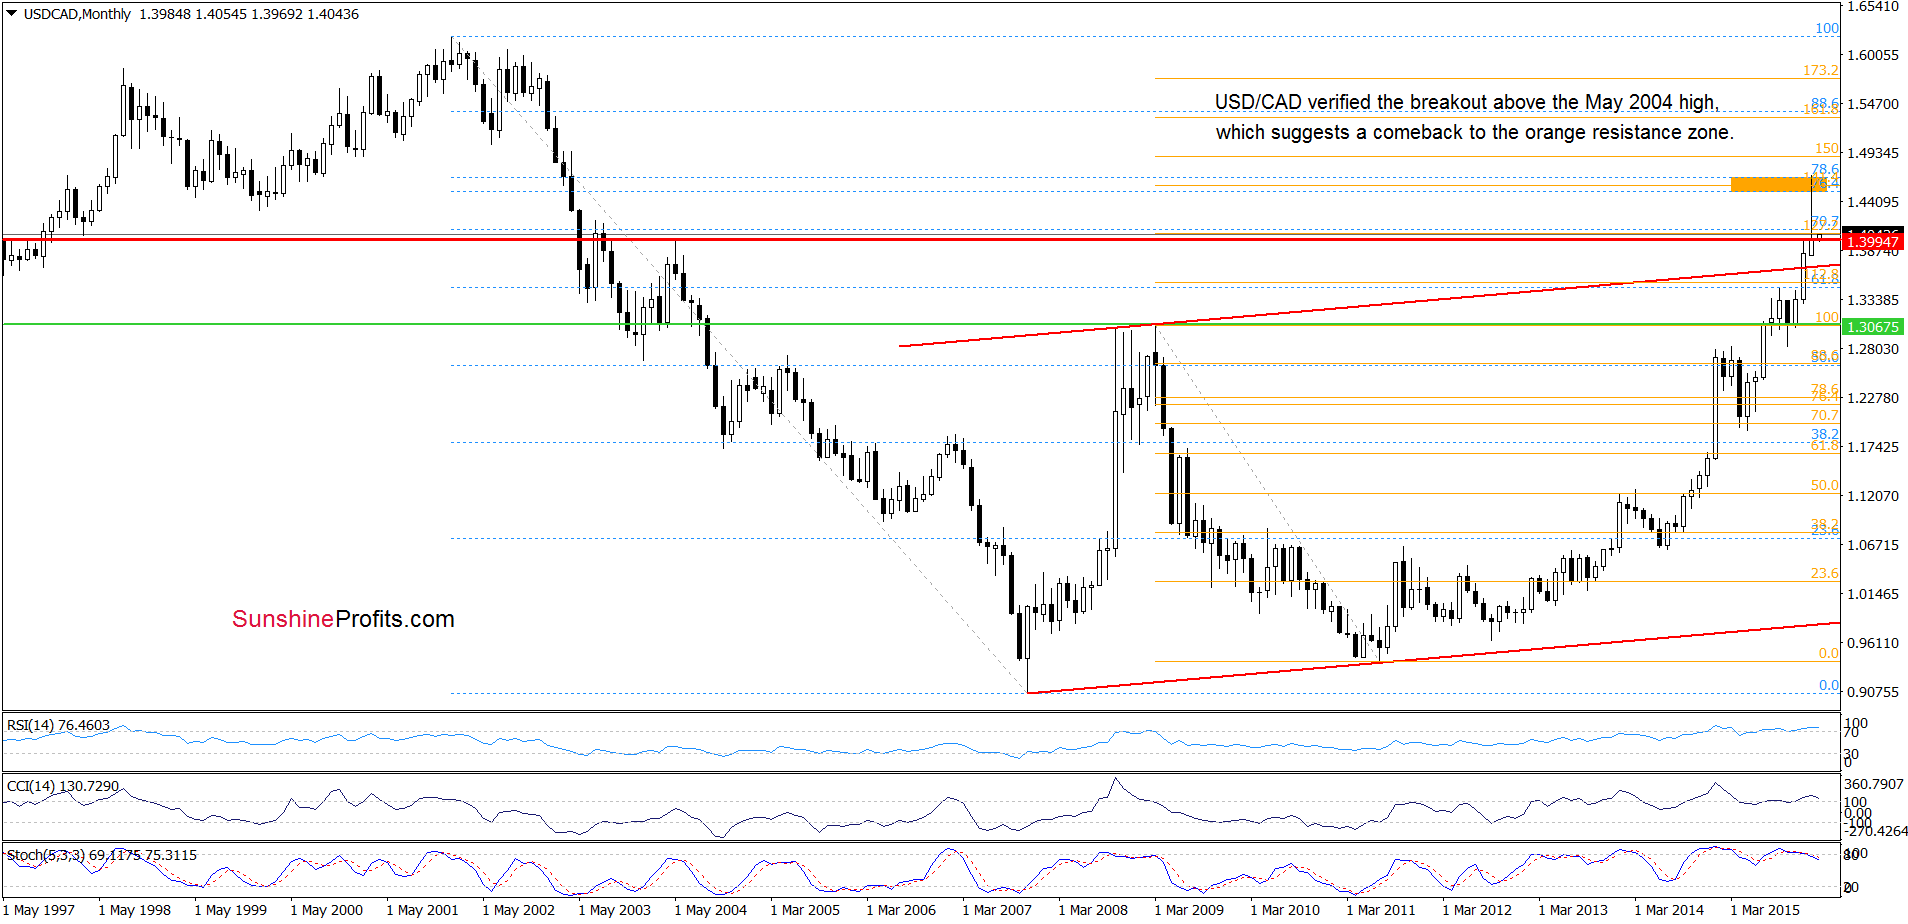
On the weekly chart, we see that USD/CAD declined to the May 2004 high and rebounded, which looks like a verification of earlier breakout. If this is the case, and the pair extends gains from here, we’ll likely see an increase to the orange resistance zone in the coming month.
What impact did this move have on the very short-term picture? Let’s check.
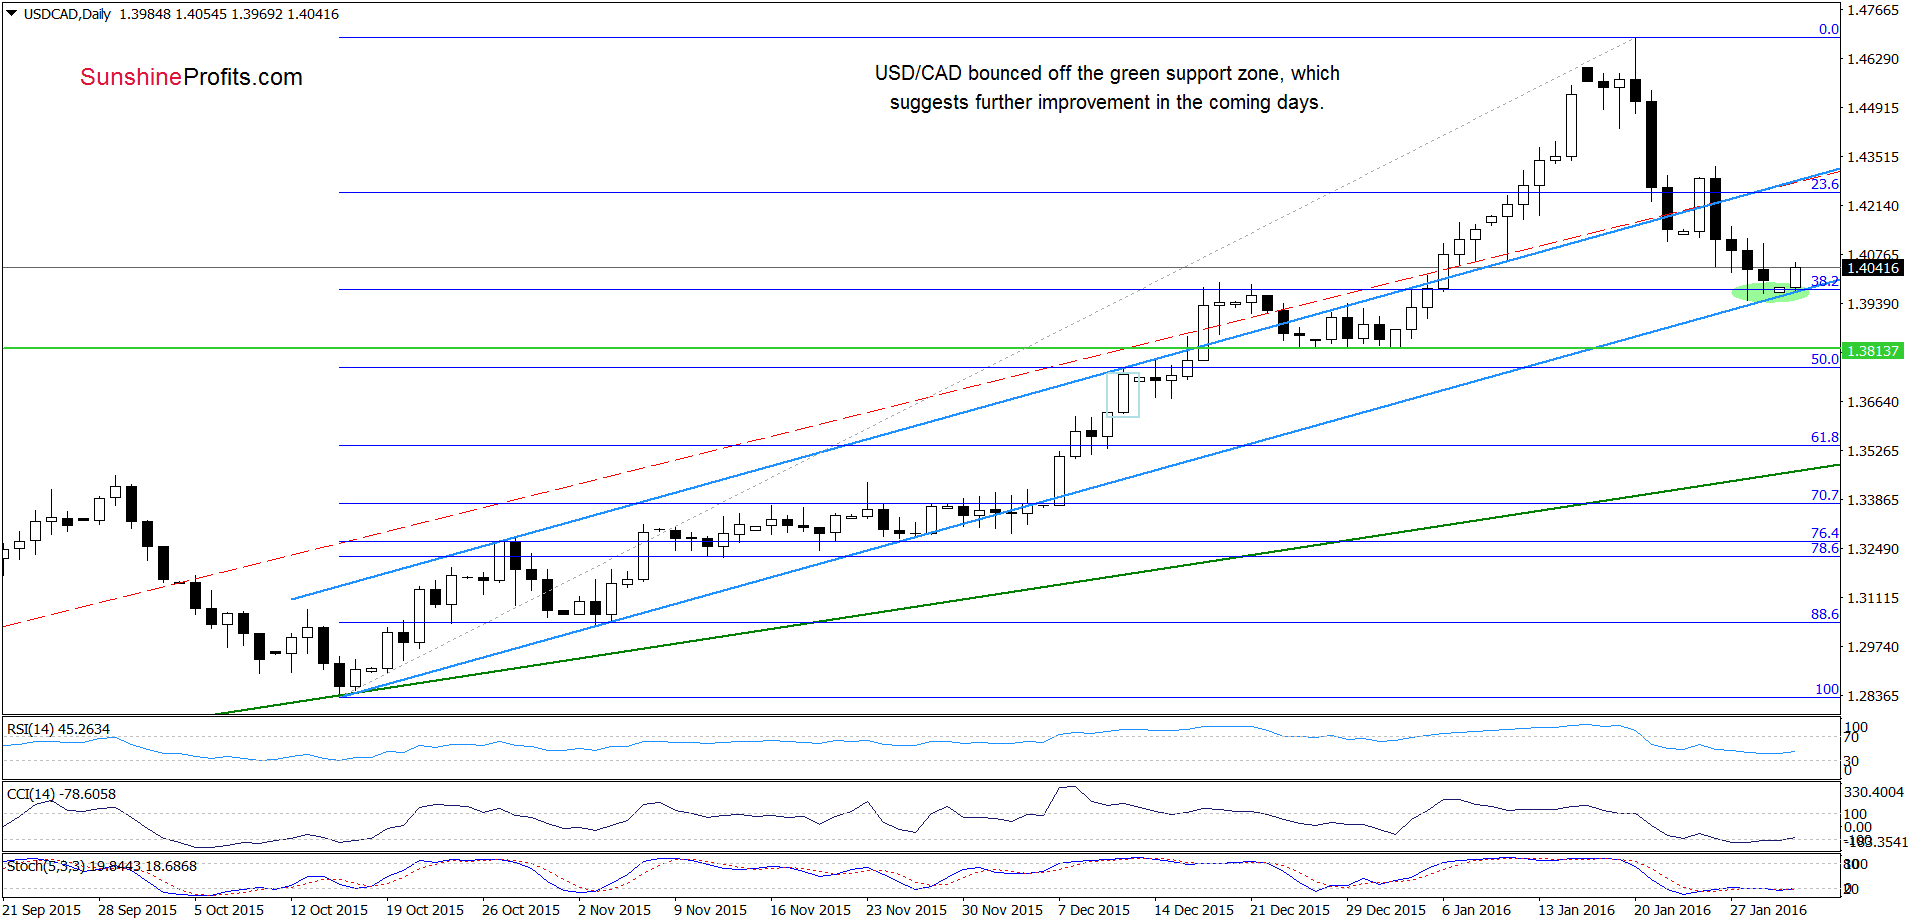
On the daily chart, we see that USD/CAD reached the green support zone and rebounded. This means that what we wrote on Friday remains up-to-date also today:
(…) Taking this fact into account and combining it with (…) the current position of the indicators, we think that further improvement is just around the corner. Therefore, if the pair extends gains, the first upside target would be the upper line of the blue trend channel.
Very short-term outlook: bullish
Short-term outlook: mixed with bullish bias
MT outlook: mixed
LT outlook: mixed
Trading position (short-term; our opinion): Long positions (with the stop-loss order at 1.3792 and the initial upside target at 1.4512) are justified from the risk/reward perspective. We will keep you informed should anything change, or should we see a confirmation/invalidation of the above.
AUD/USD
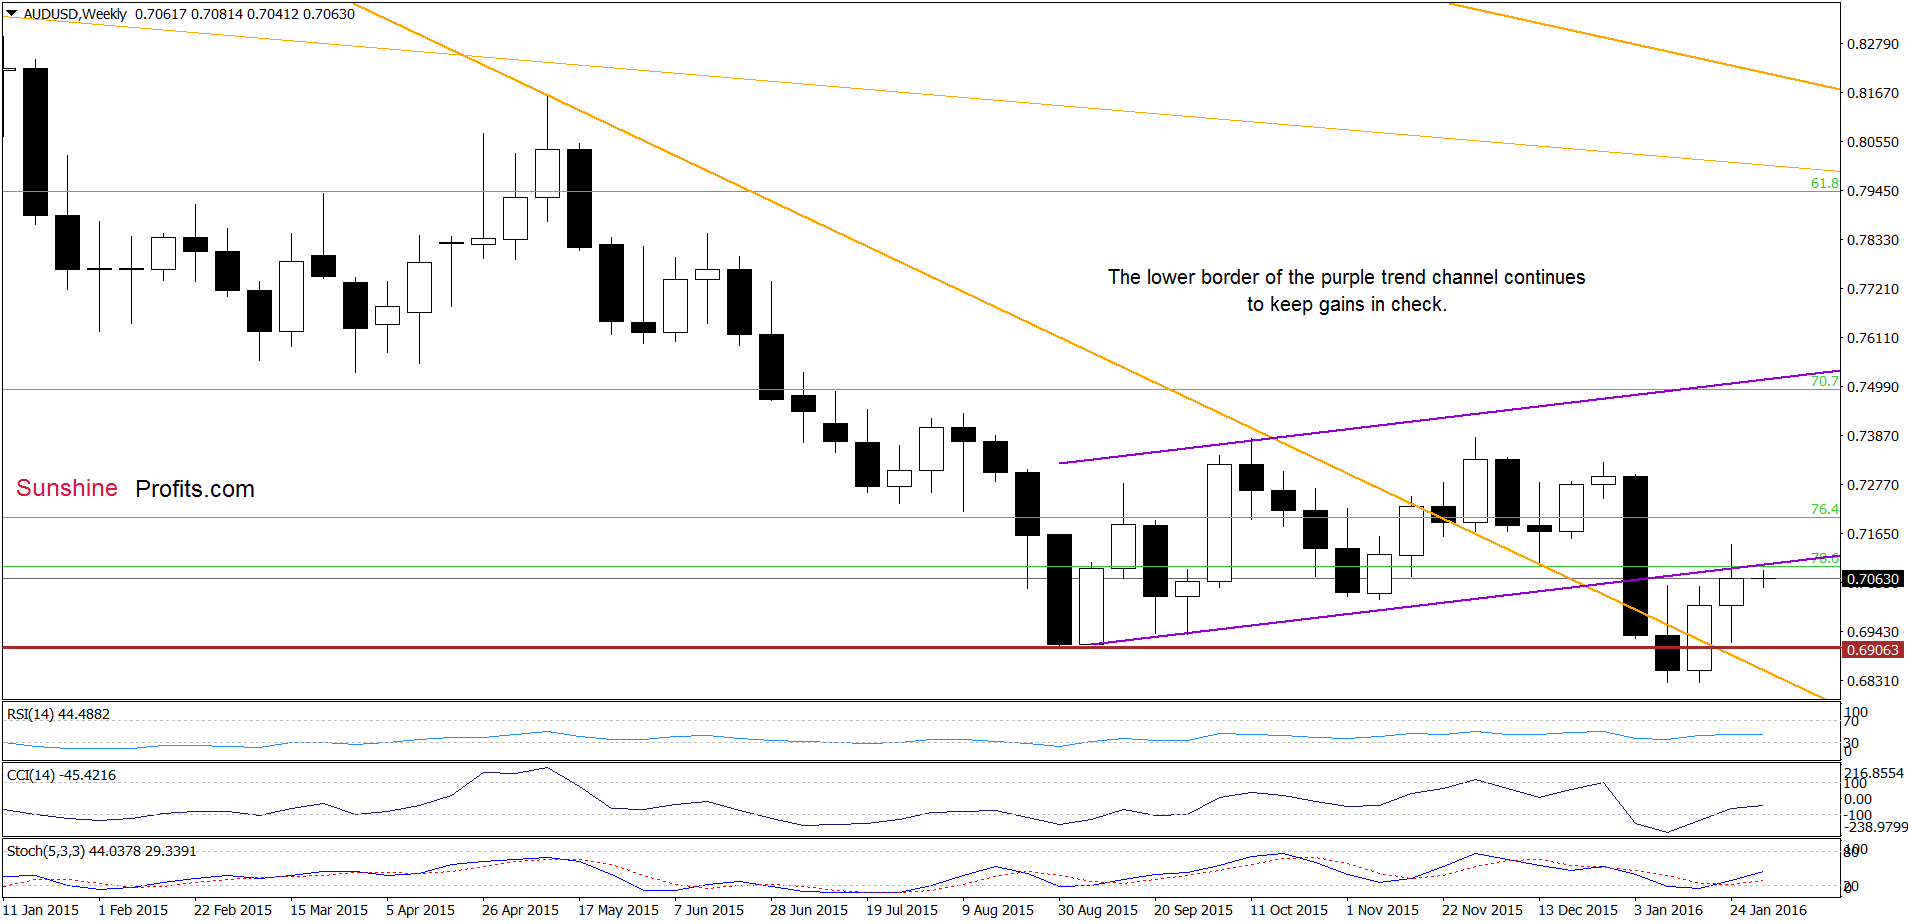
Looking at the weekly chart, we see that the lower border of the rising trend channel triggered a pullback in the previous week and continues to keep gains in check.
Will we see a decline from here? Let’s examine the daily chart and find out what can we infer from it about future moves.
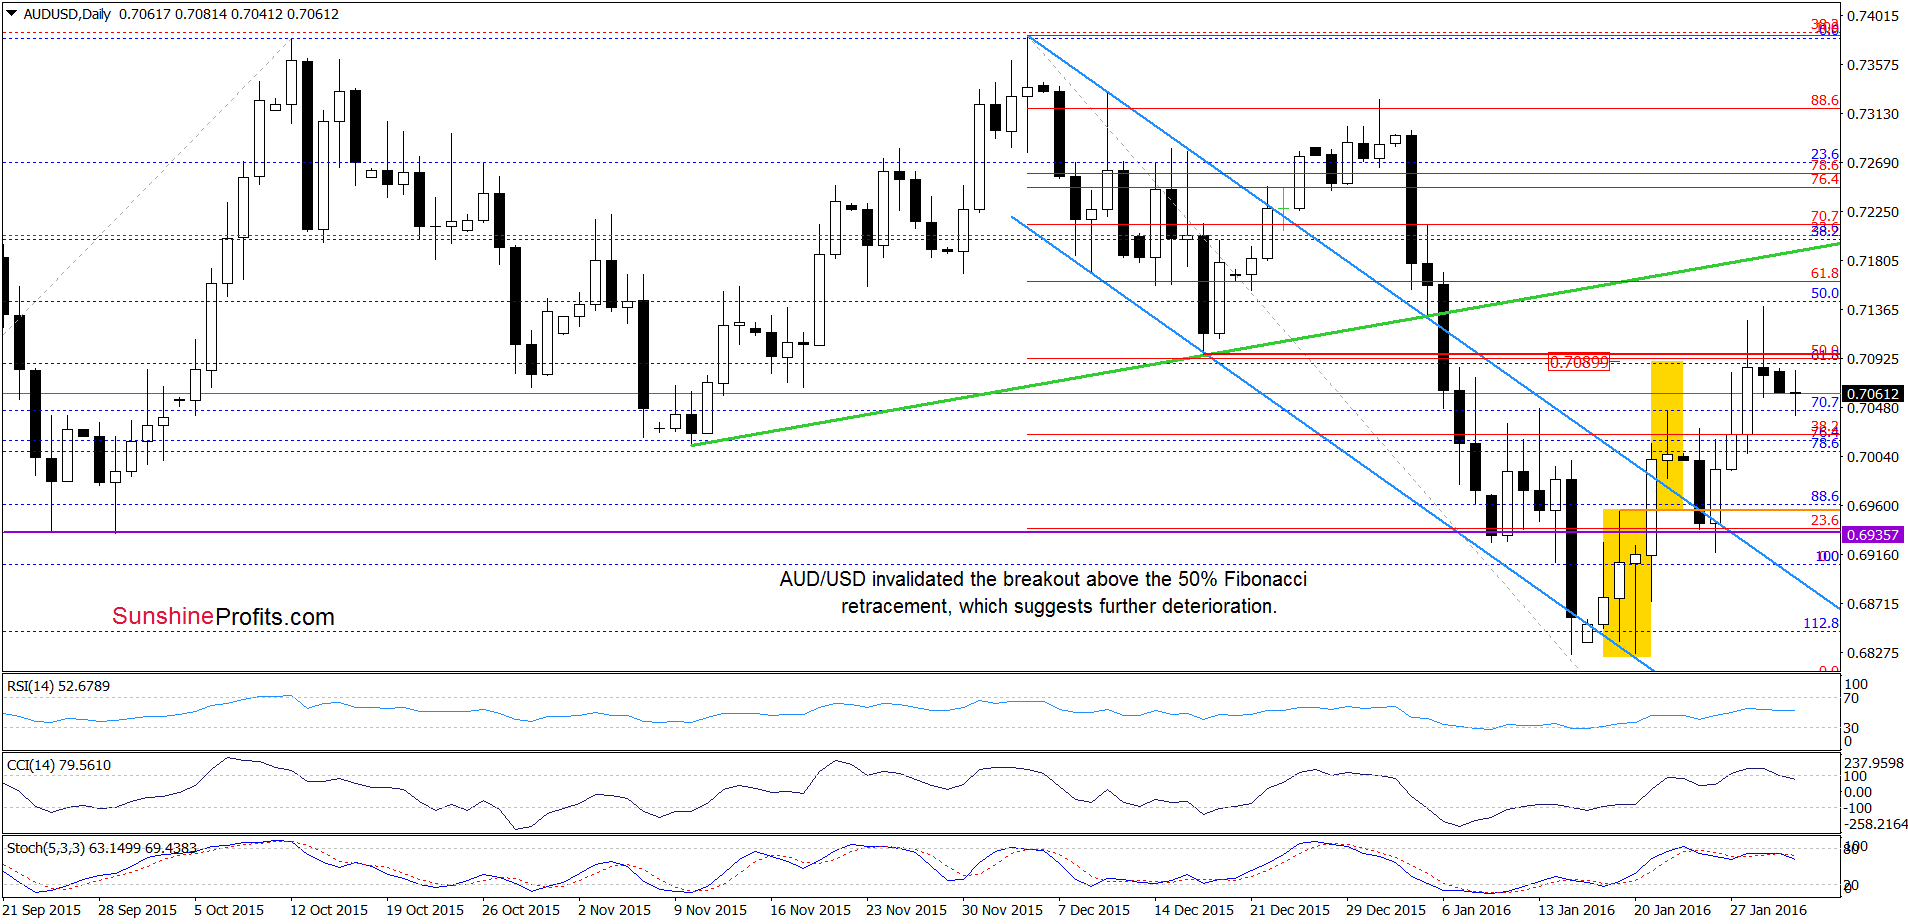
Looking at the above chart, we see that although AUD/USD moved higher on Friday, currency bulls didn’t manage to hold gained levels, which resulted in a pullback and a comeback below the 50% Fibonacci retracement and the red support/resistance line based on the mid-Dec low. Taking this fact into account, the medium-term picture and the current position of the daily indicators, we think that further deterioration is just around the corner. Therefore, if the pair moves lower from here, we may see a decline to the purple horizontal line or even to the upper border of the blue declining trend channel.
Very short-term outlook: mixed with bearish bias
Short-term outlook: mixed
MT outlook: mixed
LT outlook: mixed
Trading position (short-term; our opinion): No positions are justified from the risk/reward perspective. We will keep you informed should anything change, or should we see a confirmation/invalidation of the above.
Thank you.
Nadia Simmons
Forex & Oil Trading Strategist
Przemyslaw Radomski, CFA
Founder, Editor-in-chief
Gold & Silver Trading Alerts
Forex Trading Alerts
Oil Investment Updates
Oil Trading Alerts

