

Although today’s preliminary data showed that the annual rate of inflation in the euro zone rose by 0.4% this month, German retail sales fell 0.2% in the previous month. Thanks to these mixed numbers, the euro moved lower against the greenback, moving away from the resistance line. What happened at the same time with other currency pairs?
In our opinion the following forex trading positions are justified - summary:
- EUR/USD: short (stop-loss order at 1.1363; initial downside target at 1.0462)
- GBP/USD: none
- USD/JPY: none
- USD/CAD: long (stop-loss order at 1.3792; initial upside target at 1.4512)
- USD/CHF: none
- AUD/USD: none
EUR/USD
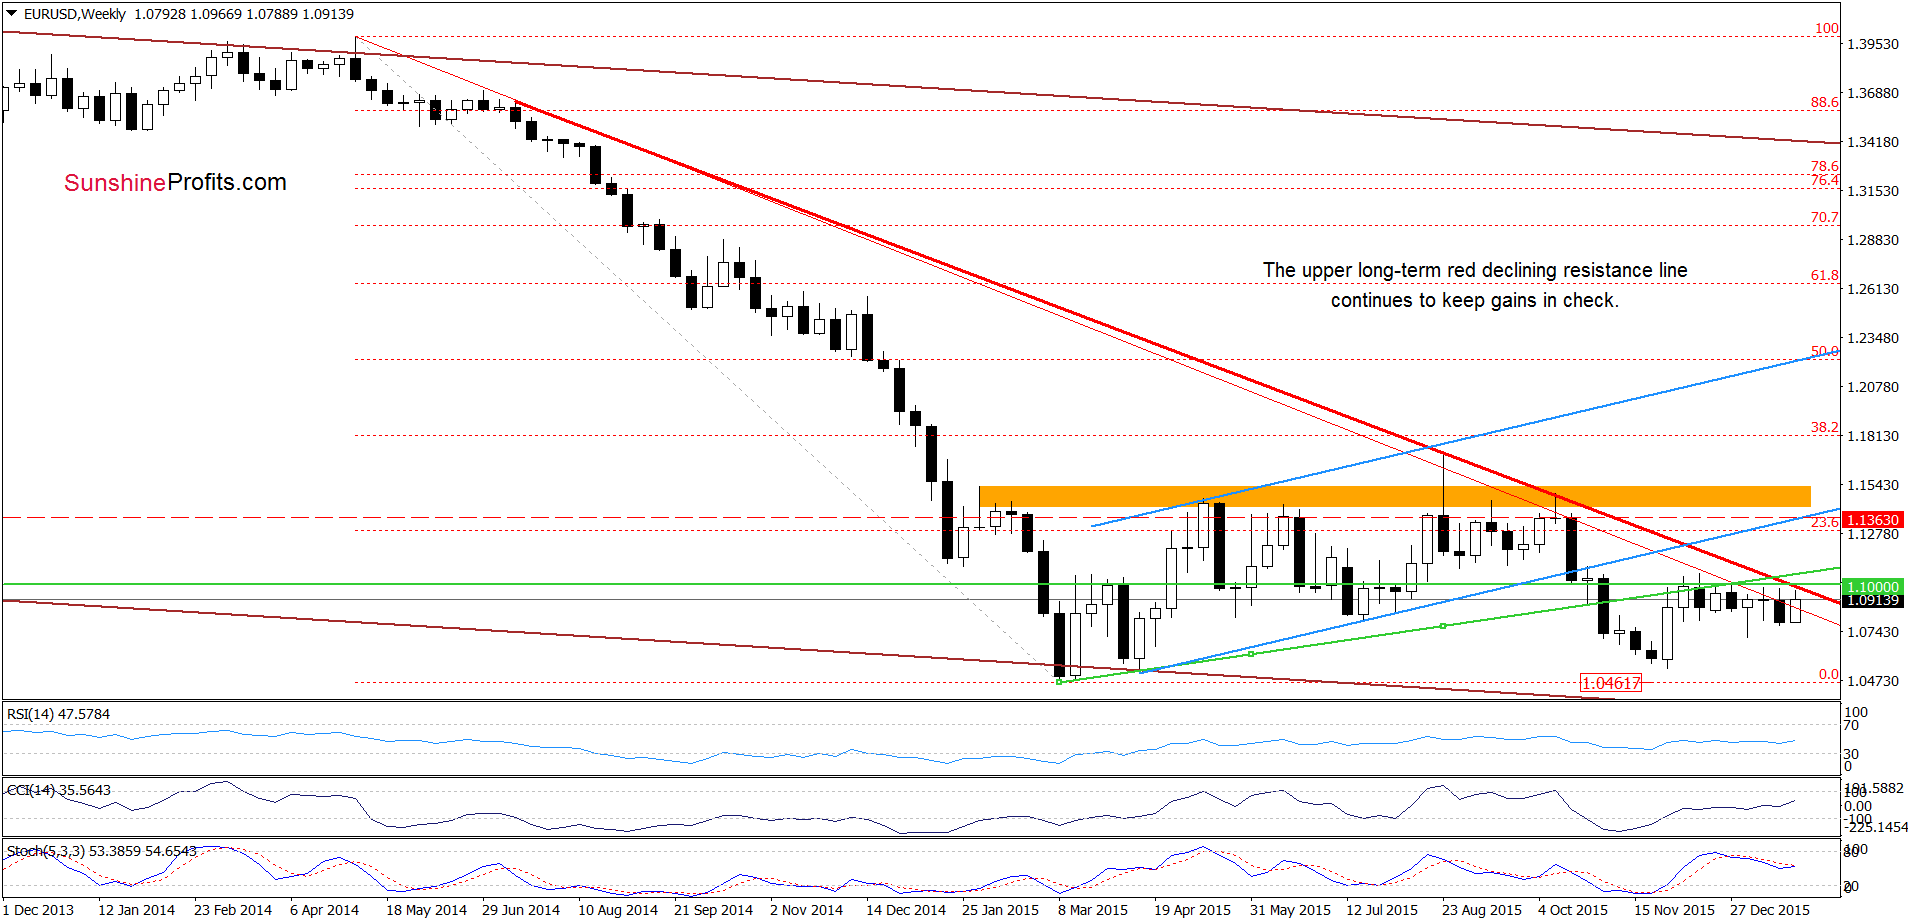
On the weekly chart, we see that the upper long-term resistance line (which stopped currency bulls in Aug and Oct) continues to keep gains in check.
What can we infer from the very short-term chart? Let’s check.
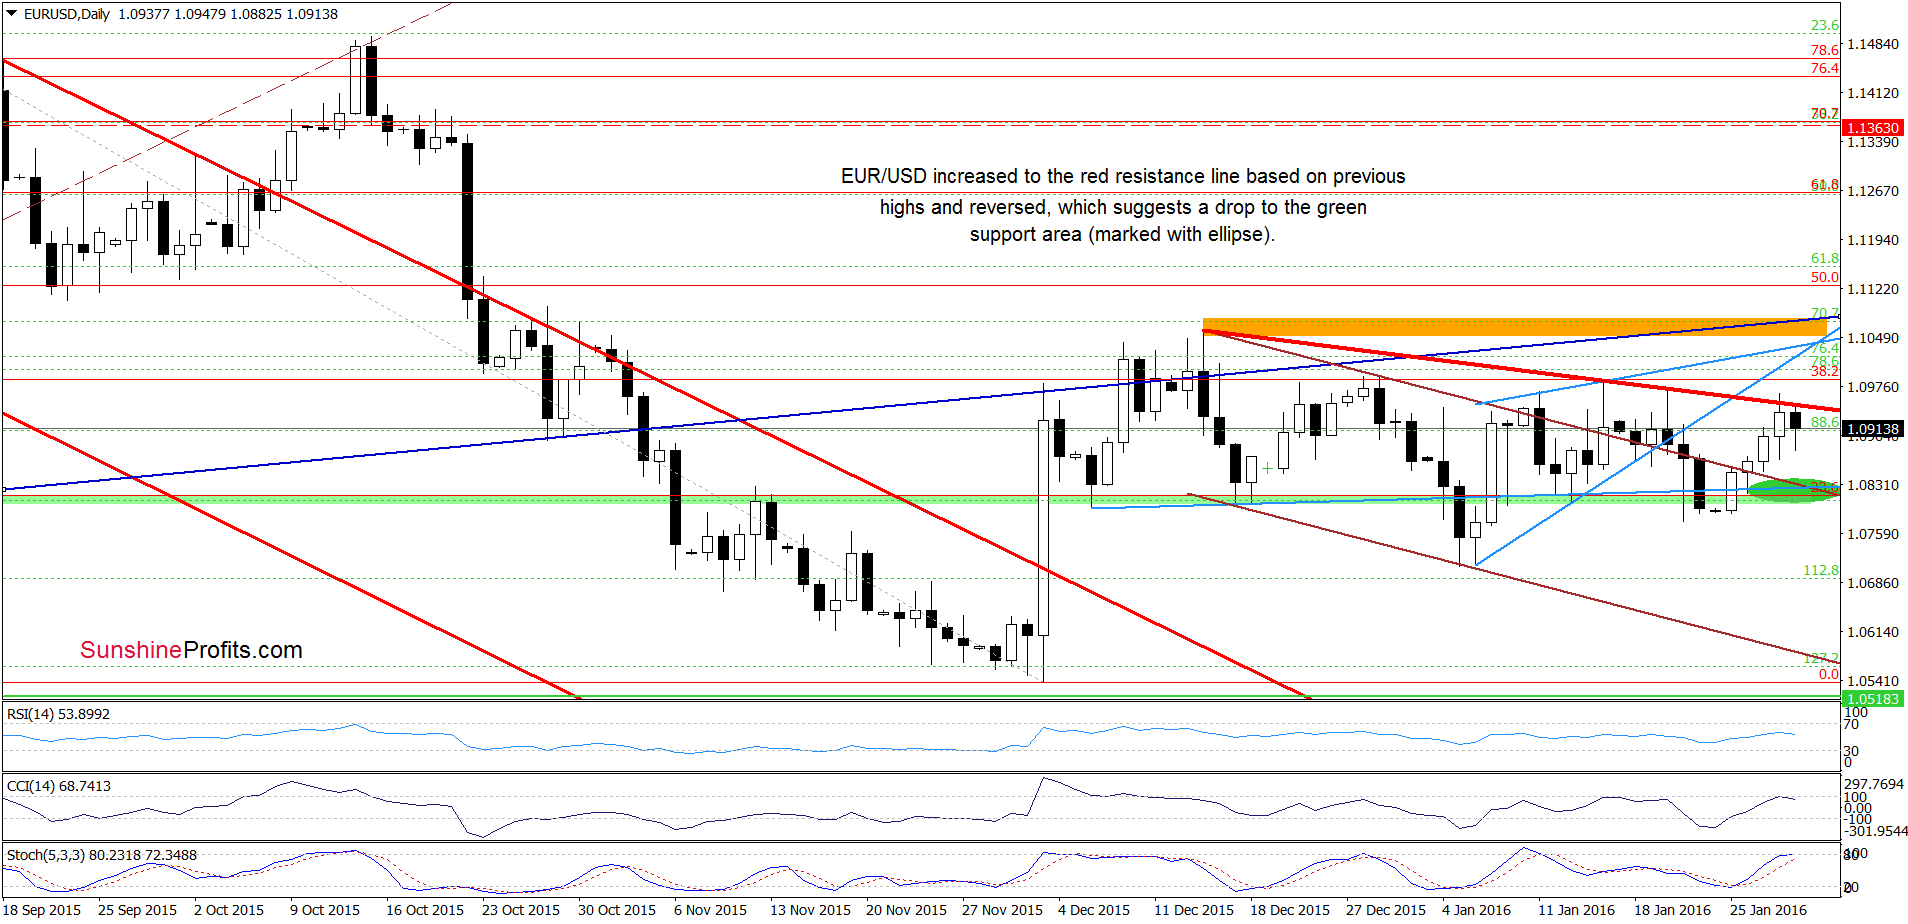
Yesterday, EUR/USD extended gains and climbed to the red line based on the recent highs. As you see, this resistance stopped currency bulls once again and triggered a pullback earlier today. Taking this fact into account and the medium-term picture, we believe that our previous commentary on this currency pair is up-to-date:
(…) the pair remains under the previously-broken lower border of the rising wedge (marked with blue), the red resistance line based on the recent highs and the 38.2% Fibonacci retracement. This suggests that as long as there is no breakout above the orange resistance zone, another sizable rally is not likely to be seen.
In our opinion, if the pair declines from here, the initial downside target would be the green support zone (marked with green ellipse).
Very short-term outlook: bearish
Short-term outlook: bearish
MT outlook: bearish
LT outlook: mixed
Trading position (short-term; our opinion): Short positions (with a stop-loss order at 1.1363 and the initial downside target at 1.0462) are justified from the risk/reward perspective. We will keep you informed should anything change, or should we see a confirmation/invalidation of the above.
GBP/USD
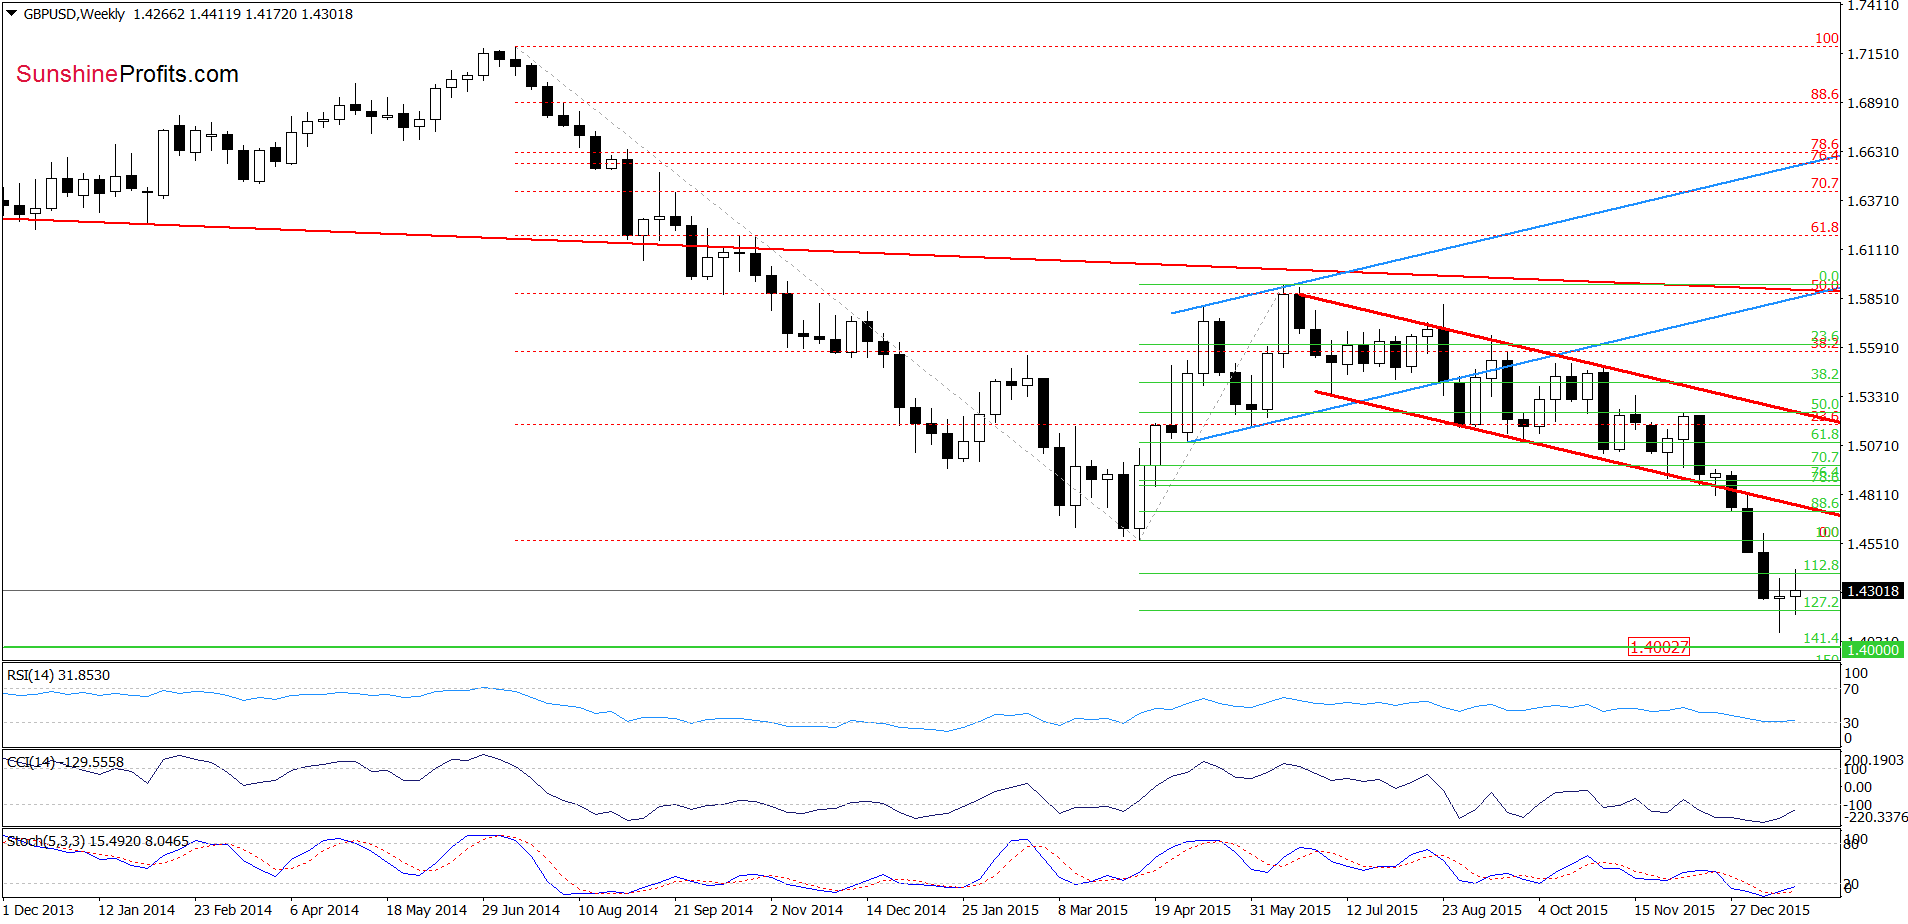
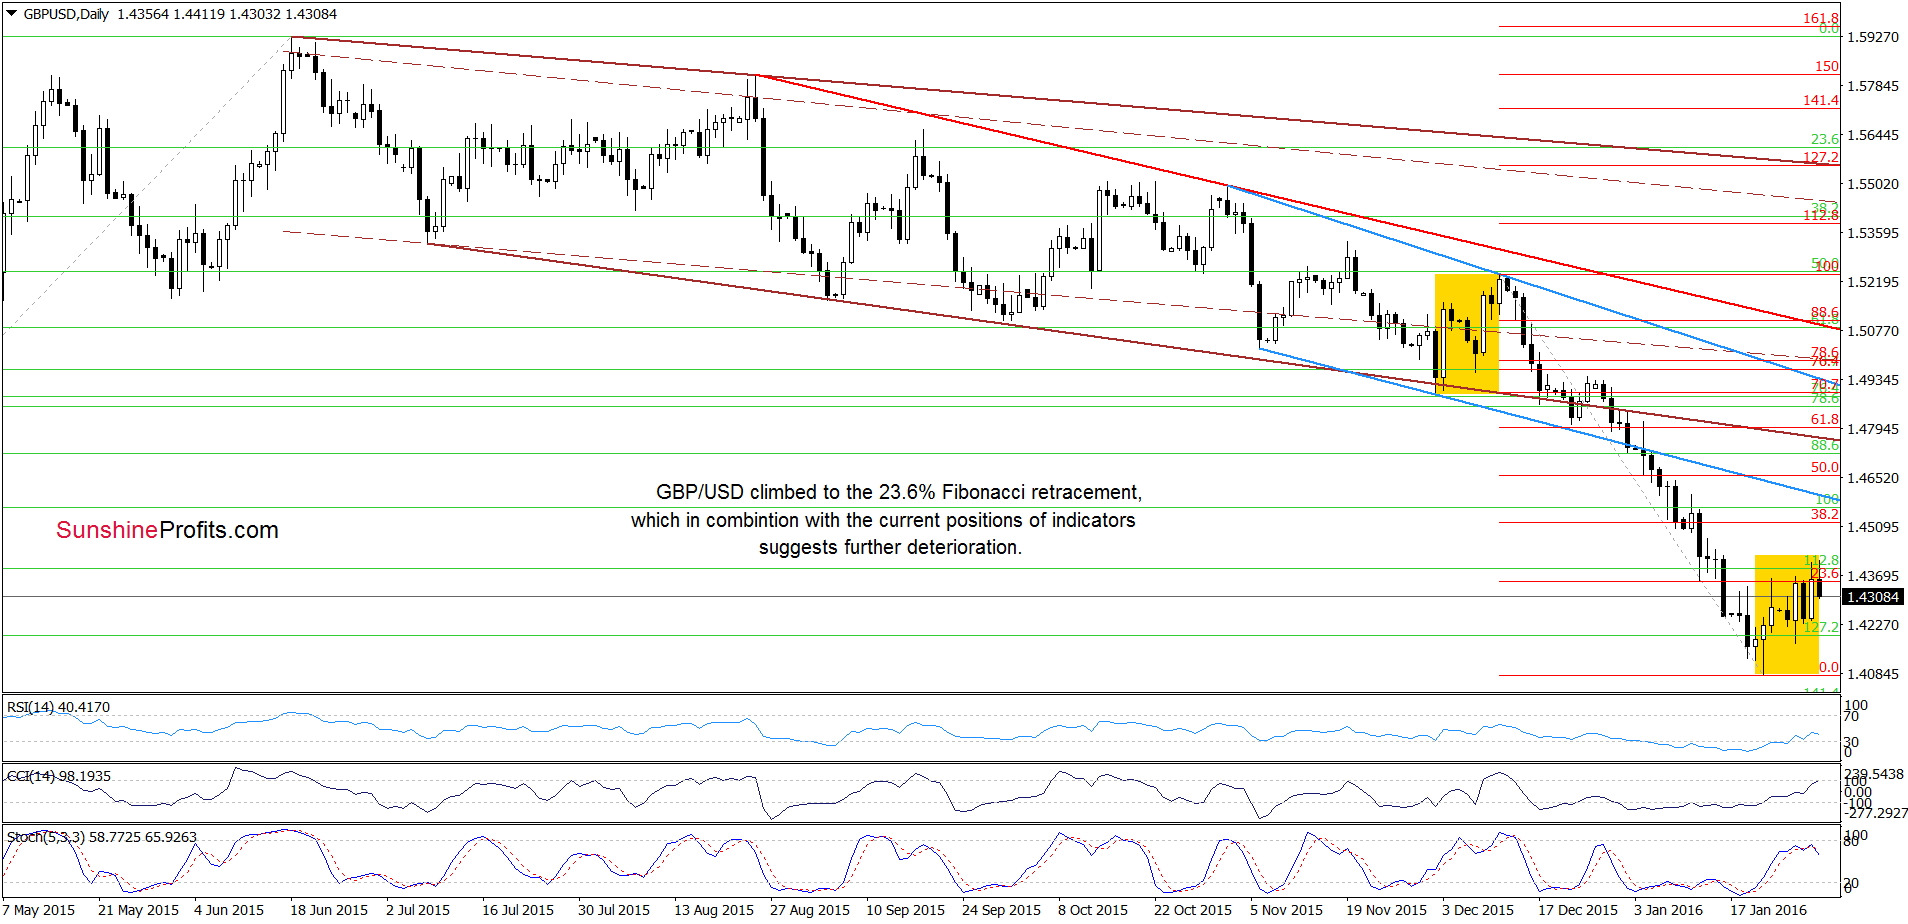
On the above chars, we see that GBP/USD extended gains and climbed above the 23.6% Fibonacci retracement based on the mid-Dec-Jan declines. Earlier today, the pair invalidated this small breakout, which in combination with the current position of the indicators suggests further deterioration in the coming days. Additionally, the recent upward move was very similar to the upside move, which we saw at the beginning of Dec, which means that the downtrend remains in play and lower values of the exchange rate are just around the corner.
Very short-term outlook: mixed with bearish bias
Short-term outlook: mixed
MT outlook: mixed
LT outlook: mixed
Trading position (short-term; our opinion): No positions are justified from the risk/reward perspective at the moment. We will keep you informed should anything change, or should we see a confirmation/invalidation of the above.
USD/JPY
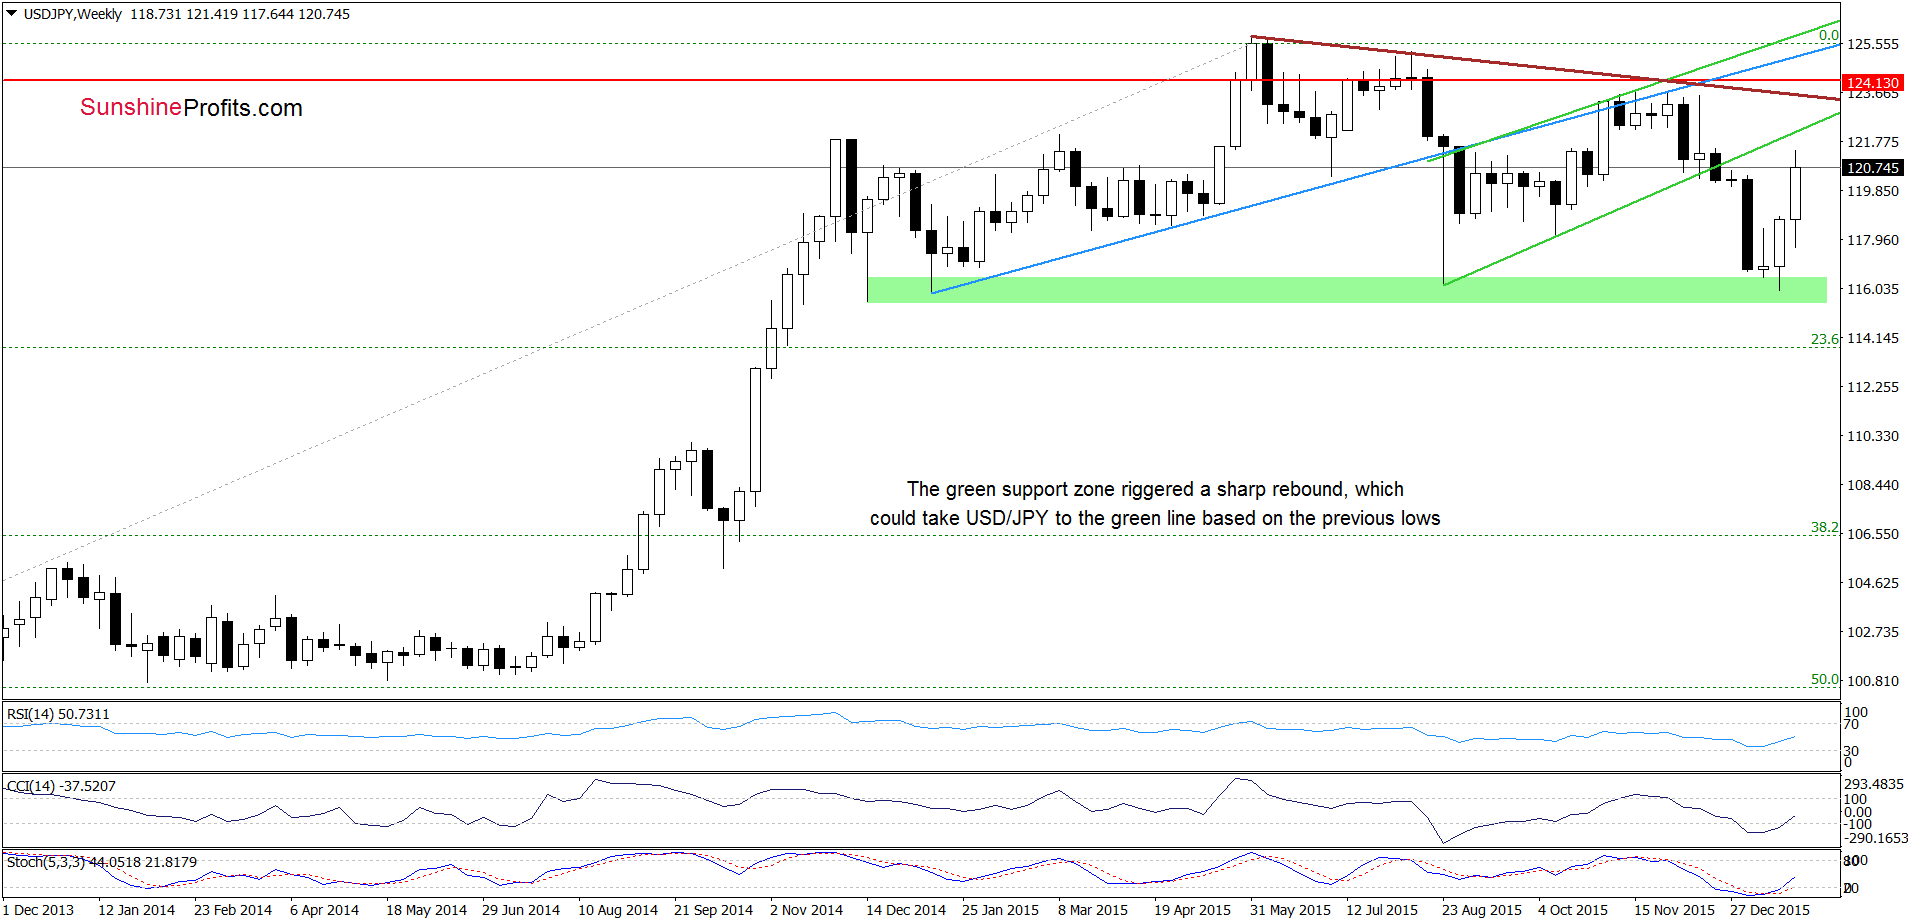
On the weekly chart, we see that USD/JPY bounced off the green support zone, which in combination with buy signals generated by the indicators suggests further improvement and a test of the green resistance line based on the Aug and Oct lows.
Are there any technical factors that could hinder the realization of the above scenario? Let’s examine the daily chart and find out.
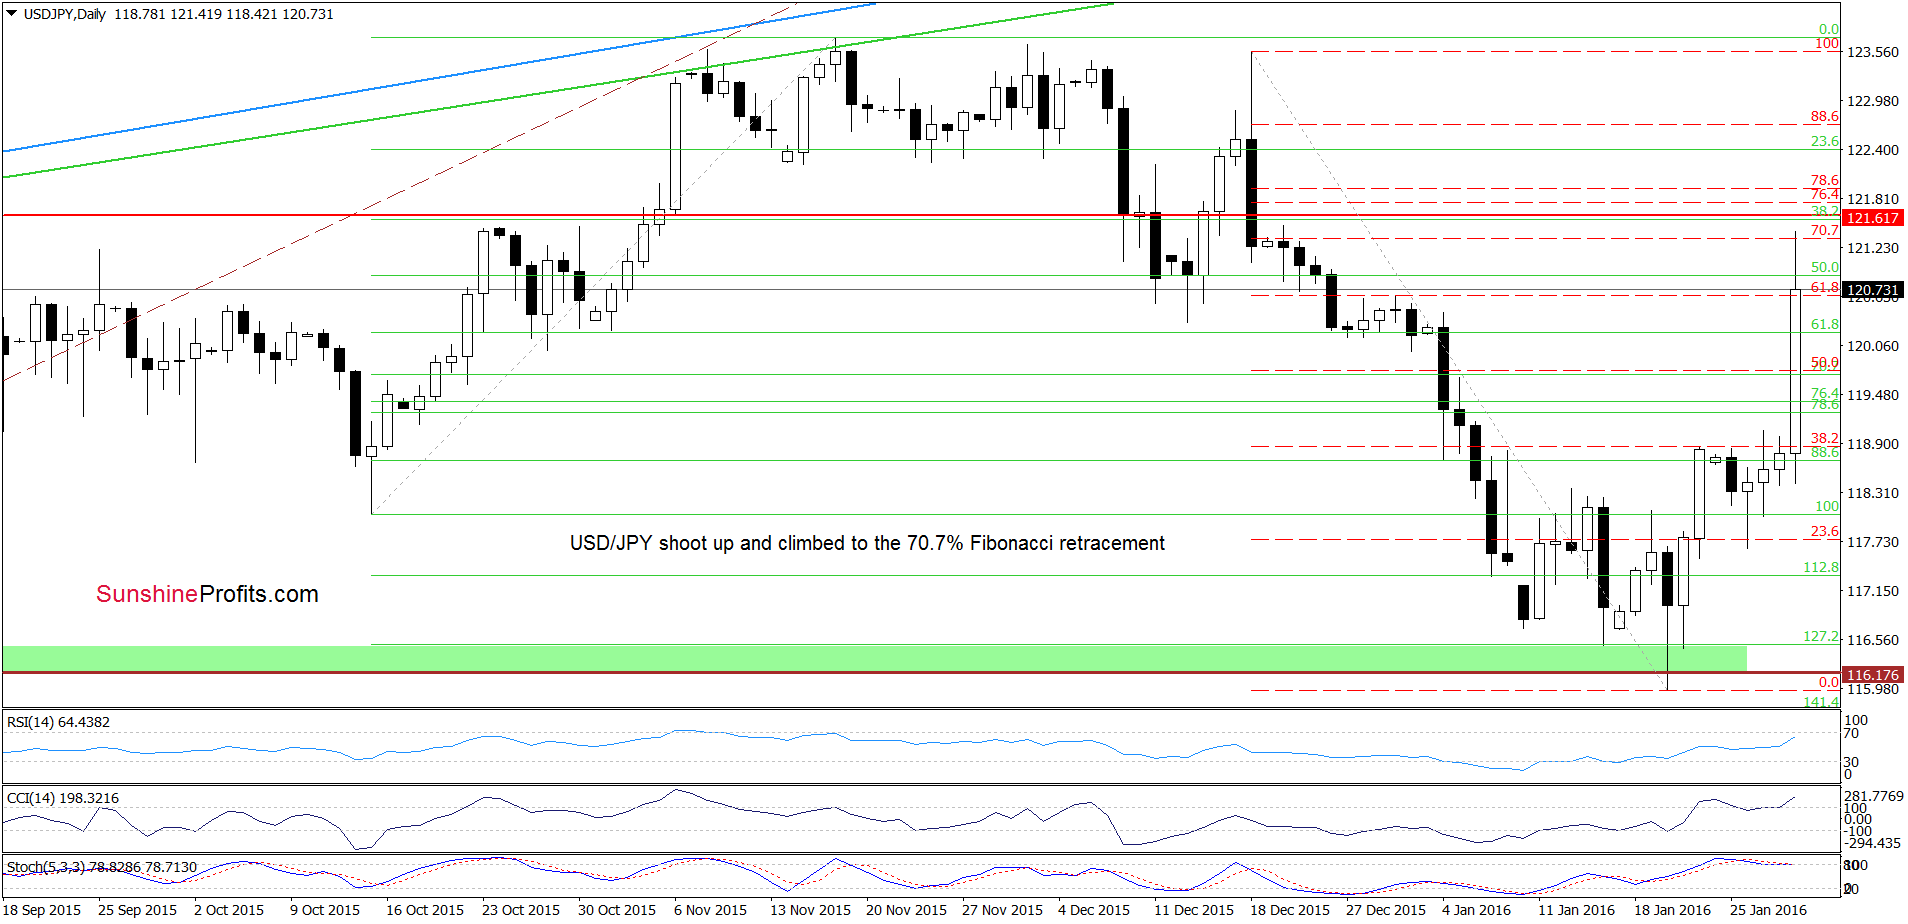
From today’s point of view, we see that USD/JPY shoot up and reached the 70.7% Fibonacci retracement earlier today. Although this is a positive signal, the current position of the indicators suggests that a correction of the recent rally is just around the corner.
Very short-term outlook: mixed with bearish bias
Short-term outlook: mixed with bullish bias
MT outlook: mixed
LT outlook: mixed
Trading position (short-term; our opinion): No positions are justified from the risk/reward perspective at the moment. We will keep you informed should anything change, or should we see a confirmation/invalidation of the above.
USD/CAD
The situation in the medium term hasn’t changed much as USD/CAD is still trading under the resistance zone. Today, we’ll focus on the very short-term changes.
On Tuesday, we wrote:
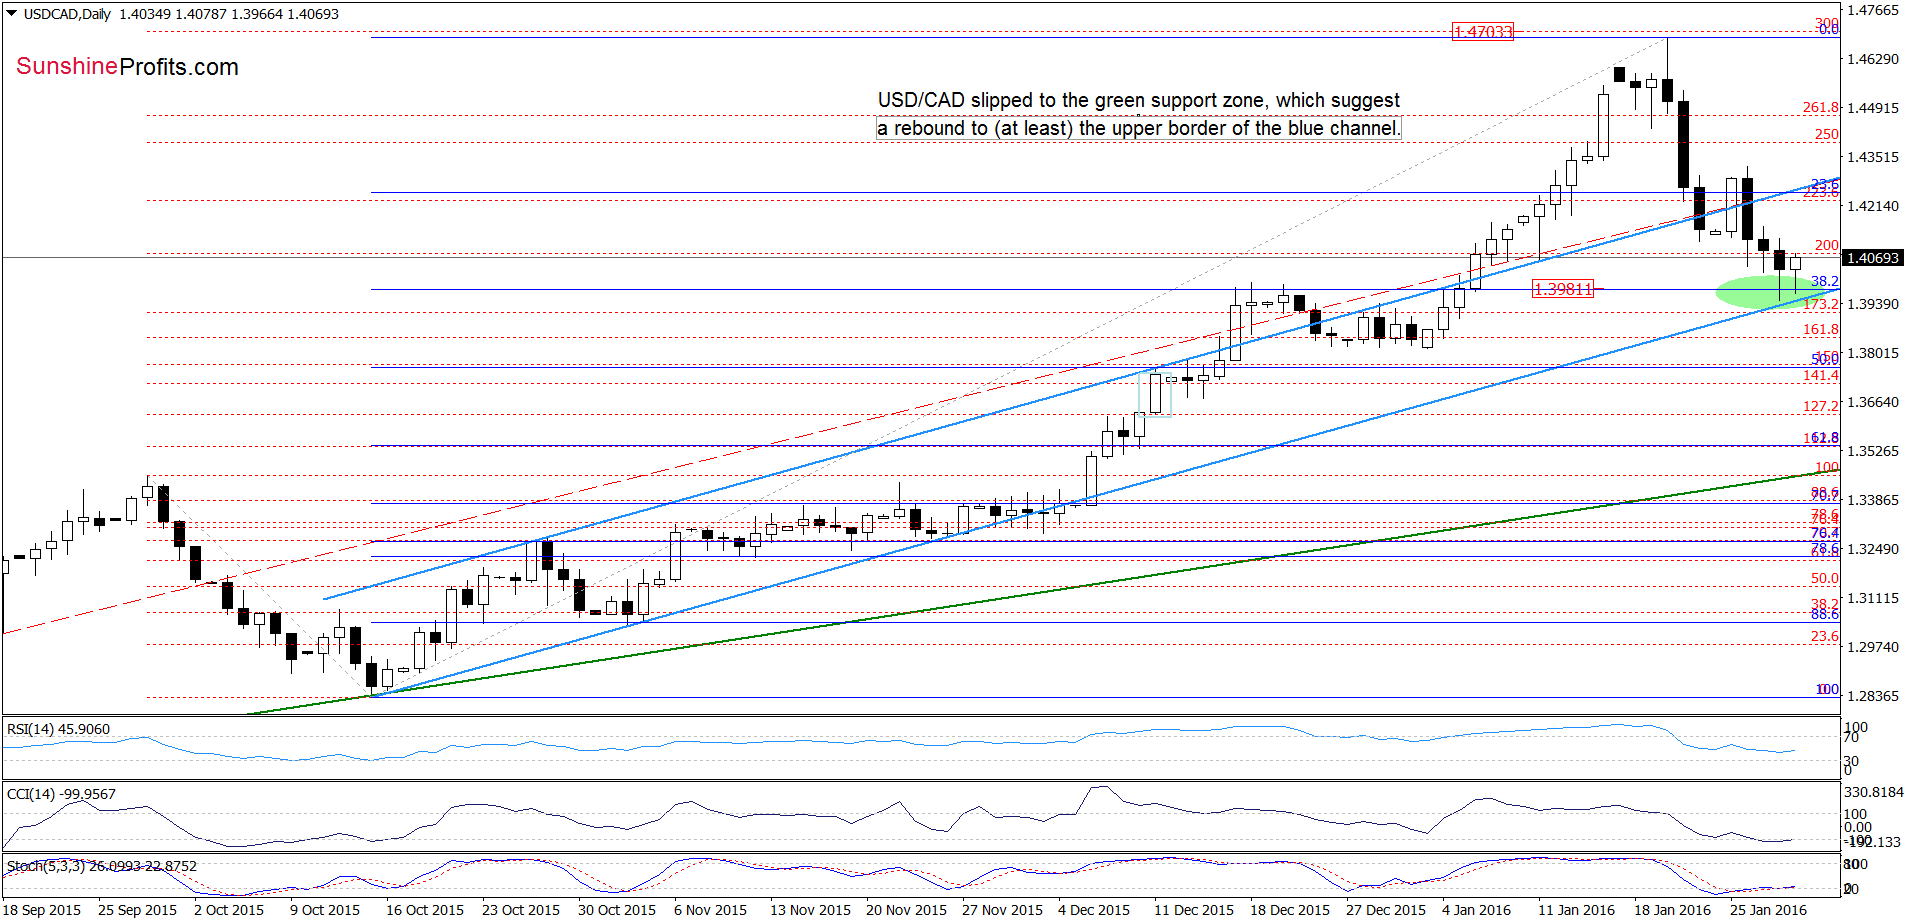
(…) the proximity to the 38.2% Fibonacci retracement (based on the recent decline) triggered a pullback earlier today, which will likely translate into a drop to the blue support line later in the day. (…) if currency bears manage to push the exchange rate below it, the next downside target would be around 1.4000, where the Dec highs and the 38.2% Fibonacci retracement (based on the Oct-Jan rally) are.
As you see on the daily chart, the situation developed in line with the above scenario and USD/CAD reached our downside target. Taking this fact into account and combining it with the proximity to the lower border of the blue trend channel and the current position of the indicators, we think that further improvement is just around the corner. Therefore, if the pair extends gains, the first upside target would be the upper line of the blue trend channel.
Very short-term outlook: bullish
Short-term outlook: mixed with bullish bias
MT outlook: mixed
LT outlook: mixed
Trading position (short-term; our opinion): Long positions (with the stop-loss order at 1.3792 and the initial upside target at 1.4512) are justified from the risk/reward perspective. We will keep you informed should anything change, or should we see a confirmation/invalidation of the above.
USD/CHF
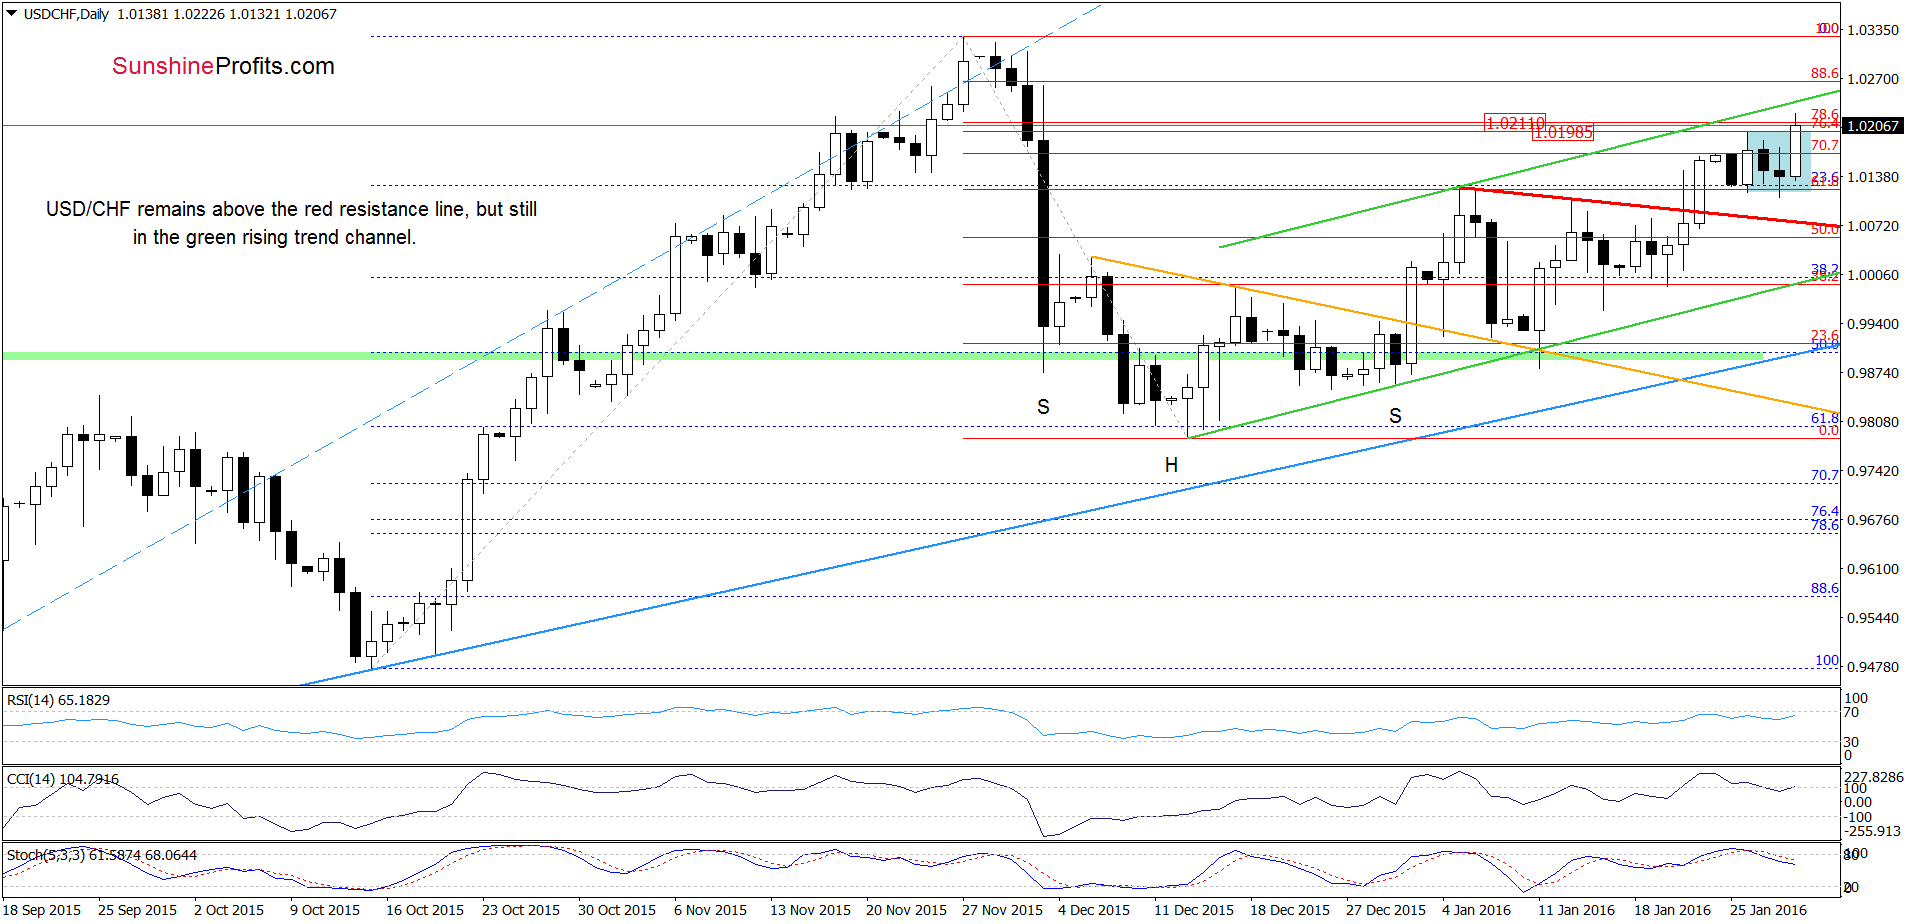
Quoting our Monday’s alert:
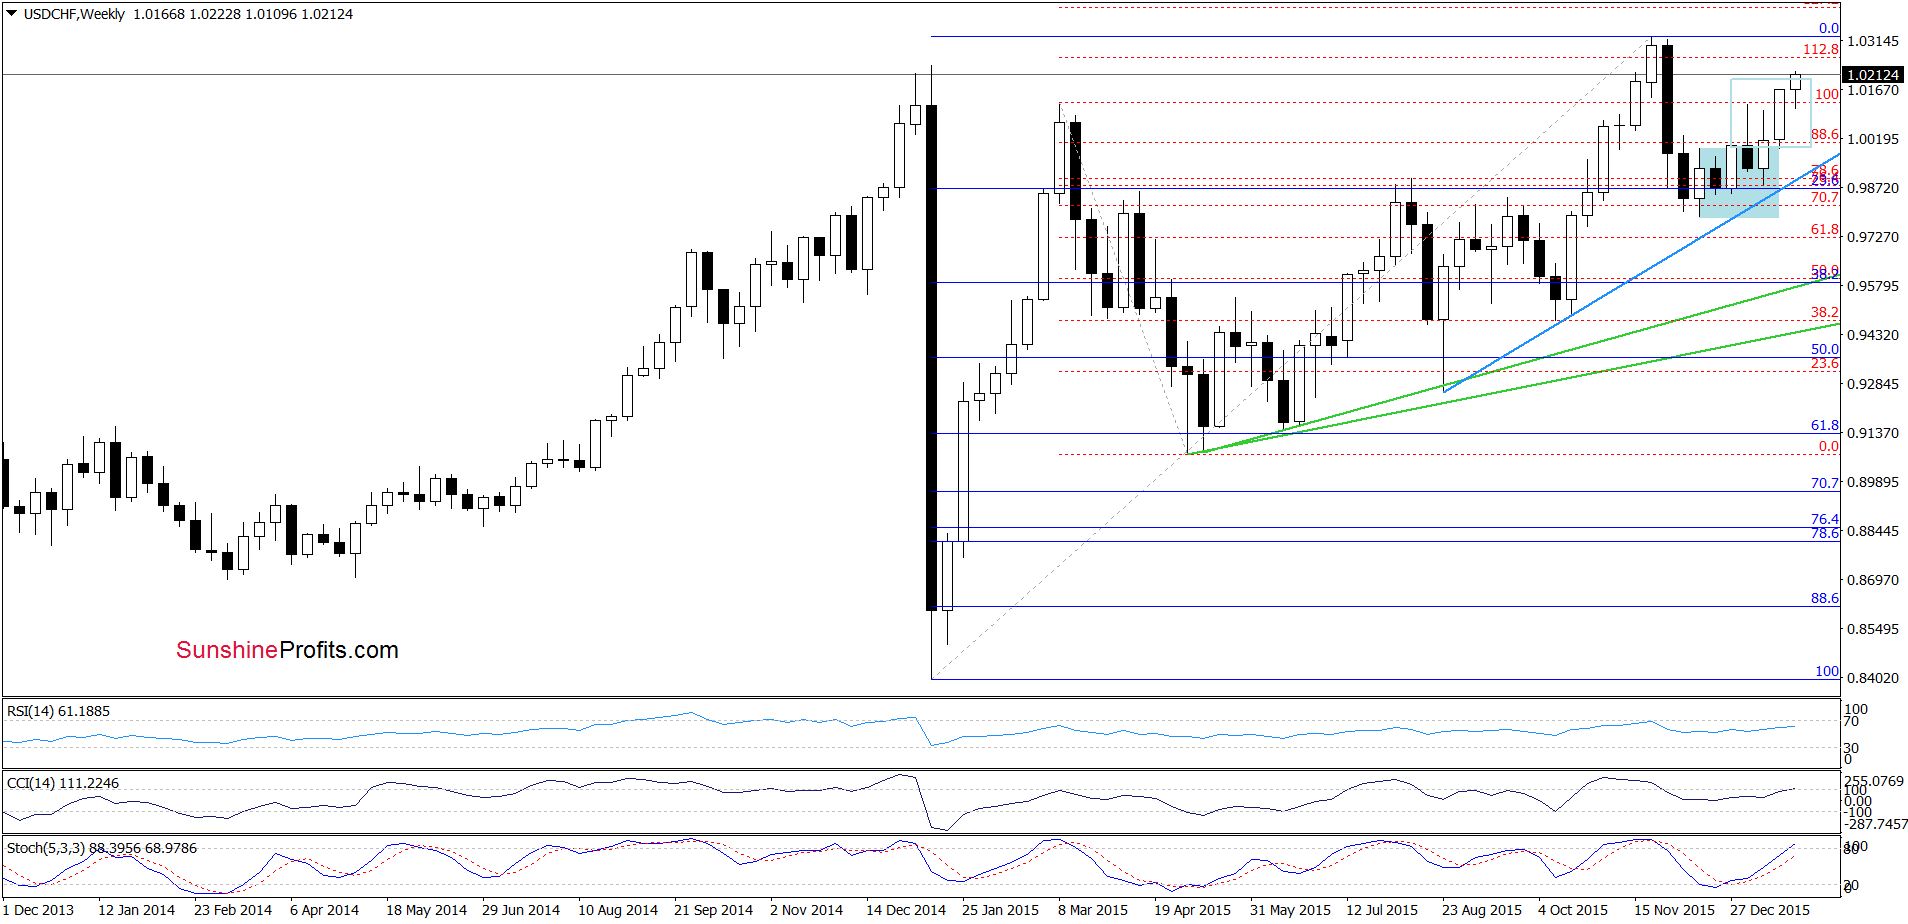
(…) the pair remains above the previously-broken red declining line, which suggests that as long as there are no sell signals generated by the indicators, another attempt to move higher can’t be ruled out. Therefore, if we see an increase from here, the next upside target would be around 1.0196-1.0211, where the size of the upward move will correspond to the height of the blue consolidation (marked on the weekly chart) and where 76.4% and 78.6% Fibonacci retracements (based on the Nov-Dec declines) are.
From today’s point of view, we see that currency bulls pushed the pair higher as we had expected. With this upward move, USD/CHF not only reached our upside targets, but also broke above the 76.4% and 78.6% Fibonacci retracements, which suggests a test of the upper border of the green rising trend channel in the coming day(s). Nevertheless, the current position of the indicators suggests that reversal is just around the corner.
Very short-term outlook: mixed
Short-term outlook: mixed
MT outlook: mixed
LT outlook: mixed
Trading position (short-term; our opinion): No positions are justified from the risk/reward perspective at the moment. We will keep you informed should anything change, or should we see a confirmation/invalidation of the above.
AUD/USD
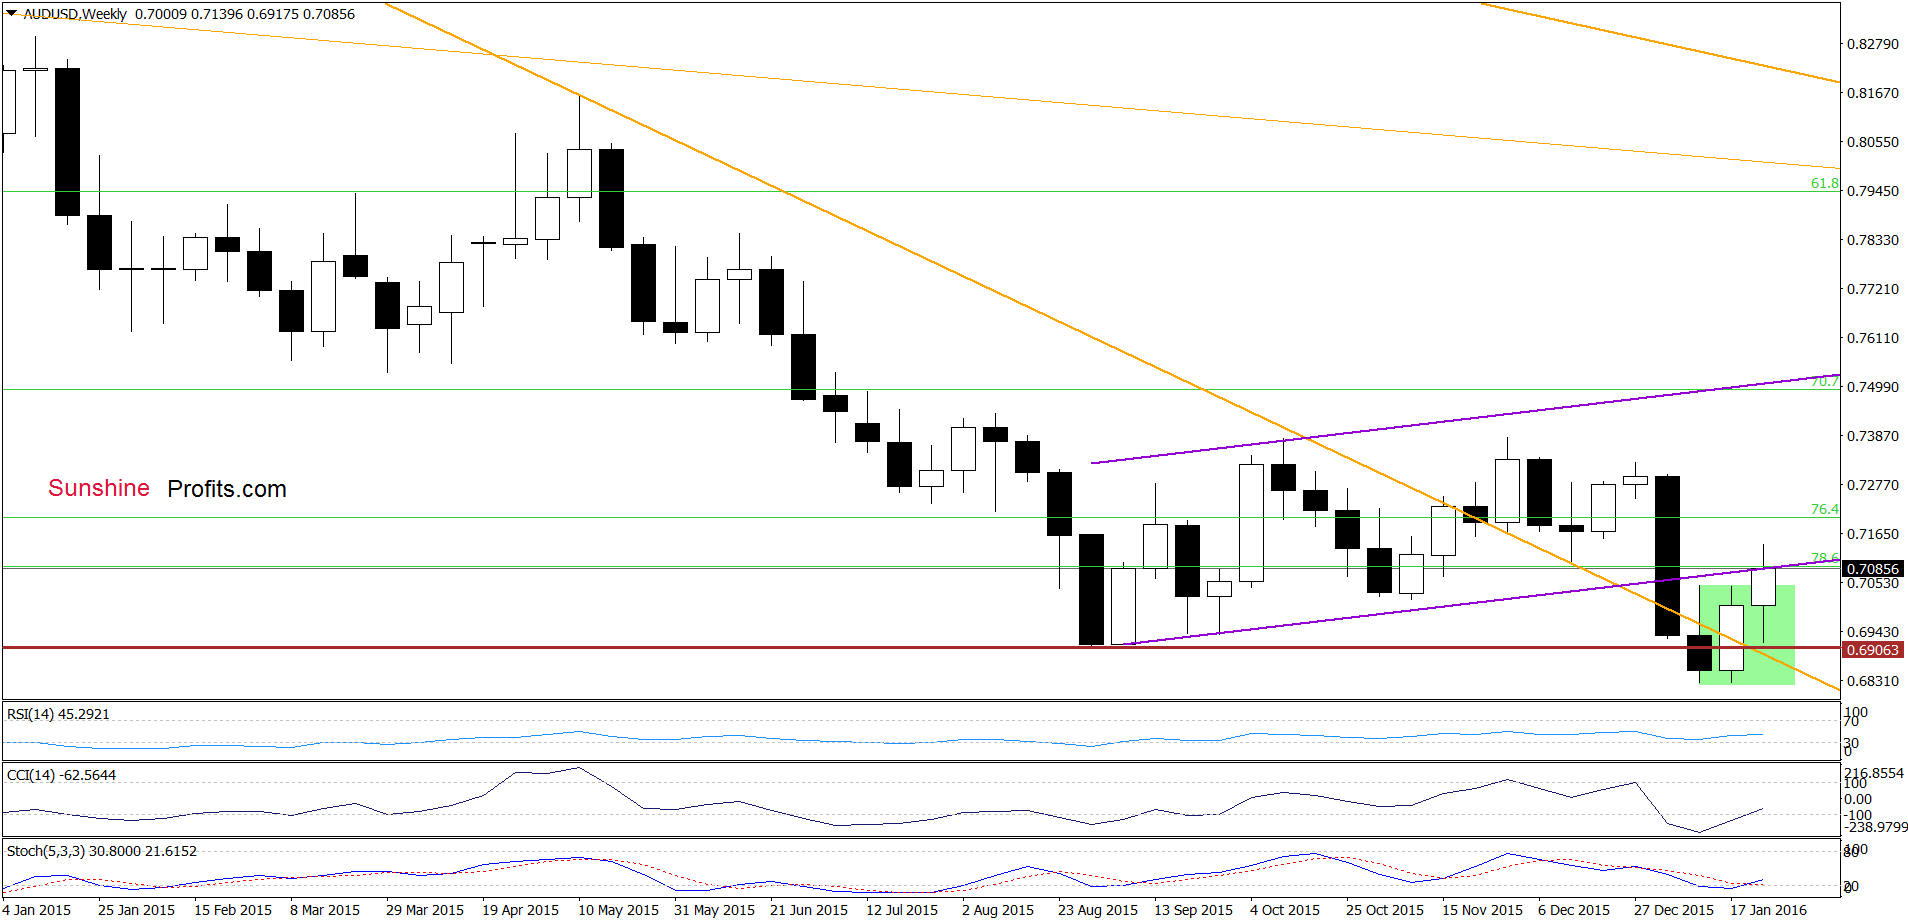
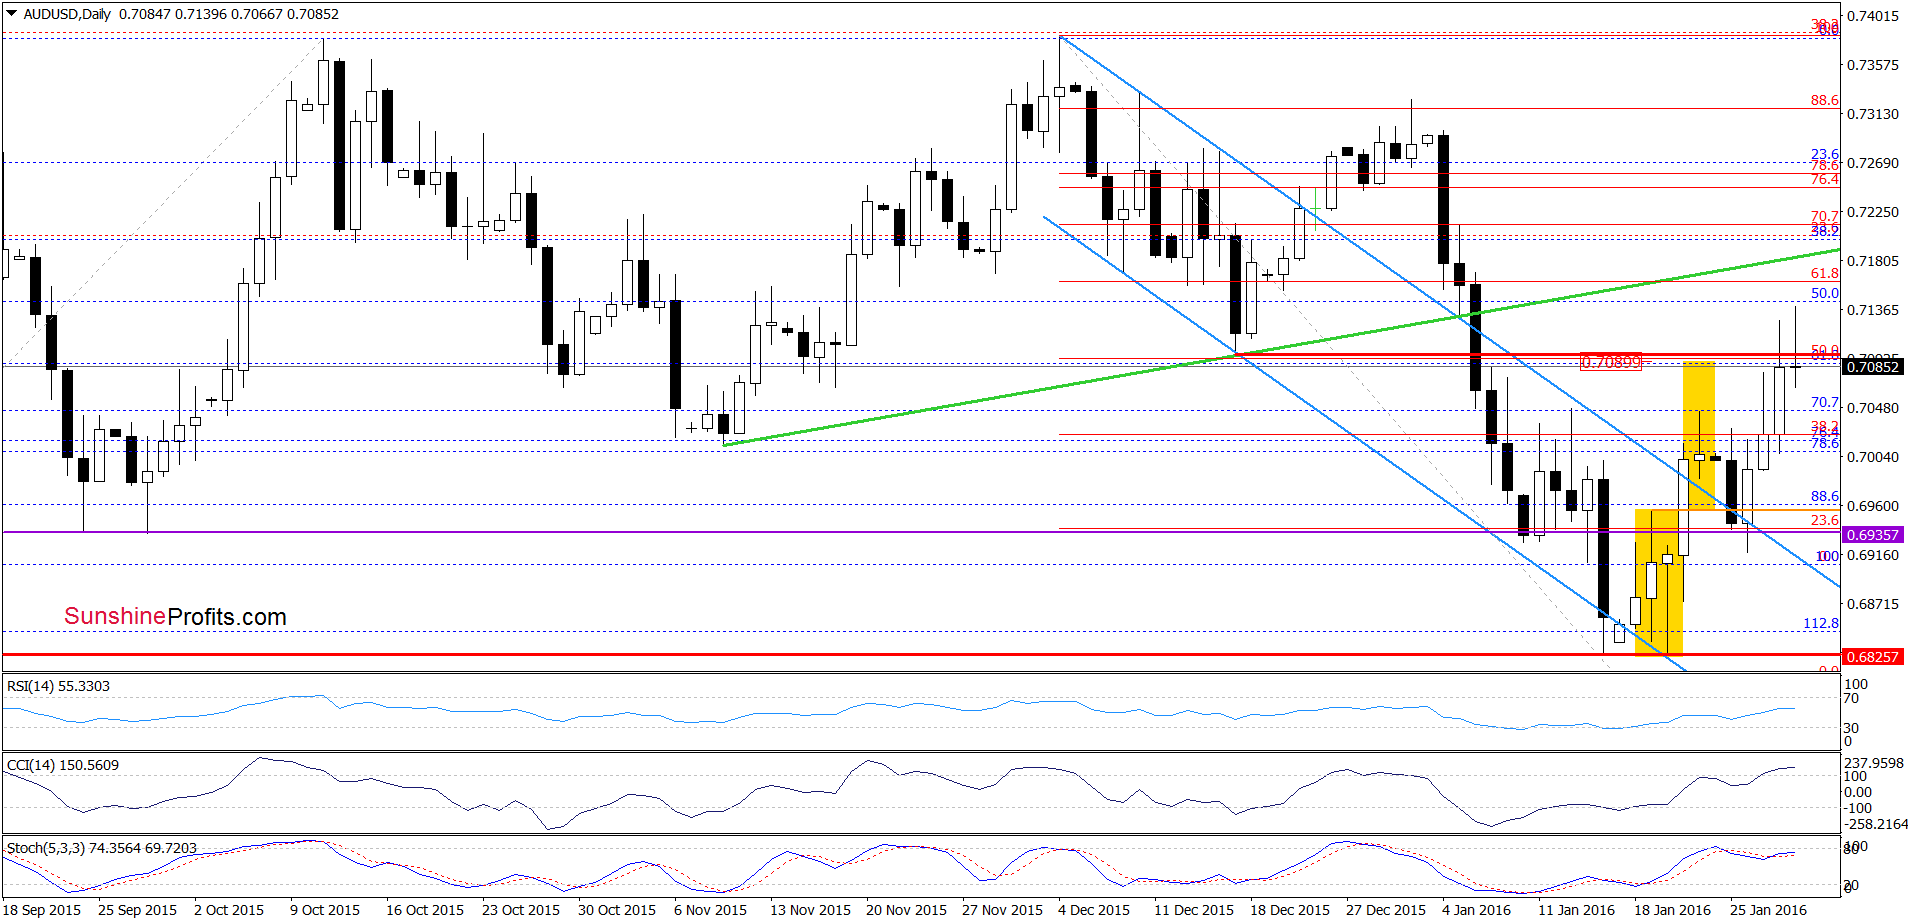
Looking at the above charts, we see that although AUD/USD moved higher earlier today, currency bulls didn’t manage to hold gained levels, which resulted in a pullback and a comeback below the lower border of the purple rising trend channel (marked on the weekly chart). Therefore, our last commentary on this currency pair is up-to-date also today:
(…) the pair also climbed to the mid-Dec low and the previously-broken lower border of the purple rising trend channel, which suggests that we may see a pullback from here in the coming day(s). If we see such price action, the pair will decline to the purple horizontal line and the upper border of the blue declining trend channel once again.
Very short-term outlook: mixed with bearish bias
Short-term outlook: mixed
MT outlook: mixed
LT outlook: mixed
Trading position (short-term; our opinion): No positions are justified from the risk/reward perspective. We will keep you informed should anything change, or should we see a confirmation/invalidation of the above.
Thank you.
Nadia Simmons
Forex & Oil Trading Strategist
Przemyslaw Radomski, CFA
Founder, Editor-in-chief
Gold & Silver Trading Alerts
Forex Trading Alerts
Oil Investment Updates
Oil Trading Alerts

