

Yesterday, the Canadian dollar moved sharply lower against its U.S. counterpart as the price of crude oil slipped under the barrier of $30 once again. Does it mean that a fresh Jan high is still ahead USD/CAD?
In our opinion the following forex trading positions are justified - summary:
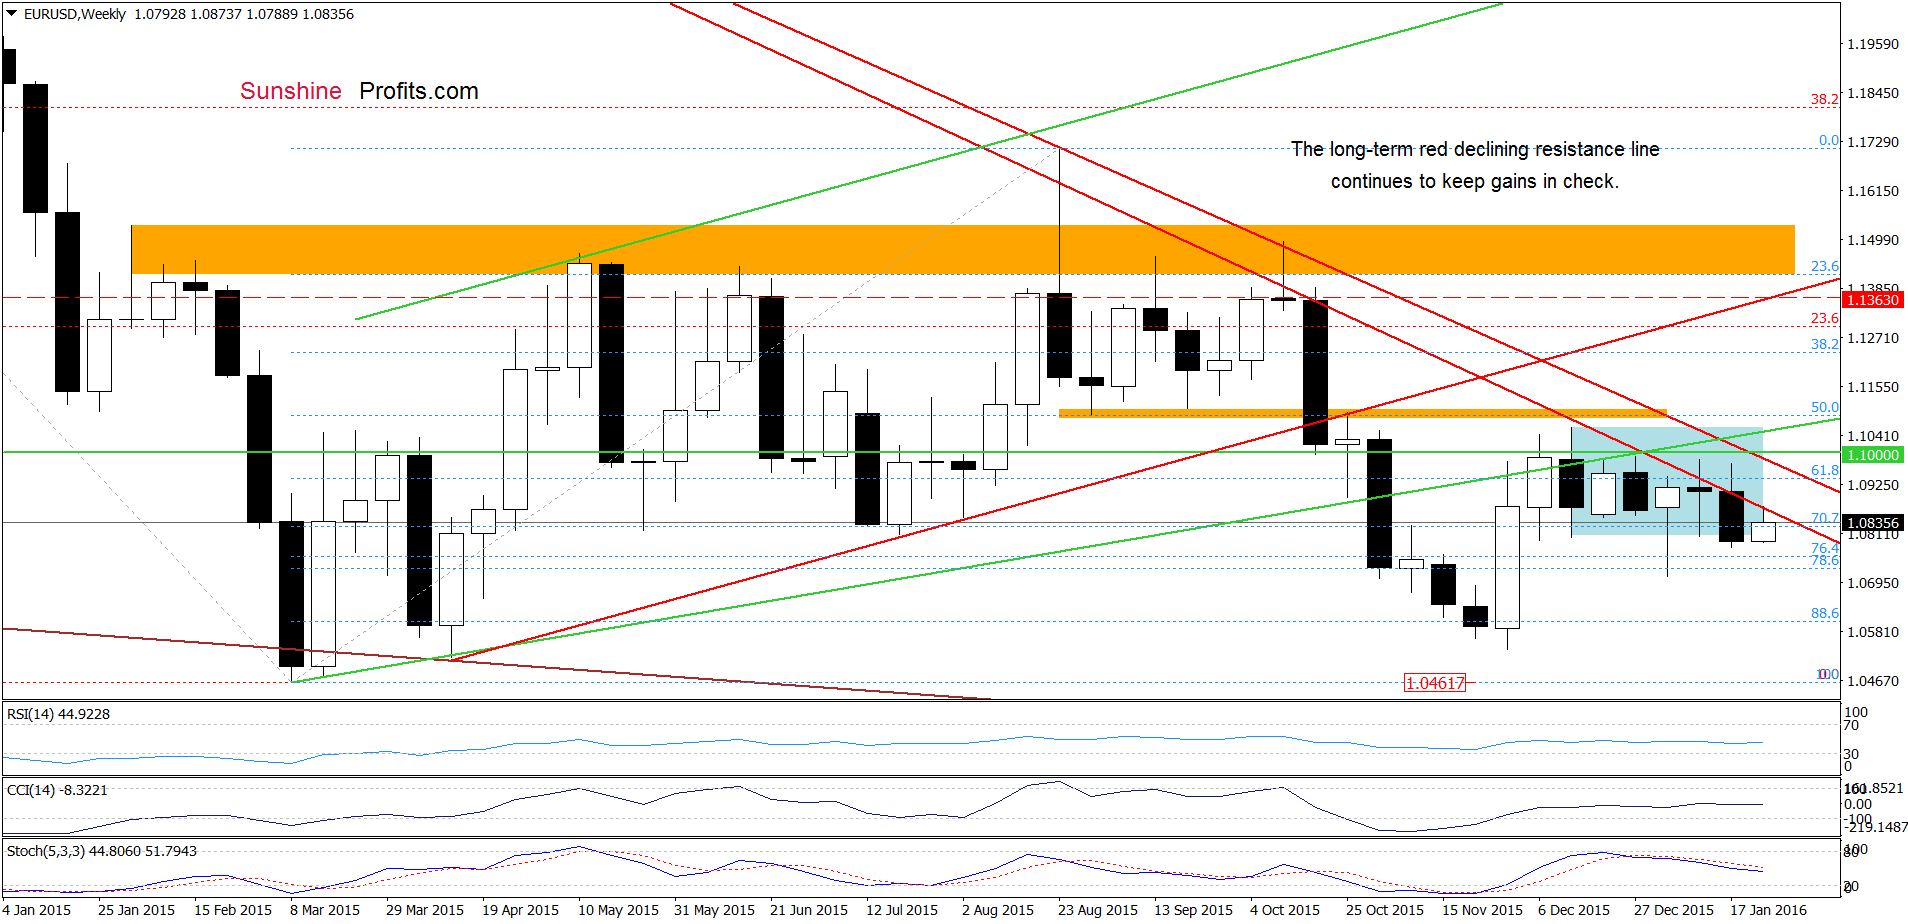
- EUR/USD: short (stop-loss order at 1.1363; initial downside target at 1.0462)
- GBP/USD: none
- USD/JPY: none
- USD/CAD: none
- USD/CHF: none
- AUD/USD: none
EUR/USD
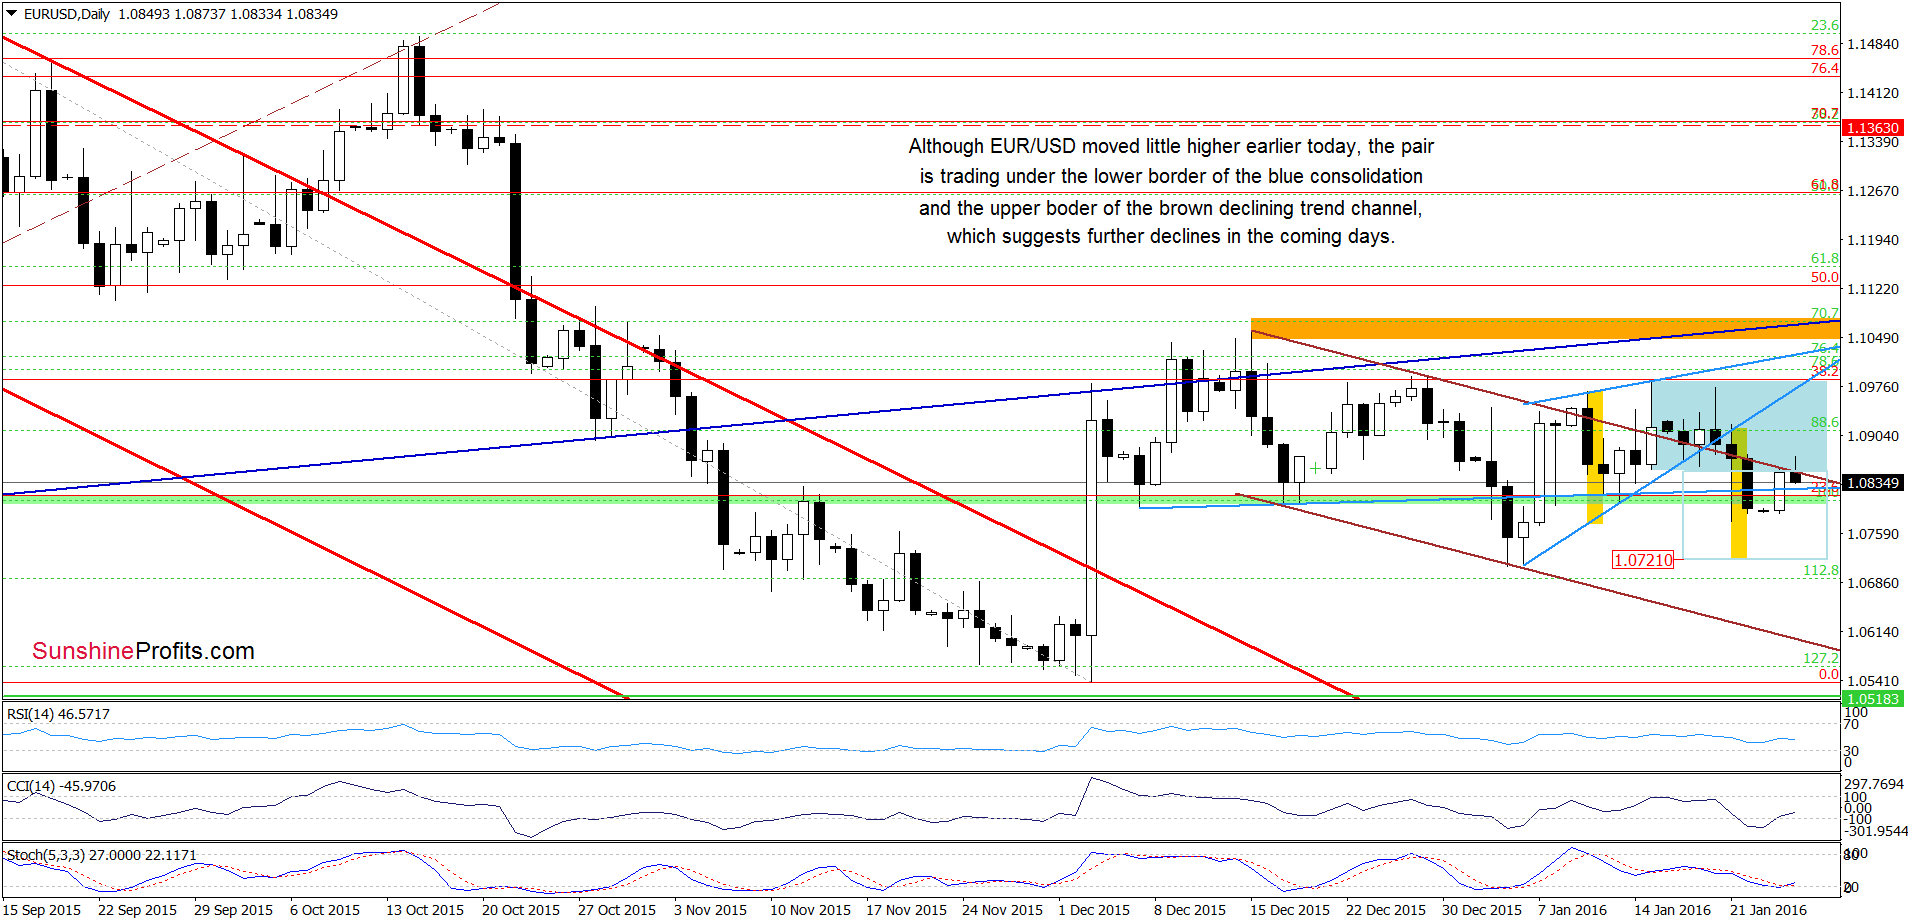
Looking at the daily chart, we see that although EUR/USD moved little higher earlier today, currency bulls didn’t manage to hold gained levels, which resulted in a comeback below the upper border of the brown declining trend channel. Such price action looks like a verification of earlier breakdown under this resistance line (and also the lower border of the blue consolidation), which is a negative signal that suggests further deterioration. If this is the case, and the pair declines from here in near future, our downside targets from Friday's Forex Trading Alert would be in play:
How low could the pair go in the coming days? As you see on the above chart, if the pair breaks under the green support zone, the initial downside target would be around 1.072, where the size of the downward move will correspond to the height of the above-mentioned formations. At this point, it is worth noting that if EUR/USD slips under the Jan low, the next downside target for currency bears would be the lower border of the brown trend channel (currently around 1.0617).
Very short-term outlook: bearish
Short-term outlook: bearish
MT outlook: bearish
LT outlook: mixed
Trading position (short-term; our opinion): Short positions (with a stop-loss order at 1.1363 and the initial downside target at 1.0462) are justified from the risk/reward perspective. We will keep you informed should anything change, or should we see a confirmation/invalidation of the above.
USD/CAD
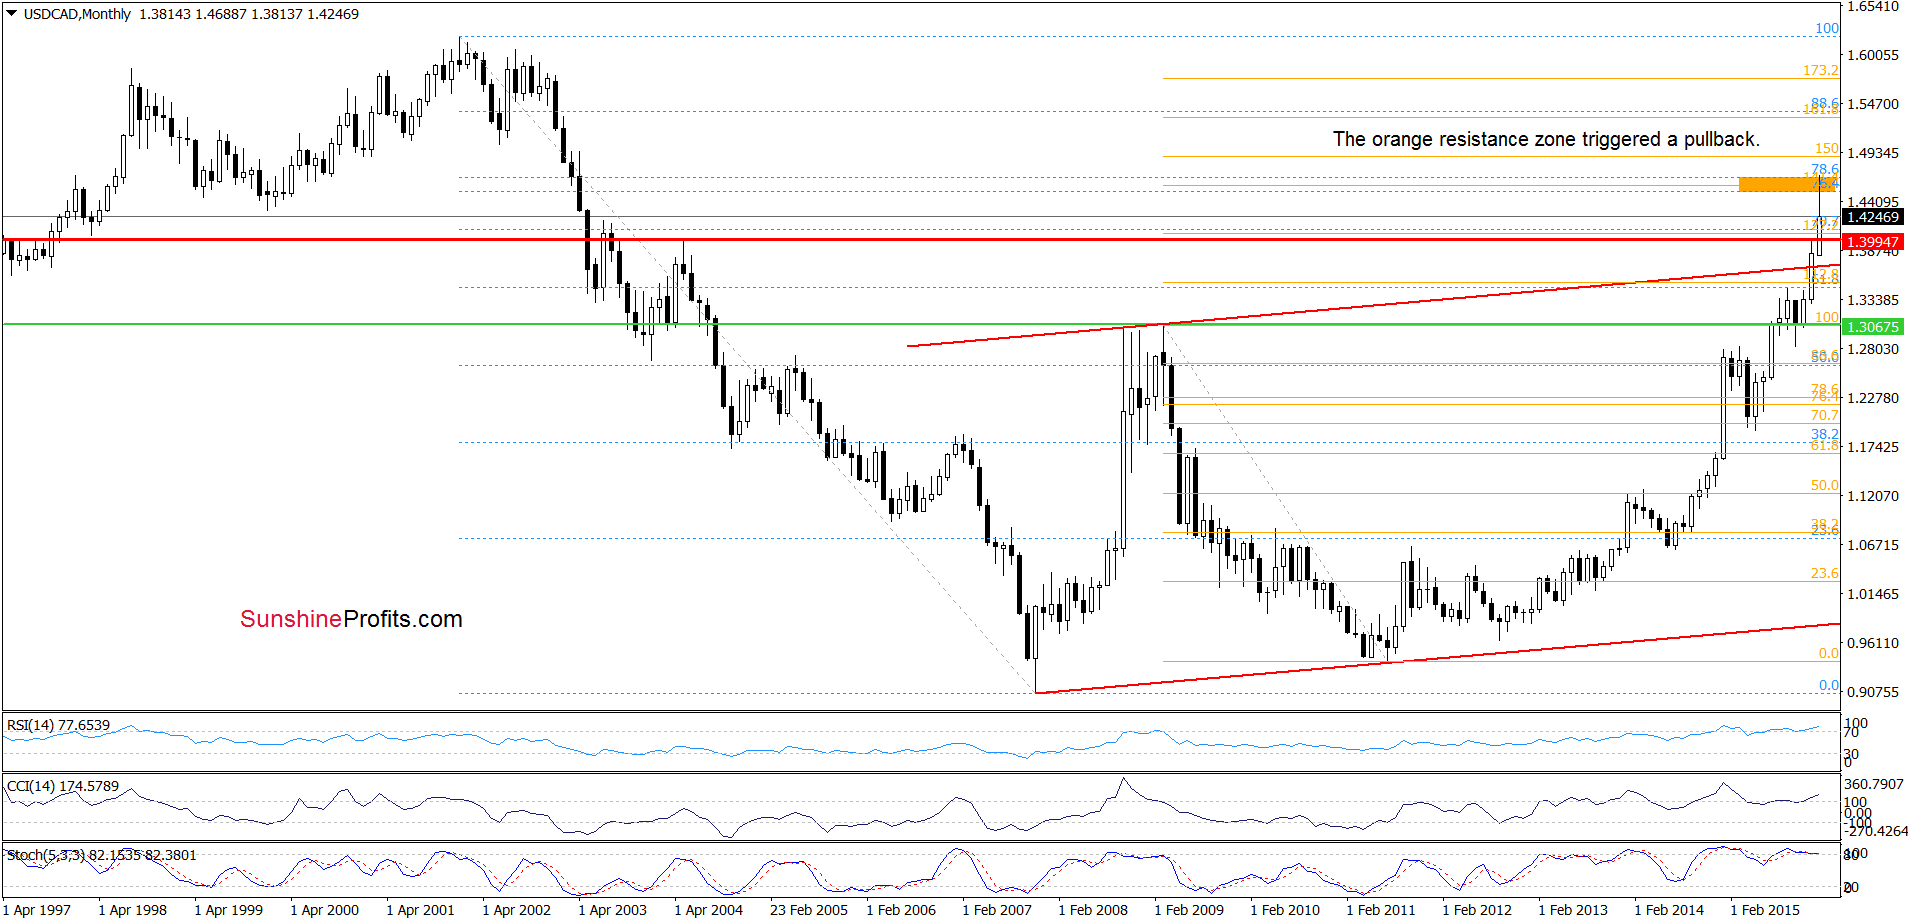
On the weekly charts we see that the orange resistance zone continues to keep gains in check. Will the very short-term chart give us more clues about future moves? Let’s check.
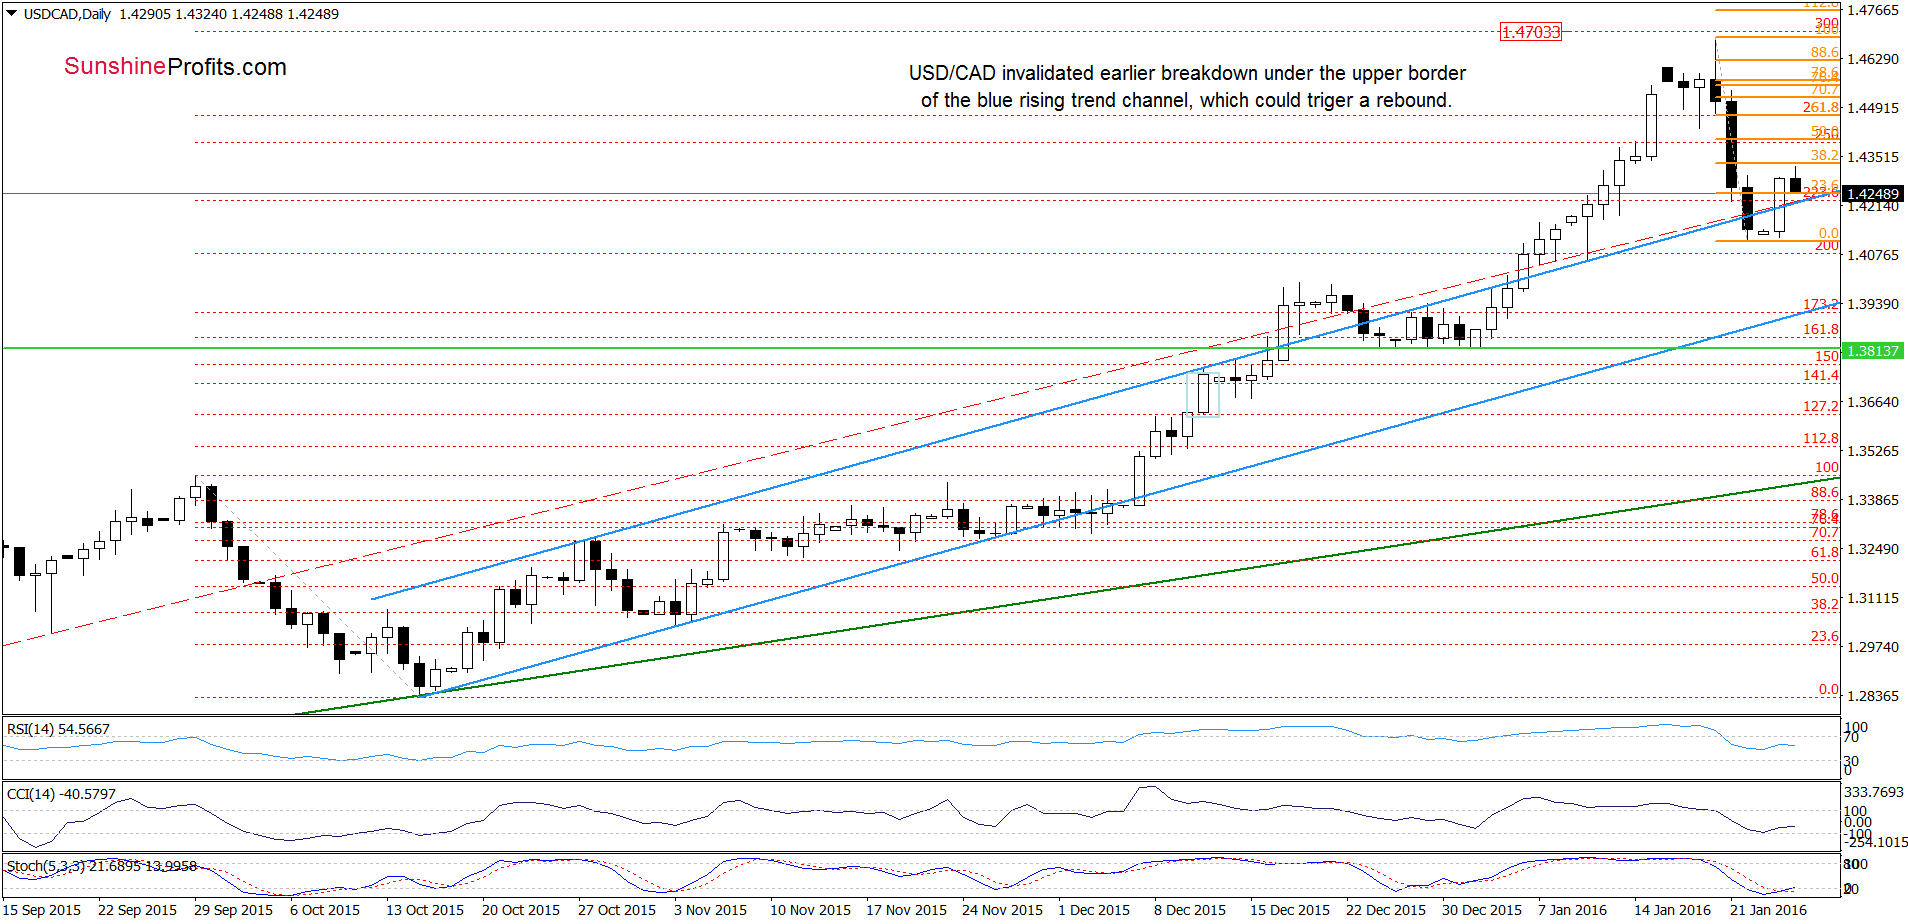
From this perspective we see that although USD/CAD declined under the previously-broken upper border of the blue rising trend channel, currency bulls pushed the pair higher yesterday, which resulted in an invalidation of earlier breakdown. As you see on the above chart, the proximity to the 38.2% Fibonacci retracement (based on the recent decline) triggered a pullback earlier today, which will likely translate into a drop to the blue support line later in the day. If it withstands the selling pressure, we’ll see further improvement from here and a test of higher Fibonacci retracements. Nevertheless, if currency bears manage to push the exchange rate below it, the next downside target would be around 1.4000, where the Dec highs and the 38.2% Fibonacci retracement (based on the Oct-Jan rally) are.
Very short-term outlook: mixed
Short-term outlook: mixed
MT outlook: mixed
LT outlook: mixed
Trading position (short-term; our opinion): No positions are justified from the risk/reward perspective at the moment. We will keep you informed should anything change, or should we see a confirmation/invalidation of the above.
AUD/USD
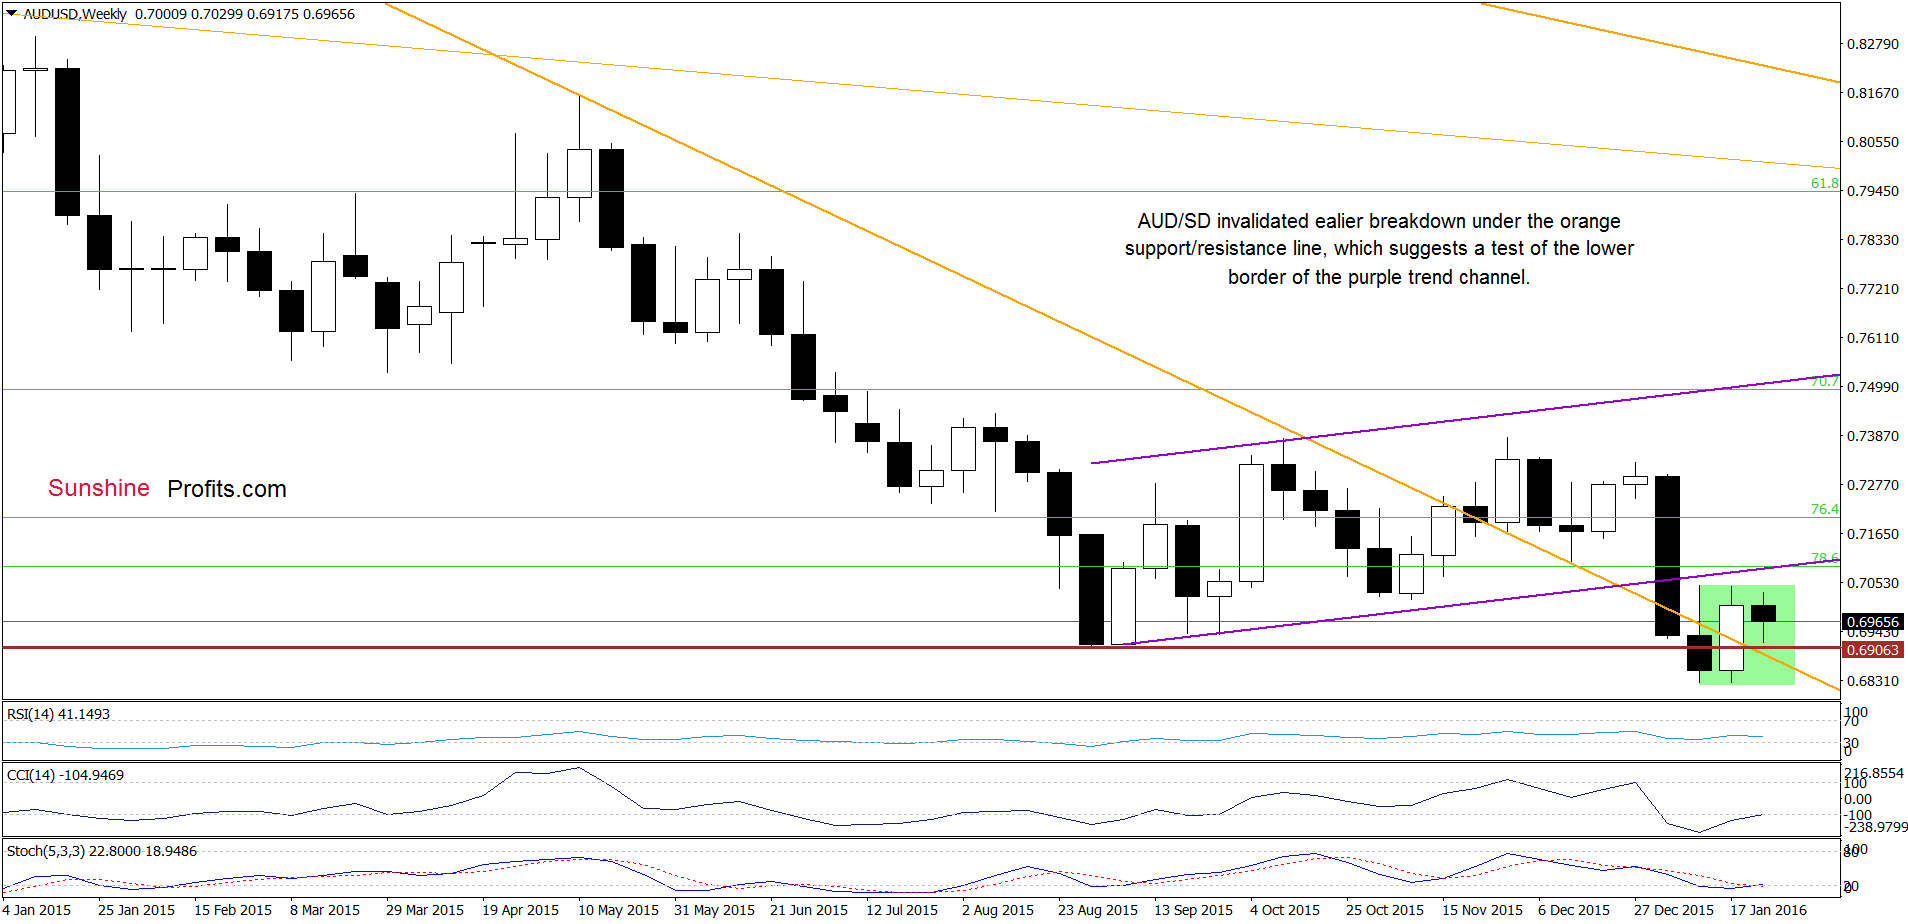
On the medium-term chart, we see that AUD/USD invalidated earlier breakdown under the long-term orange support/resistance line, which suggests further improvement (especially when we factor in the current position of the indicators). However, in our opinion, such price action would be more likely (and reliable) if the pair breaks above the upper border of the green consolidation. Until this time, short-lived moves in both directions can’t be ruled out.
Having said that, let’s focus on the daily chart. What can we infer from it? Let’s check.
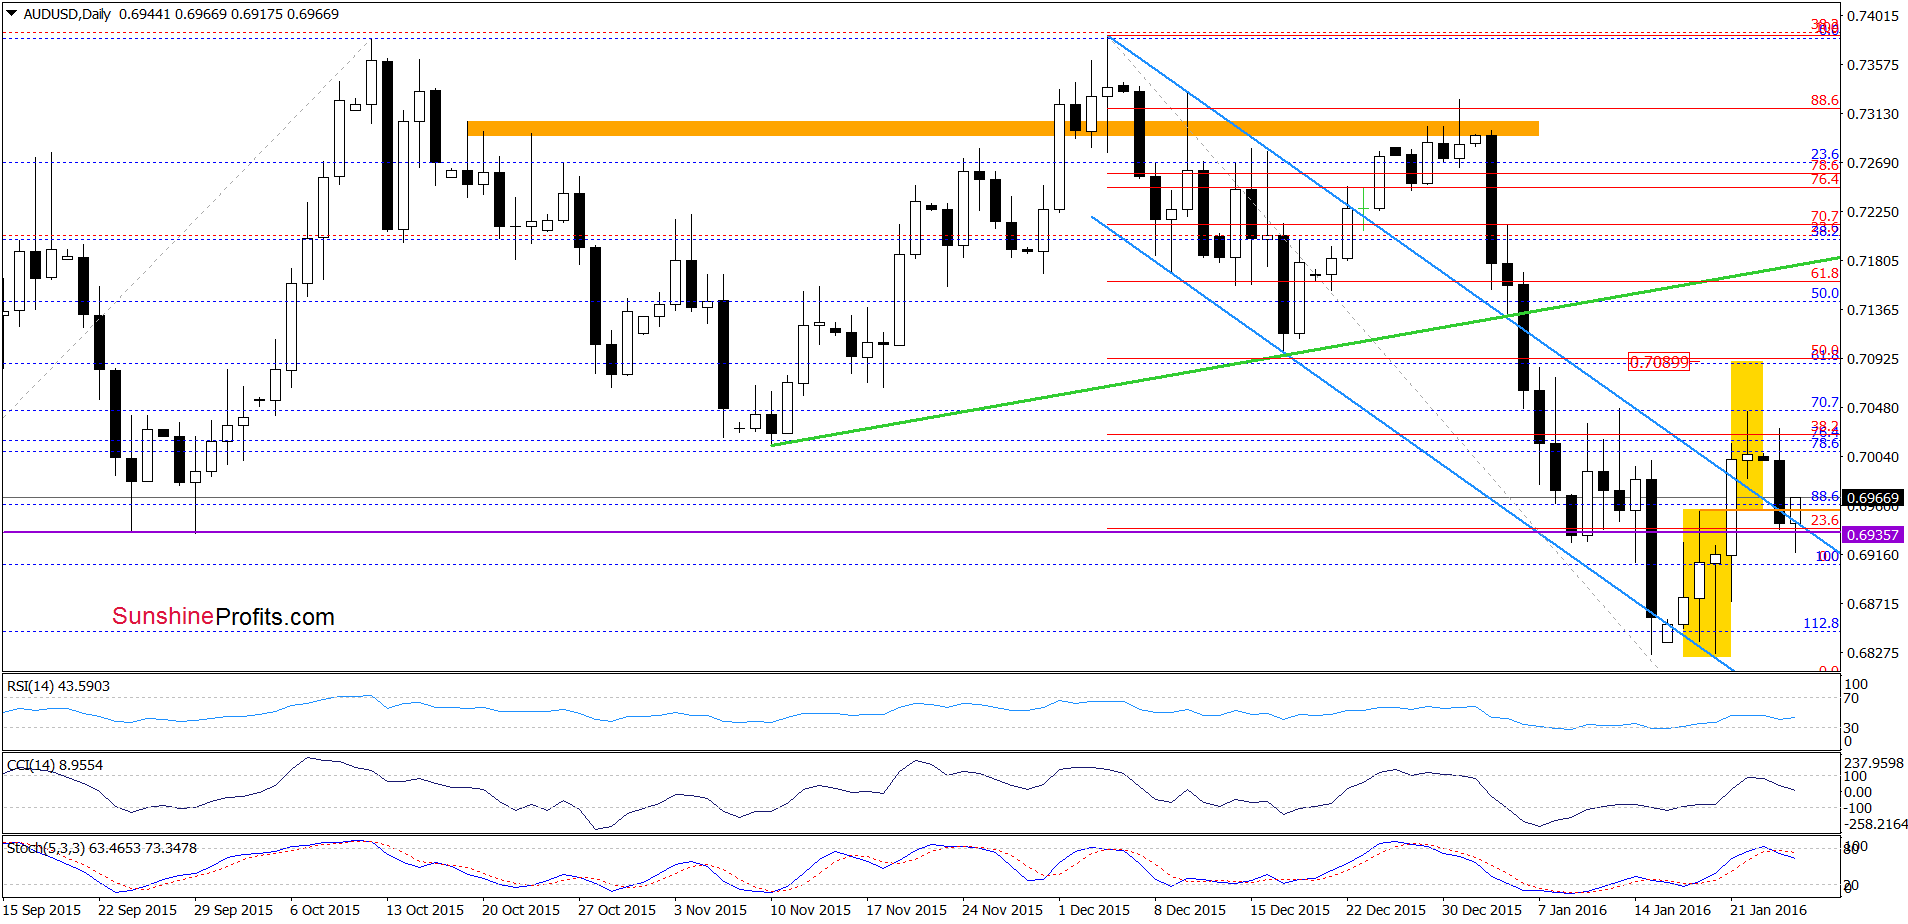
From this perspective we see that the 38.2% Fibonacci retracement (based on the Dec-Jan declines) triggered a pullback to the previously-broken purple horizontal line and the upper border of the blue declining trend channel. As you see on the chart, the exchange rate bounced off this support area earlier today, which looks like a verification of the Thursday’s breakout. If this is the case, and the pair extends gains from here, we may see an increase to around 0.7090, where the size of the upward move will correspond to the high of the double bottom formation (marked with yellow) and where the 50% Fibonacci retracement (based on the Dec-Jan declines) is.
Very short-term outlook: mixed with bullish bias
Short-term outlook: mixed
MT outlook: mixed
LT outlook: mixed
Trading position (short-term; our opinion): No positions are justified from the risk/reward perspective. We will keep you informed should anything change, or should we see a confirmation/invalidation of the above.
Thank you.
Nadia Simmons
Forex & Oil Trading Strategist
Przemyslaw Radomski, CFA
Founder, Editor-in-chief
Gold & Silver Trading Alerts
Forex Trading Alerts
Oil Investment Updates
Oil Trading Alerts

