

Yesterday, ECB president Mario Draghi indicated that stimulus measures could be implemented before the end of the first quarter, which pushed the euro sharply lower against the greenback. Earlier today, EUR/USD extended losses and slipped under important support line. What happened at the same time with other currency pairs?
In our opinion the following forex trading positions are justified - summary:
- EUR/USD: short (stop-loss order at 1.1363; initial downside target at 1.0462)
- GBP/USD: none
- USD/JPY: none
- USD/CAD: none
- USD/CHF: none
- AUD/USD: none
EUR/USD
Yesterday, we wrote the following:
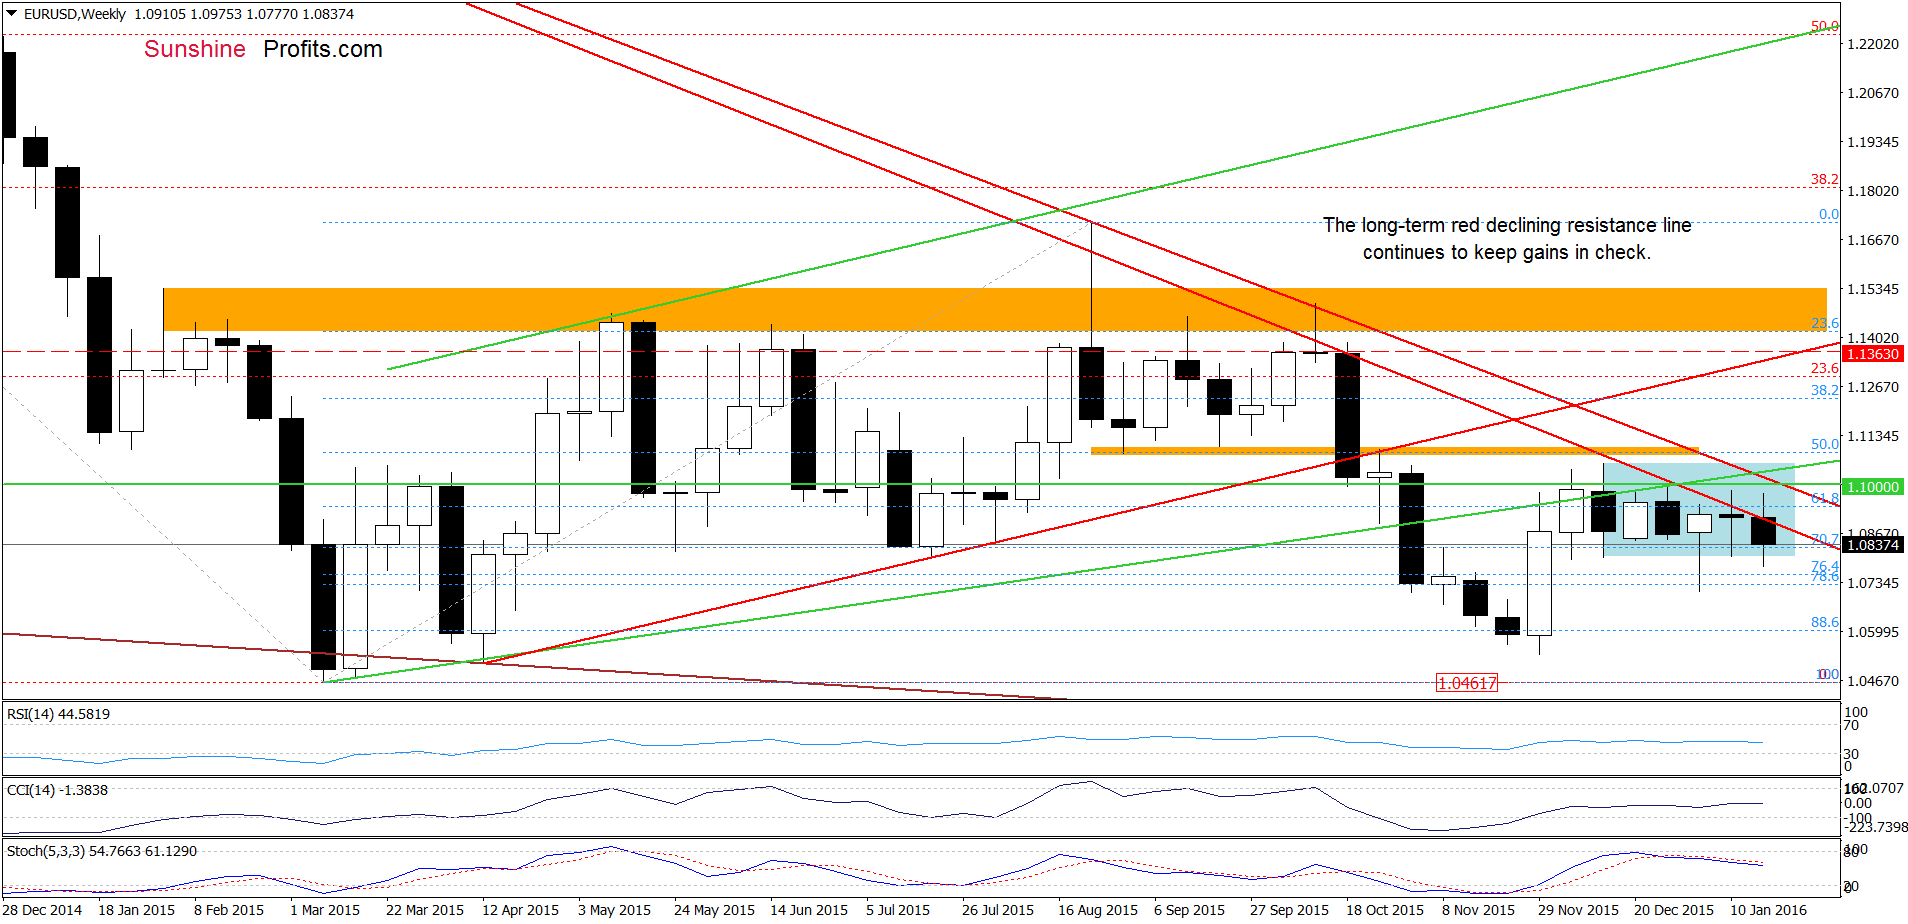
(…) although currency bulls pushed EUR/USD above the long-term red declining resistance line, this improvement was only temporary and the pair erased earlier gains. (…) What does it mean for the exchange rate? When we take a closer look at the weekly chart, we can notice see that there were similar situations in Aug and Oct. Back then, an invalidation of earlier breakout above the long-term red line was the first bearish signal before bigger decline. Taking this fact into account, we think that history will repeat itself once again and we’ll see another downward move in the coming week(s).
How did this move affect the very short-term picture? (…) the combination of the 38.2% Fibonacci retracement and the late Dec highs stopped further improvement – similarly to what we saw on Friday. Therefore, it seems that the pair will extend losses and we’ll see another attempt to break below the previously-broken upper border of the brown declining trend channel. If we see such price action, the initial downside target would be the green support zone.
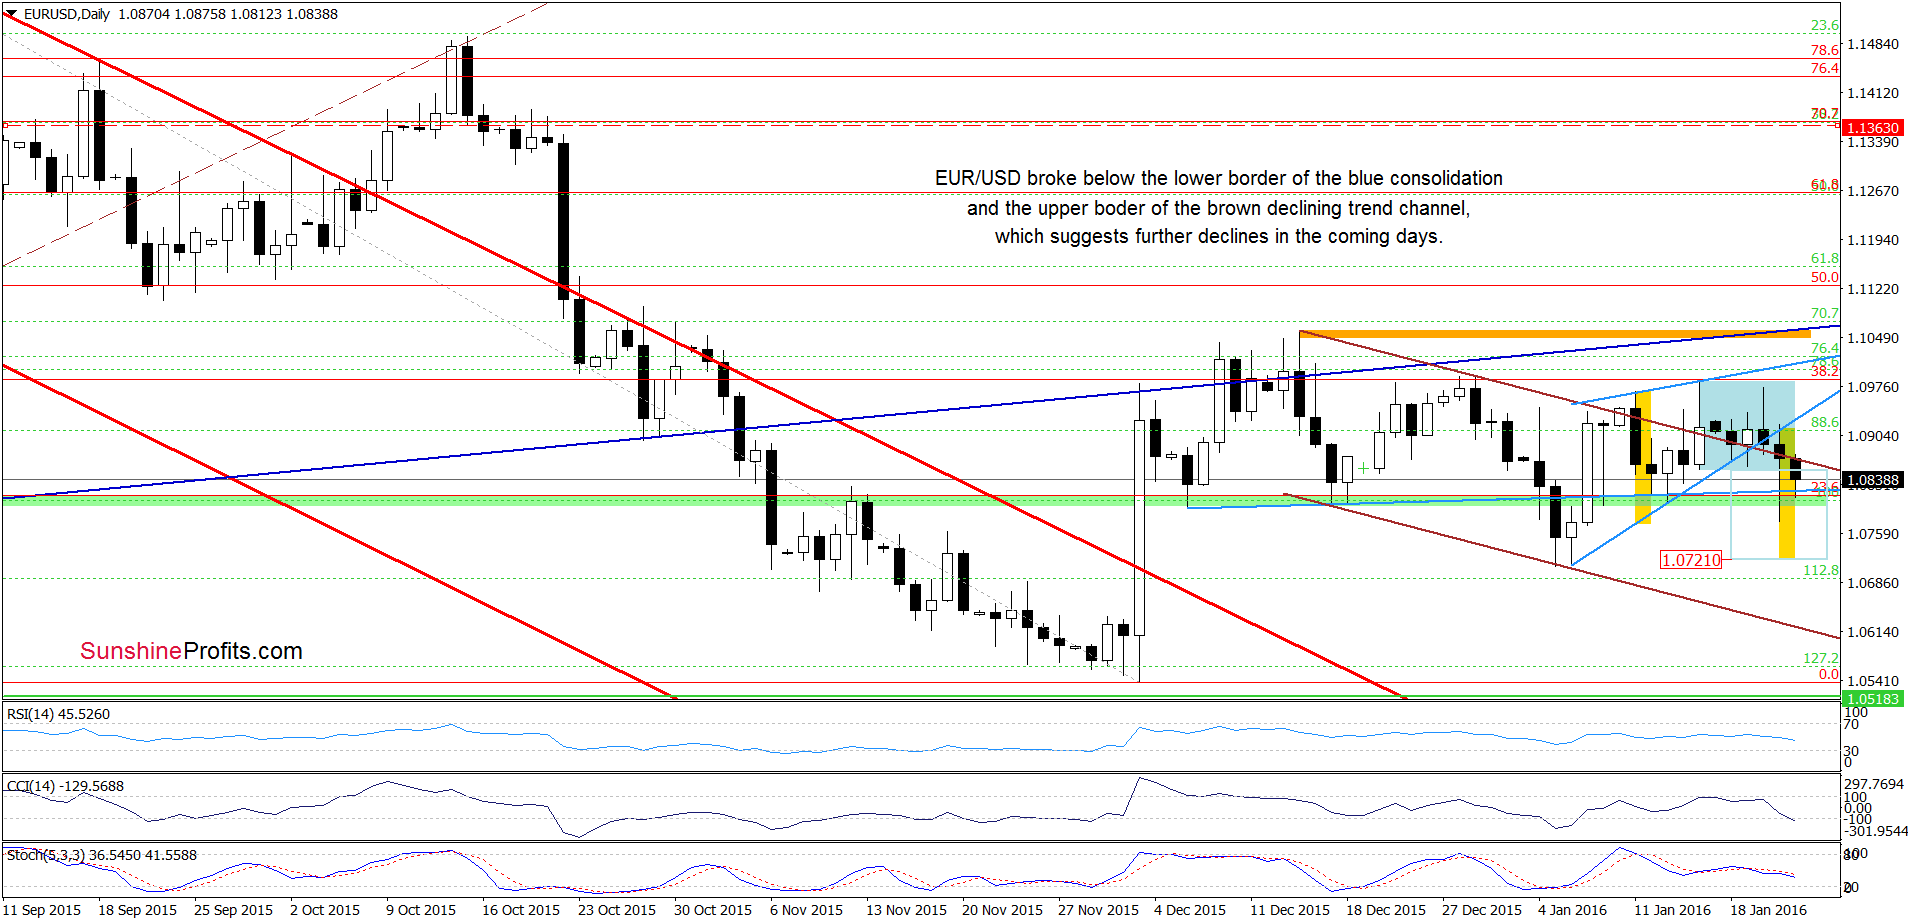
Looking at the charts, we see that the situation developed in line with the above scenario and EUR/USD reached our downside target earlier today. With this downward move, the pair slipped below the blue support line (the lower border of the blue rising wedge) and invalidated earlier breakout above the upper border of the brown declining trend channel. On top of that, yesterday’s downswing took the pair under the lower border of the blue consolidation, which all together do not bode well EUR/USD and suggest lower values of the exchange rate in the coming days. How low could the pair go in the coming days? As you see on the above chart, if the pair breaks under the green support zone, the initial downside target would be around 1.072, where the size of the downward move will correspond to the height of the above-mentioned formations. At this point, it is worth noting that if EUR/USD slips under the Jan low, the next downside target for currency bears would be the lower border of the brown trend channel (currently around 1.0617).
Very short-term outlook: bearish
Short-term outlook: bearish
MT outlook: bearish
LT outlook: mixed
Trading position (short-term; our opinion): Short positions (with a stop-loss order at 1.1363 and the initial downside target at 1.0462) are justified from the risk/reward perspective. We will keep you informed should anything change, or should we see a confirmation/invalidation of the above.
GBP/USD
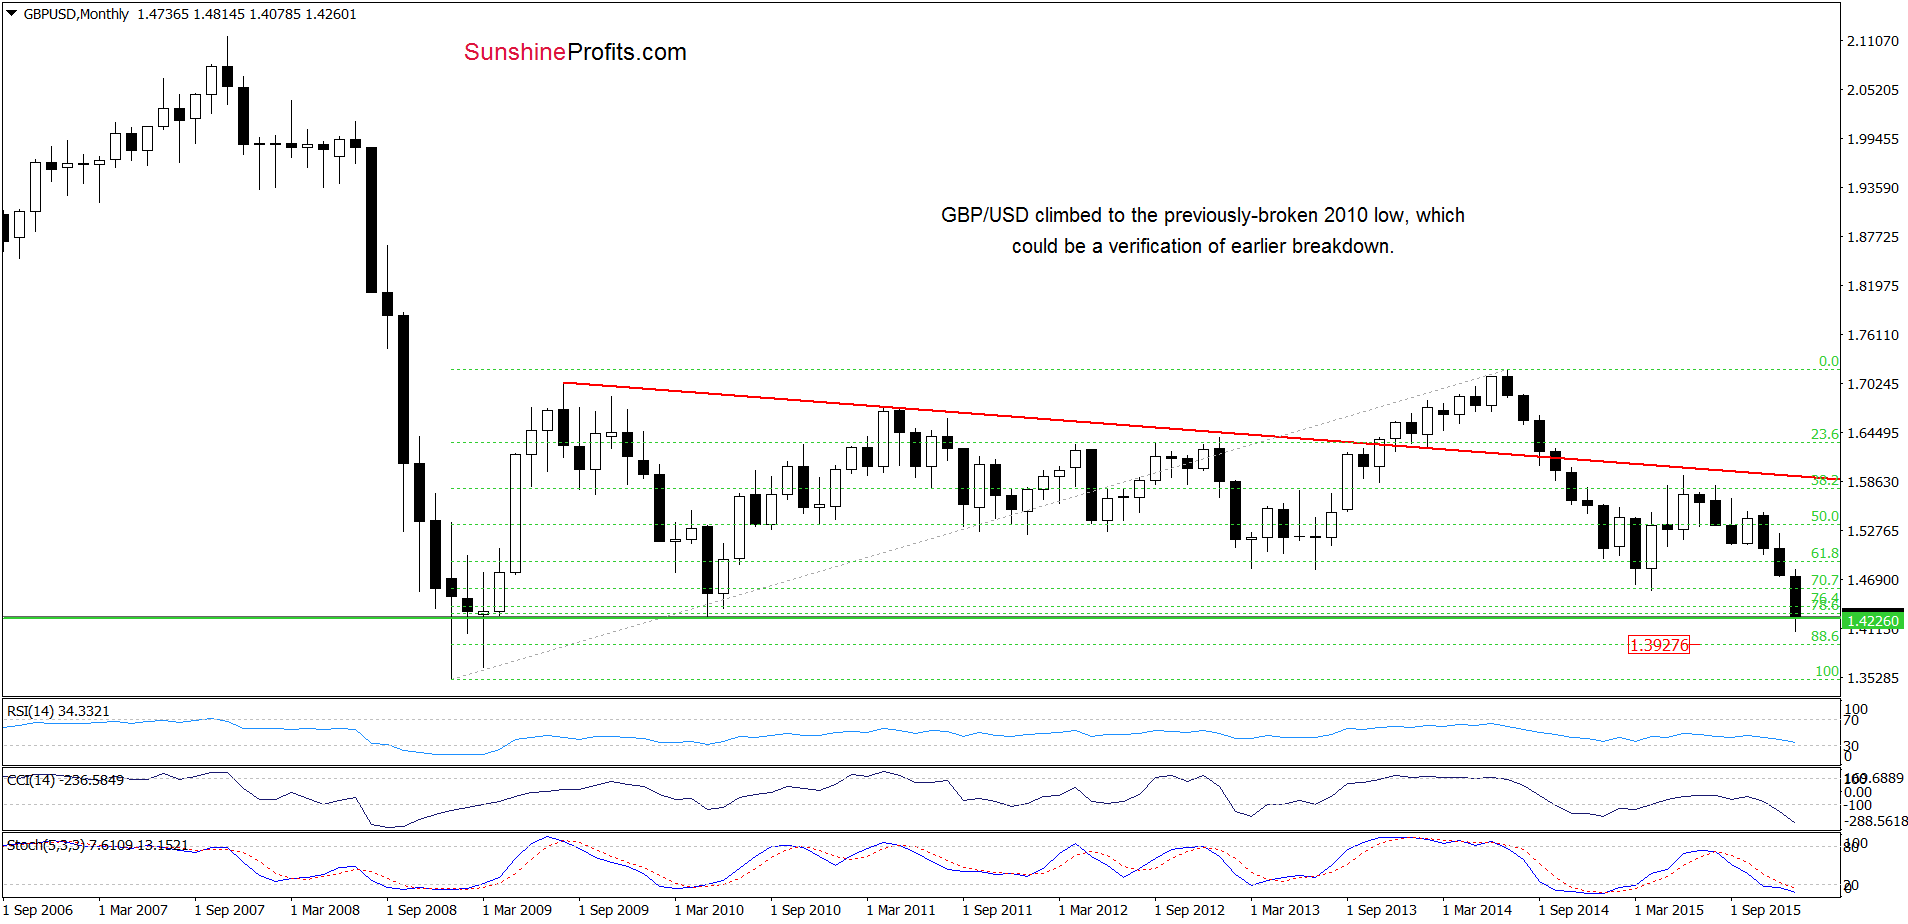
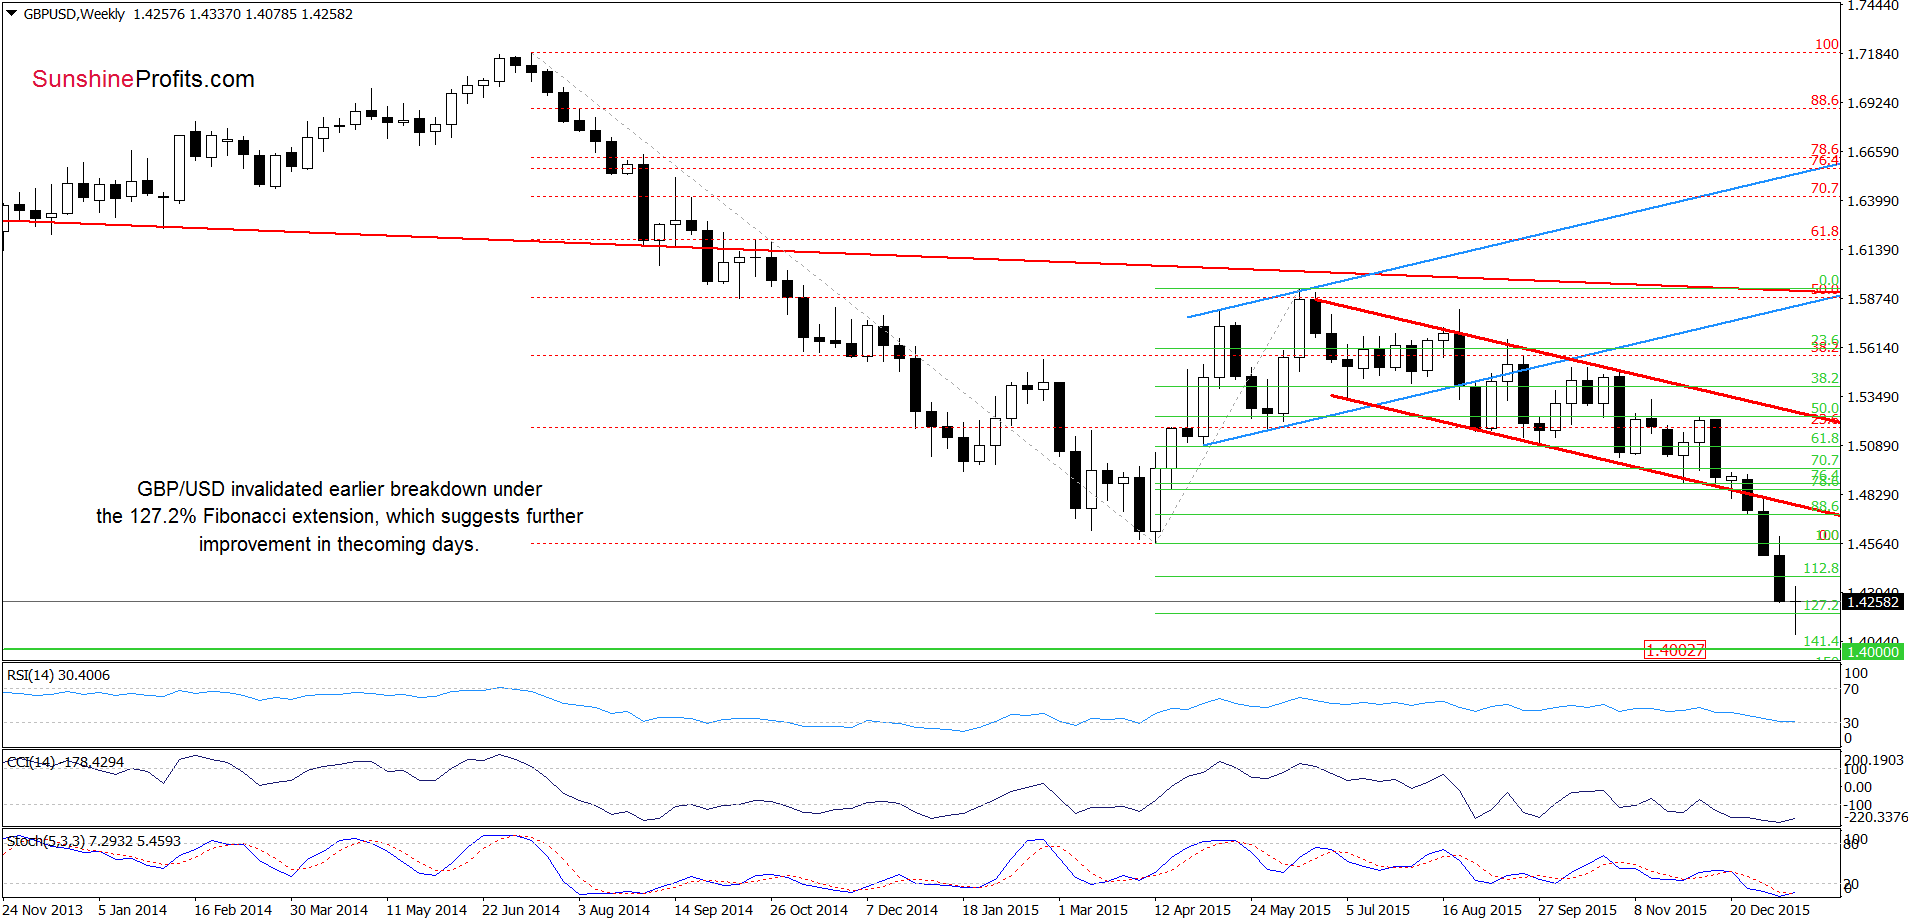
On the above chars, we see that GBP/USD reversed and rebounded, invalidating earlier breakdown under the 127.2% Fibonacci extension. Although this is a positive signal, which suggests further improvement, we think that as long as there is no weekly closure above the May 2010 low, further improvement is questionable. Nevertheless, if currency bulls manage to push the pair higher, and we’ll see such price action, the initial upside target would be around 1.4564, where the Apr 2015 low is.
Very short-term outlook: mixed
Short-term outlook: mixed
MT outlook: mixed
LT outlook: mixed
Trading position (short-term; our opinion): No positions are justified from the risk/reward perspective at the moment. We will keep you informed should anything change, or should we see a confirmation/invalidation of the above.
USD/JPY
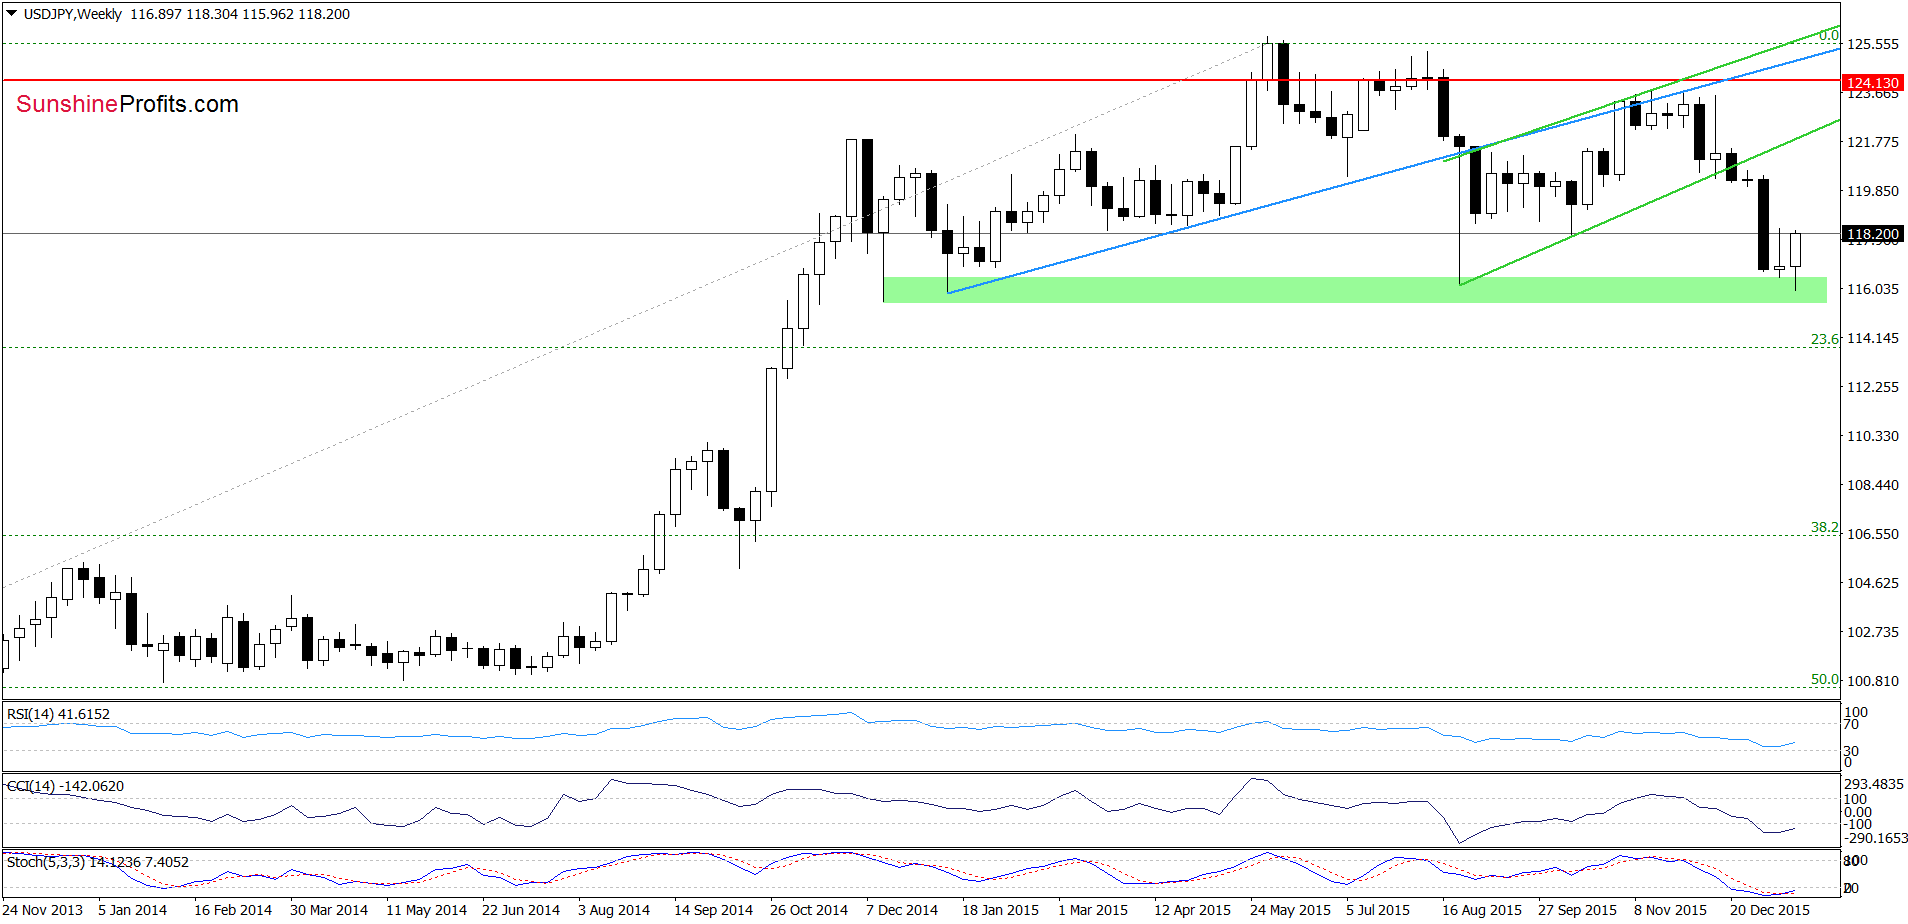
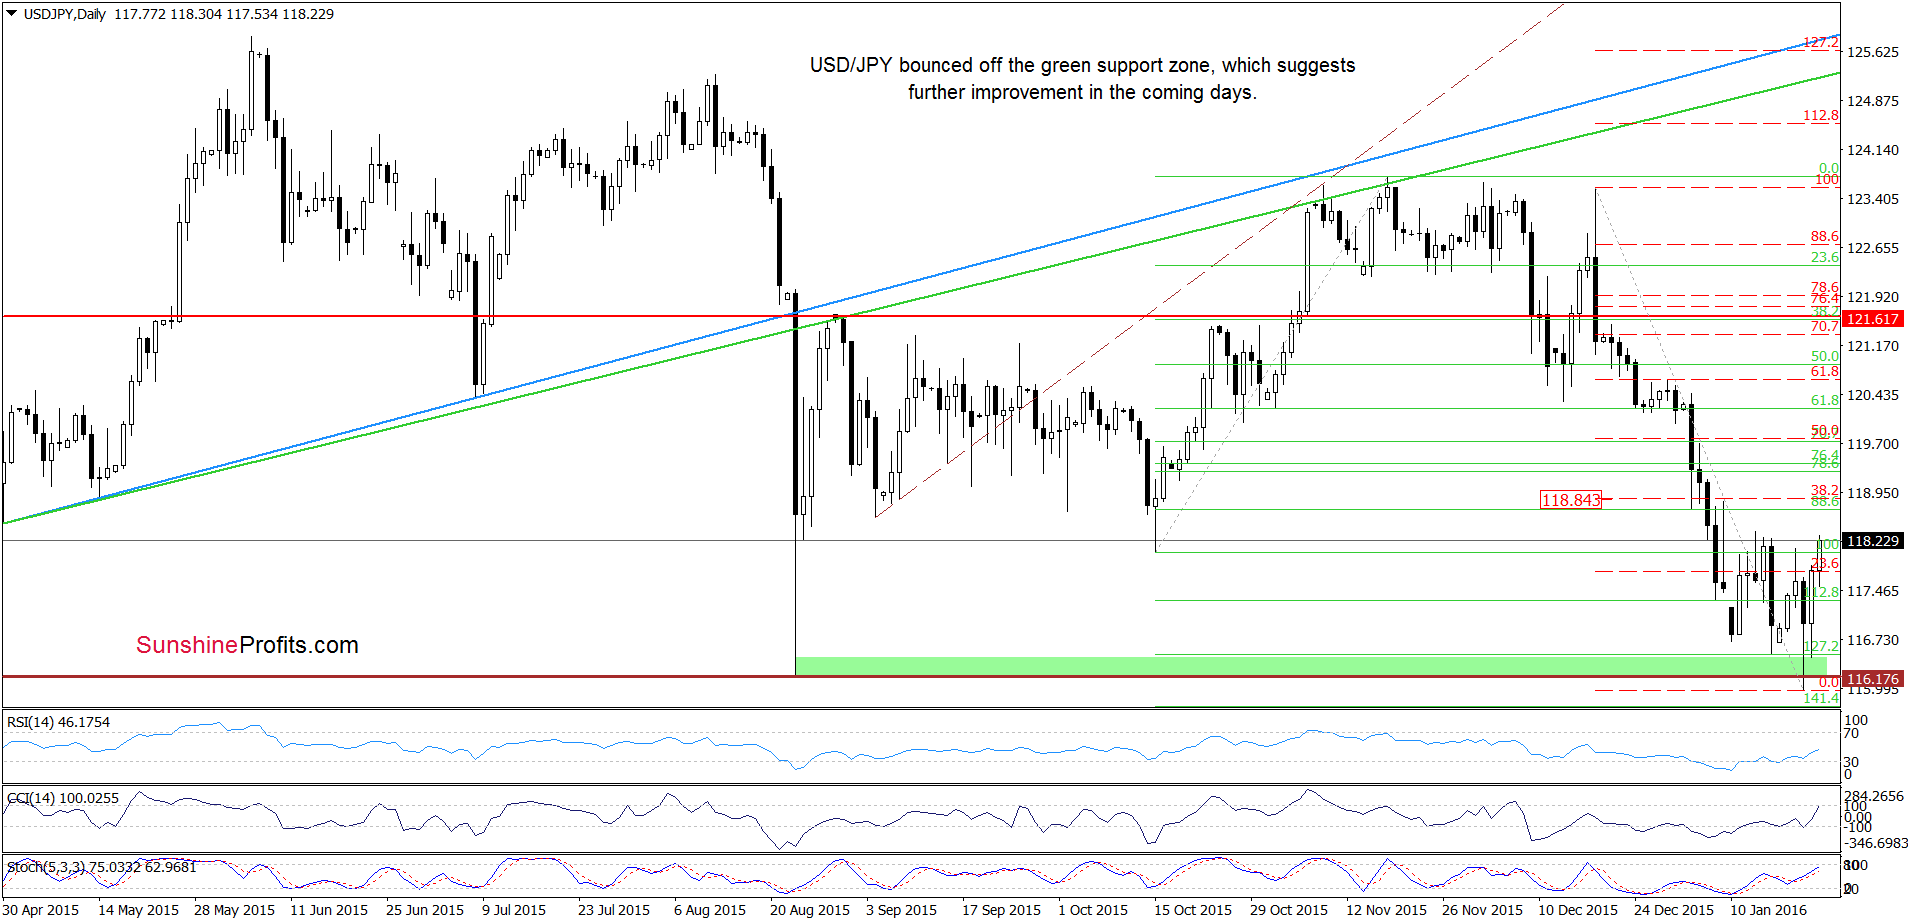
Looking at the above charts, we see that although USD/JPY dropped under the green support line currency bulls managed to invalidate this breakdown very quickly, which resulted in an increase not only above the 23.6% Fibonacci retracement, but also approached the pair to the last week’s highs. Taking this fact into account and combining it with the current position of the indicators, we think that further improvement is just around the corner. If this is the case, and the exchange rate moves higher from here, the next upside target for currency bulls would be around 118.84, where the 38.2% Fibonacci retracement (based on the Dec-Jan decline) is.
Very short-term outlook: mixed with bullish bias
Short-term outlook: mixed
MT outlook: mixed
LT outlook: mixed
Trading position (short-term; our opinion): No positions are justified from the risk/reward perspective at the moment. We will keep you informed should anything change, or should we see a confirmation/invalidation of the above.
USD/CAD
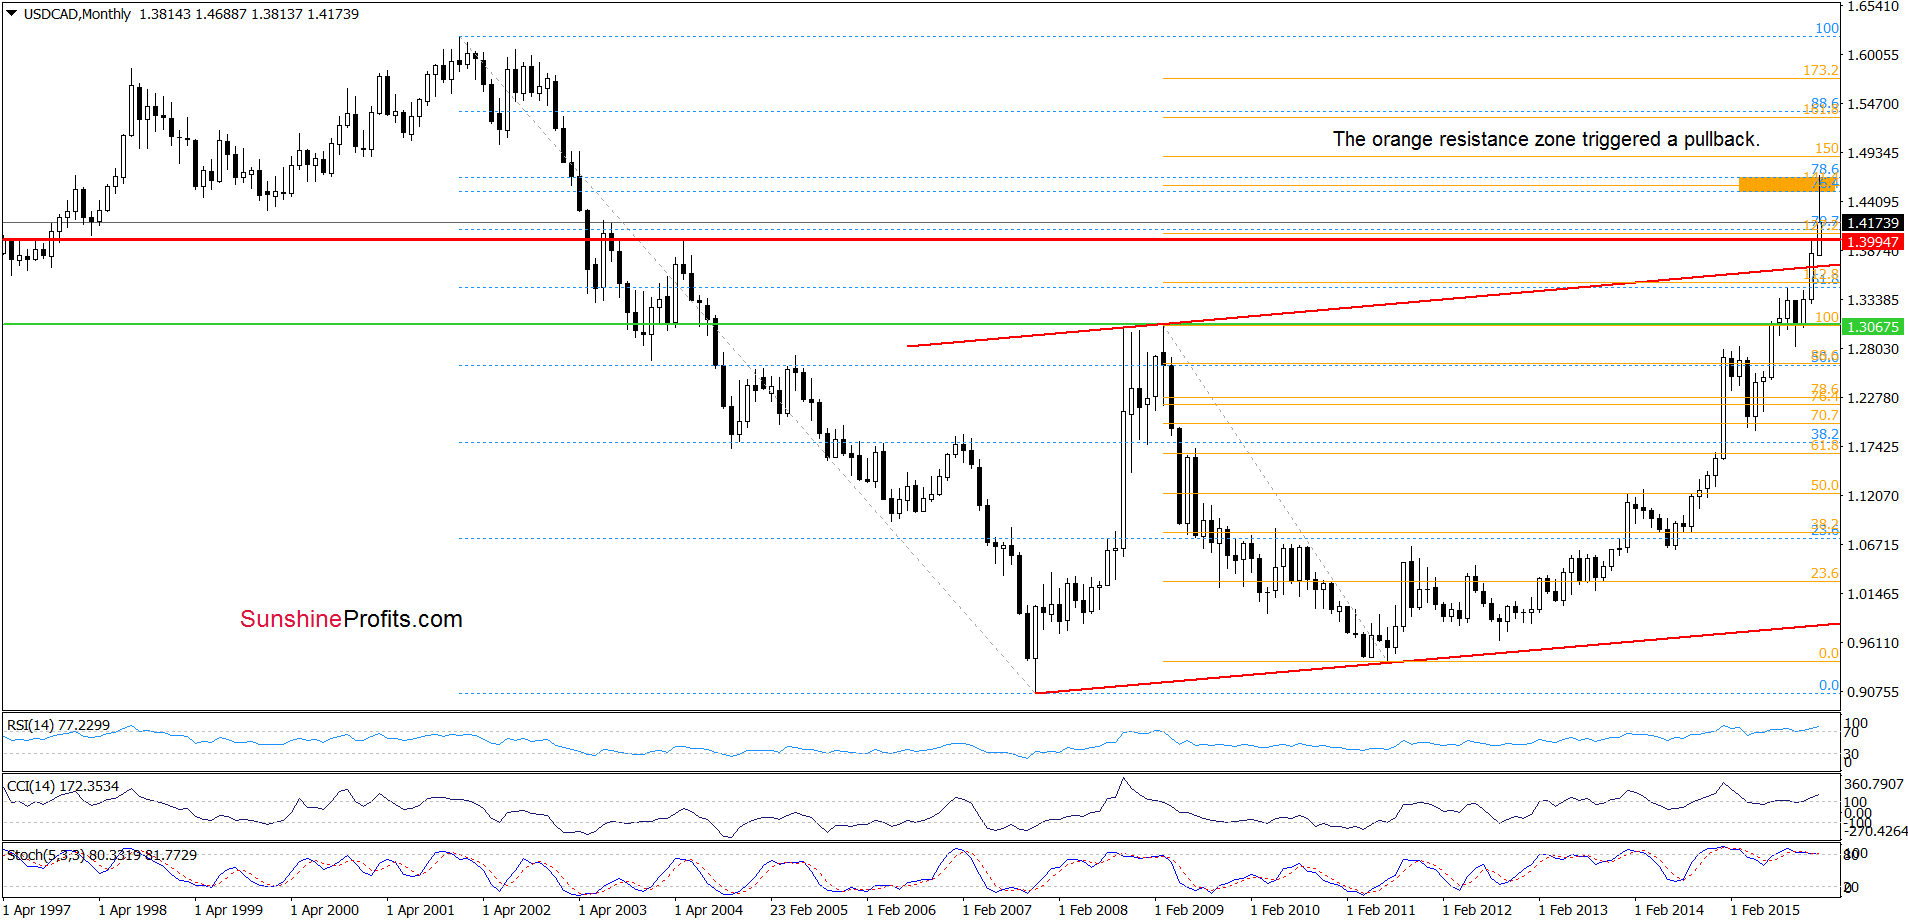
On the weekly charts we see that the orange resistance zone triggered a sharp pullback. What impact did this move have on the very short-term chart? Let’s check.
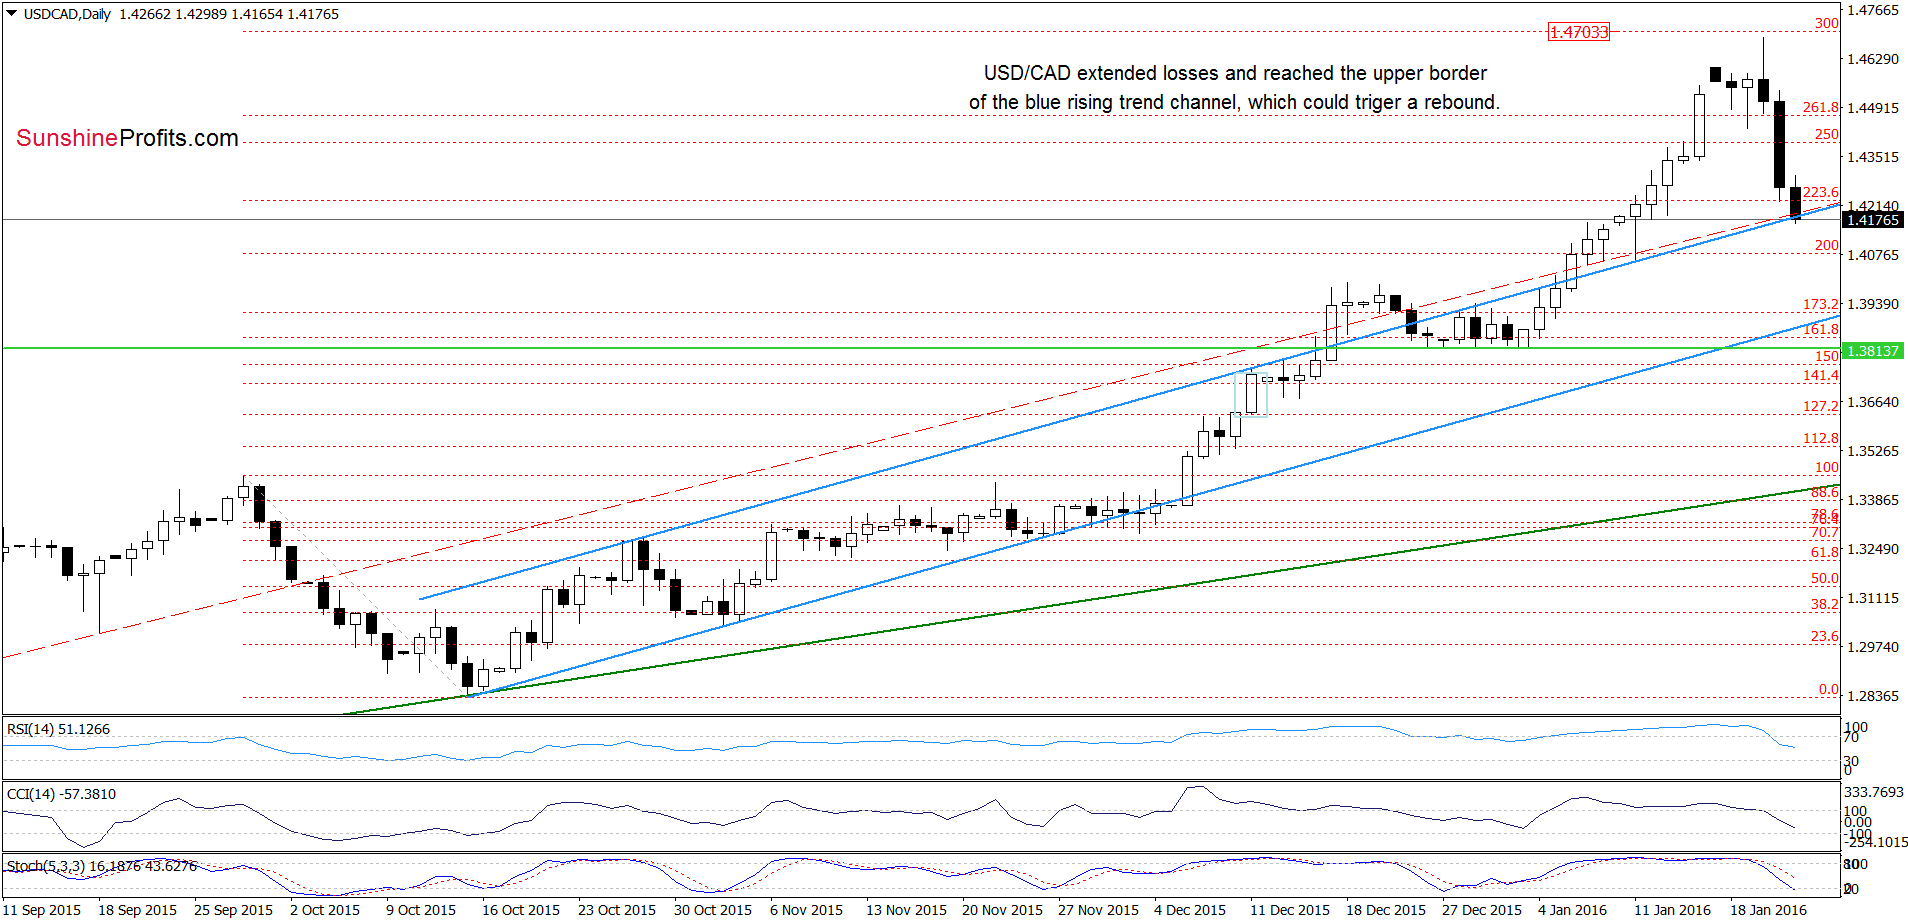
From this perspective we see that the above-mentioned orange resistance zone in combination with the 300% Fibonacci retracement triggered a correction of the recent upward move. As a result, the pair declined to the previously-broken upper border of the blue rising trend channel, which could trigger a rebound in the coming day(s).
Very short-term outlook: mixed
Short-term outlook: mixed
MT outlook: mixed
LT outlook: mixed
Trading position (short-term; our opinion): No positions are justified from the risk/reward perspective at the moment. We will keep you informed should anything change, or should we see a confirmation/invalidation of the above.
USD/CHF
Yesterday, we wrote:
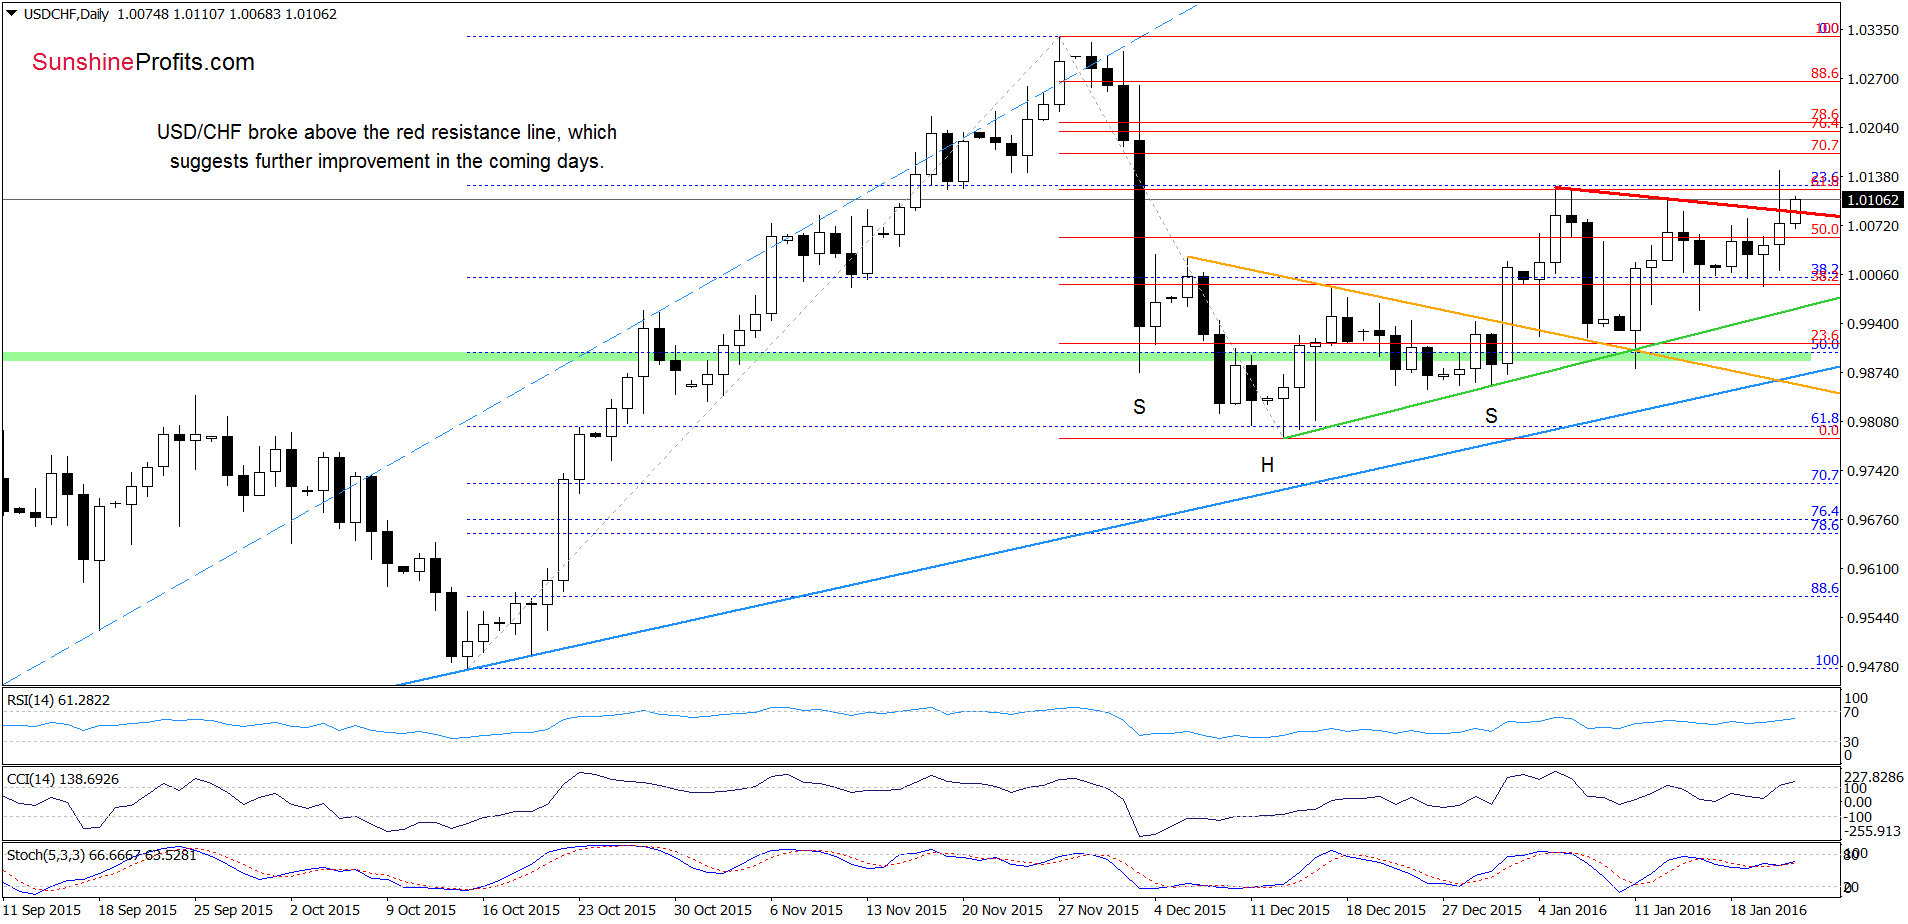
(…) USD/CHF is consolidating between the 38.2% and 50% Fibonacci retracement levels, which suggests that as long as there is no breakout above the red declining resistance line (based on the previous highs) further improvement is not likely to be seen. Nevertheless, the current position of the indictors (buy signals remain in place) suggests that currency bulls will try to push the pair higher once again.
From today’s point of view, we see that USD/CHF broke above the red declining trend channel, which suggests further improvement. How high could the pair go in the coming days? Let’s examine the weekly chart and find out.
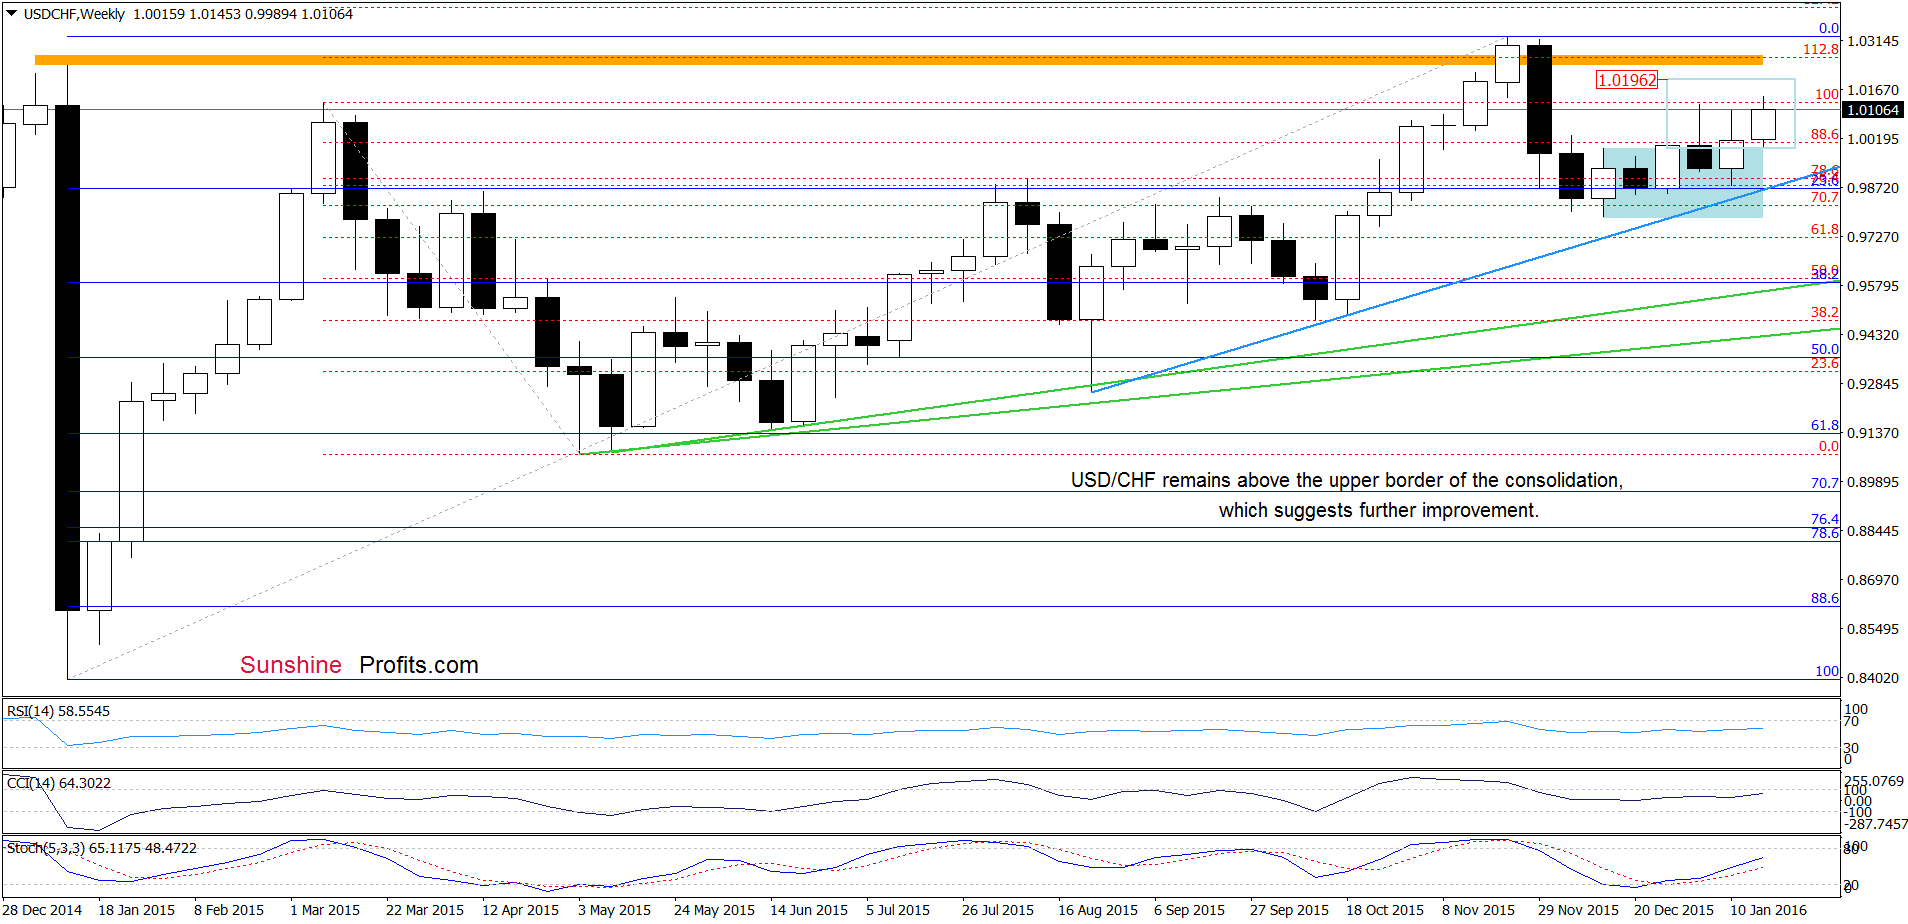
On the above chart, we see that USD/CHF climbed above the upper border of the blue consolidation once again, which in combination with buy signal generated by the Stochastic Oscillator suggests further improvement and an increase to around 1.0196, where the size of the upward move will correspond to the height of the formation.
Very short-term outlook: mixed with bullish bias
Short-term outlook: mixed with bullish bias
MT outlook: mixed
LT outlook: mixed
Trading position (short-term; our opinion): No positions are justified from the risk/reward perspective at the moment. We will keep you informed should anything change, or should we see a confirmation/invalidation of the above.
AUD/USD
Quoting our last commentary on this currency pair:
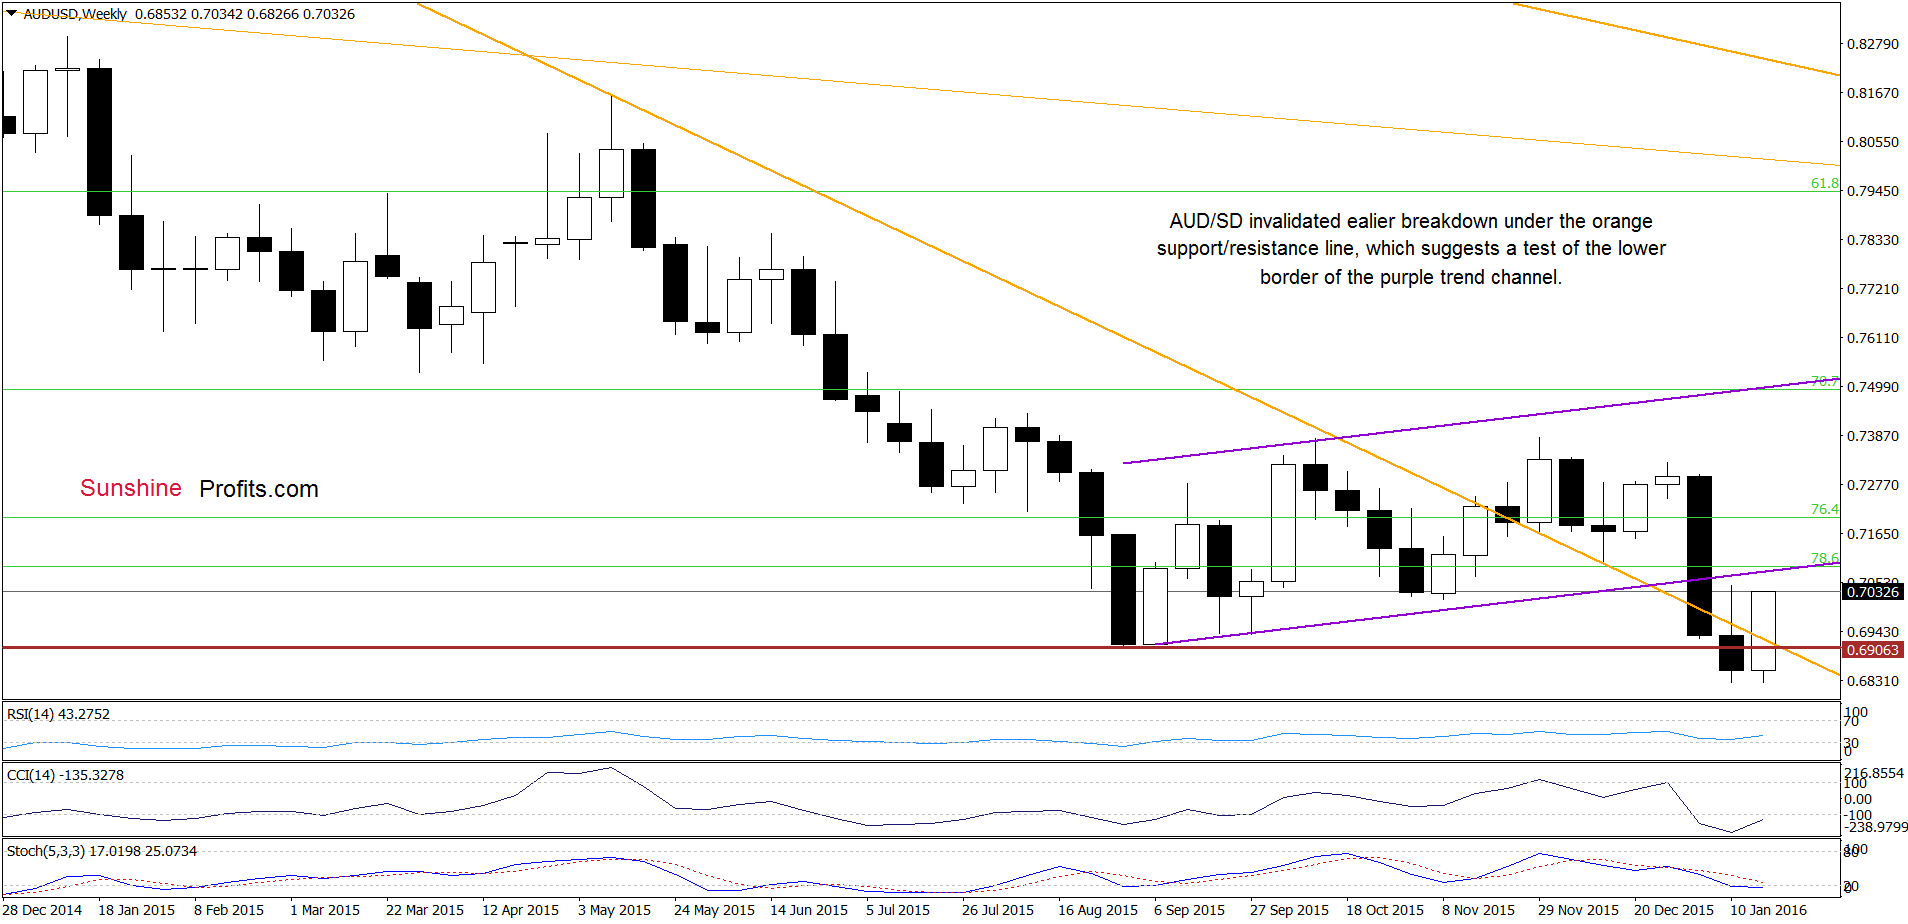
(…) The current position of the indicators, in combination with the blue support line and a potential double bottom formation suggests another rebound from here in the coming days.
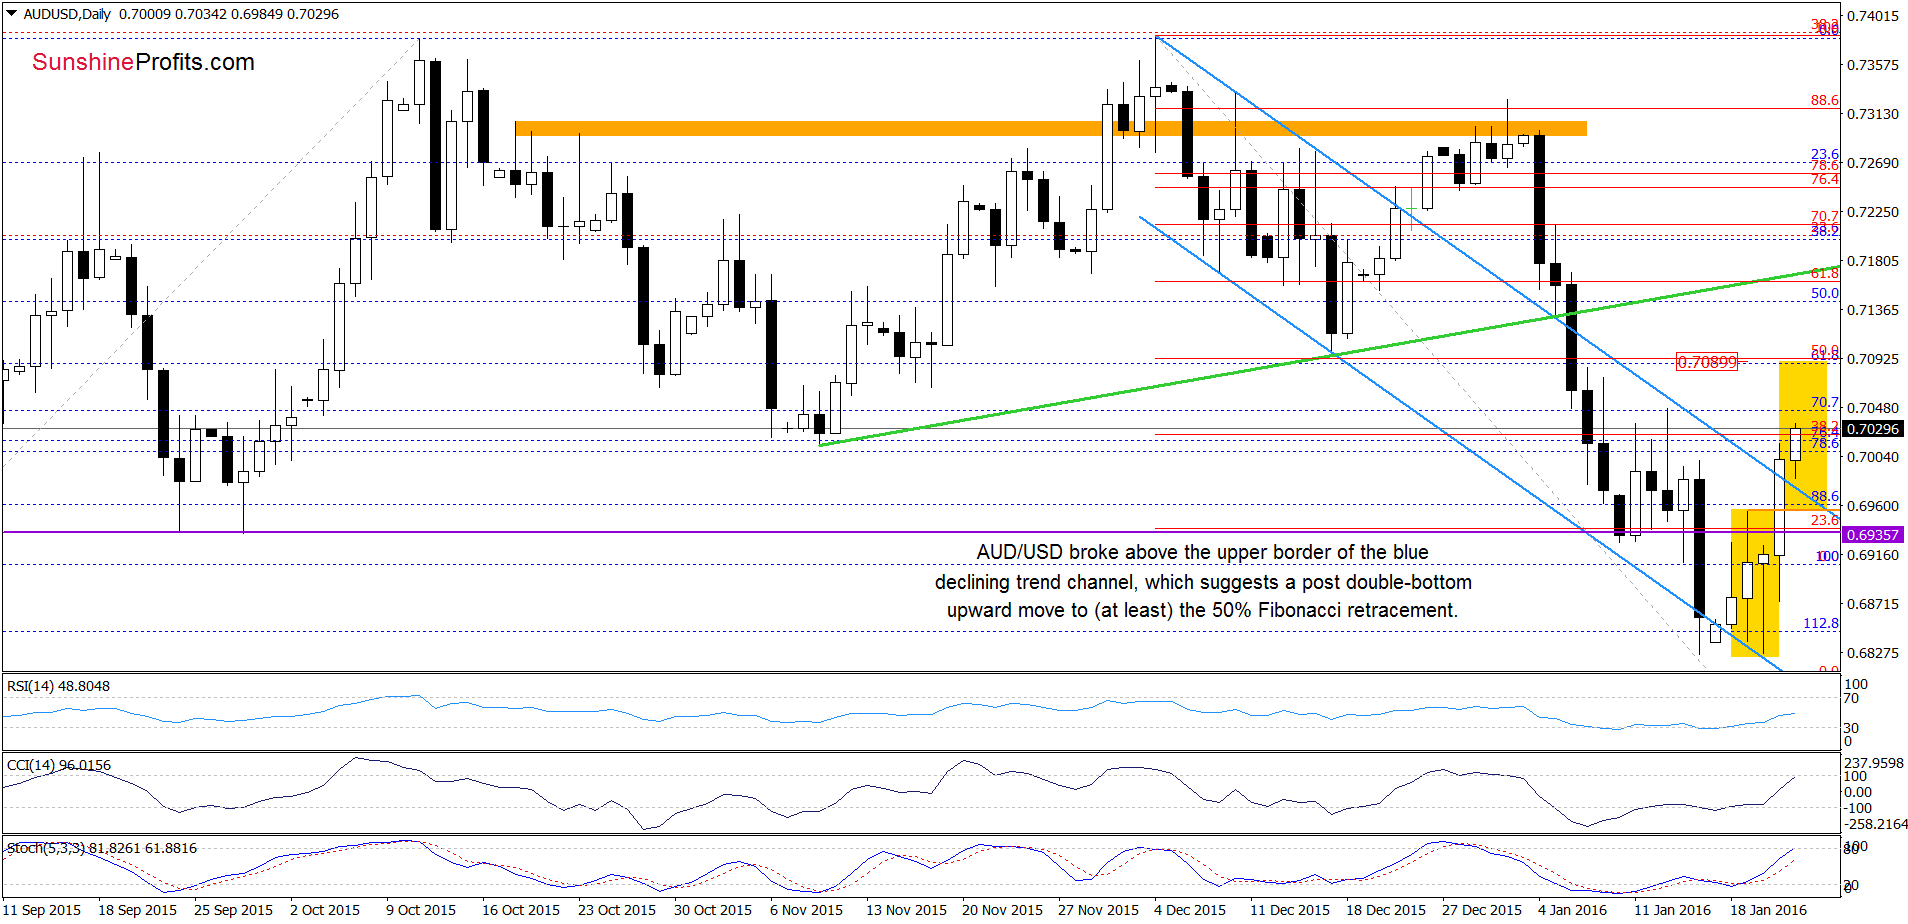
As you see on the daily chart, currency bulls pushed the pair higher as we had expected. With the recent upward move, the pair not only climbed above the purple horizontal resistance line, but also the last week’s high. This suggests that the double bottom formation is in play and we may see an increase to (at least) around 0.7090, where the size of the upward move will correspond to the formation (marked with yellow) and where the 50% Fibonacci retracement (based on the Dec-Jan declines) are.
Very short-term outlook: mixed with bullish bias
Short-term outlook: mixed
MT outlook: mixed
LT outlook: mixed
Trading position (short-term; our opinion): No positions are justified from the risk/reward perspective. We will keep you informed should anything change, or should we see a confirmation/invalidation of the above.
Thank you.
Nadia Simmons
Forex & Oil Trading Strategist
Przemyslaw Radomski, CFA
Founder, Editor-in-chief
Gold & Silver Trading Alerts
Forex Trading Alerts
Oil Investment Updates
Oil Trading Alerts

