

Earlier today, the USD Index extended gains and almost touched the March high as the last week’s upbeat U.S. data added to expectations that the Federal Reserve will raise interest rates next month. Time for reversal or higher values of the U.S. currency?
In our opinion the following forex trading positions are justified - summary:
EUR/USD
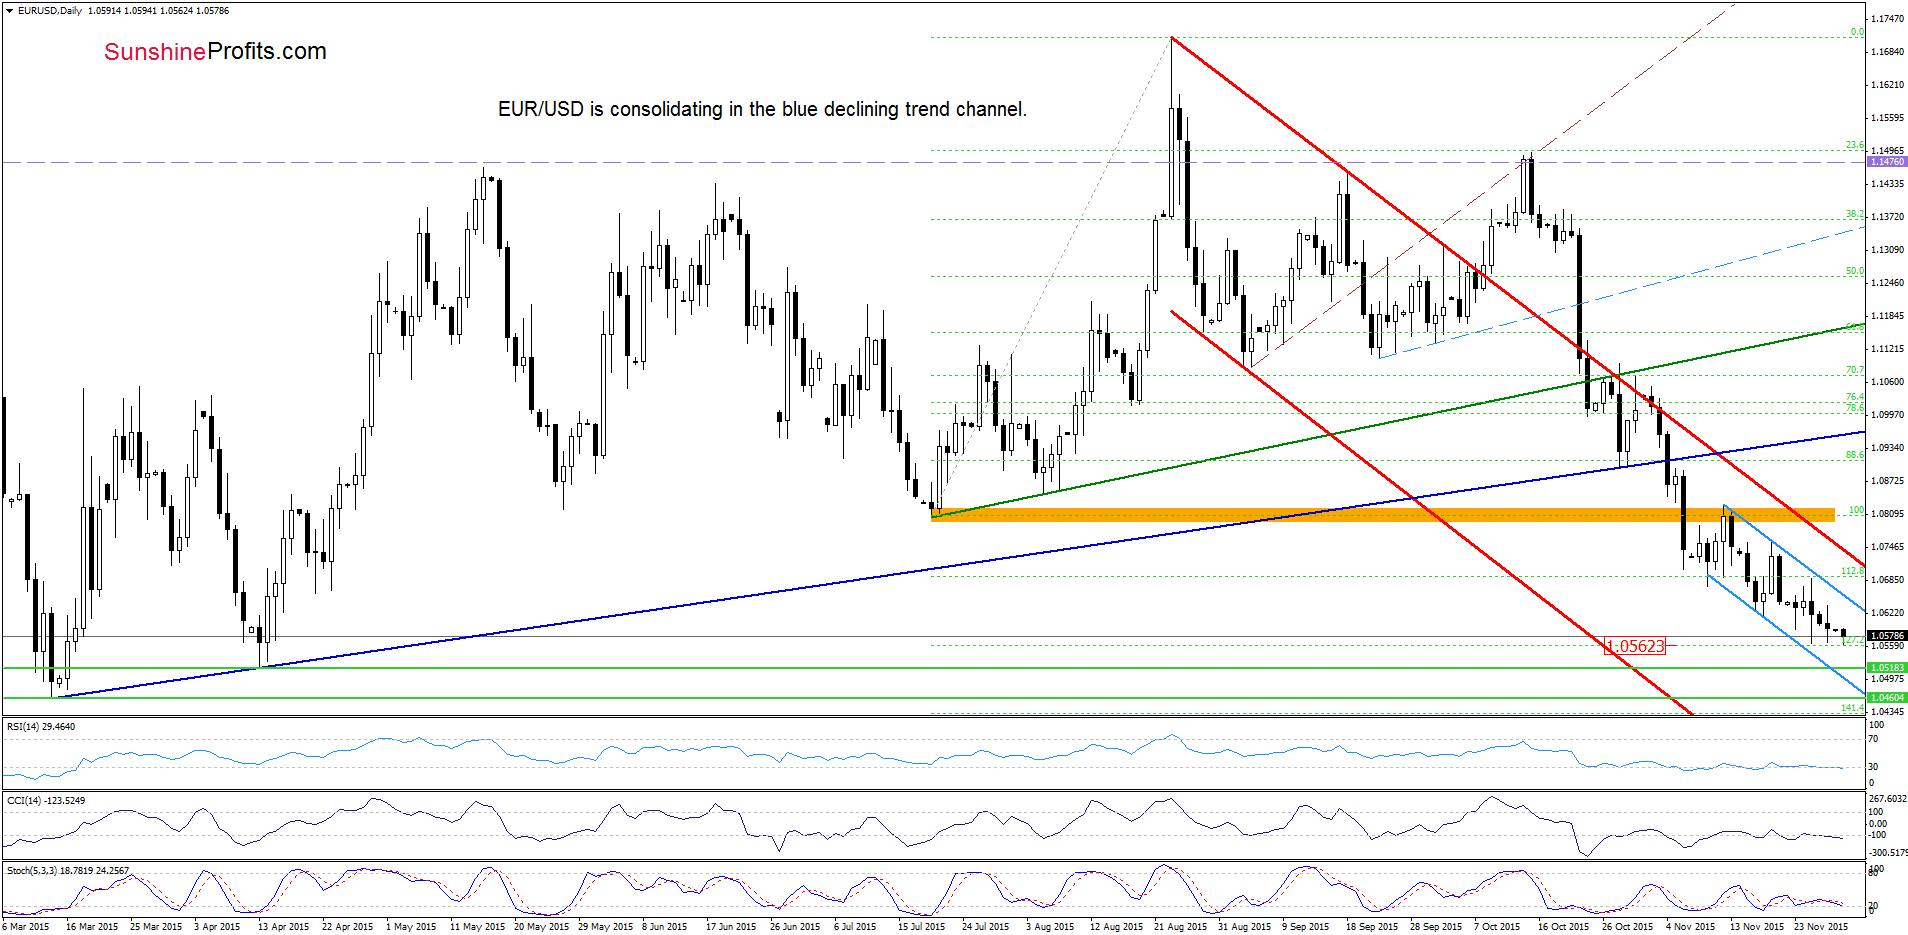
Quoting our Wednesday’s alert:
(…) EUR/USD extended losses and dropped under this week’s low, which suggests further deterioration and a drop to (…) the next downside target (…) around 1.0562, where the 127.2% Fibonacci extension (based on the Jul-Aug rally) is.
From today’s point of view, we see that the situation developed in line with the above scenario and the exchange rate declined to our next downside target earlier today. With this downward move, EUR/USD also reached the long-term green support line marked on the below chart.
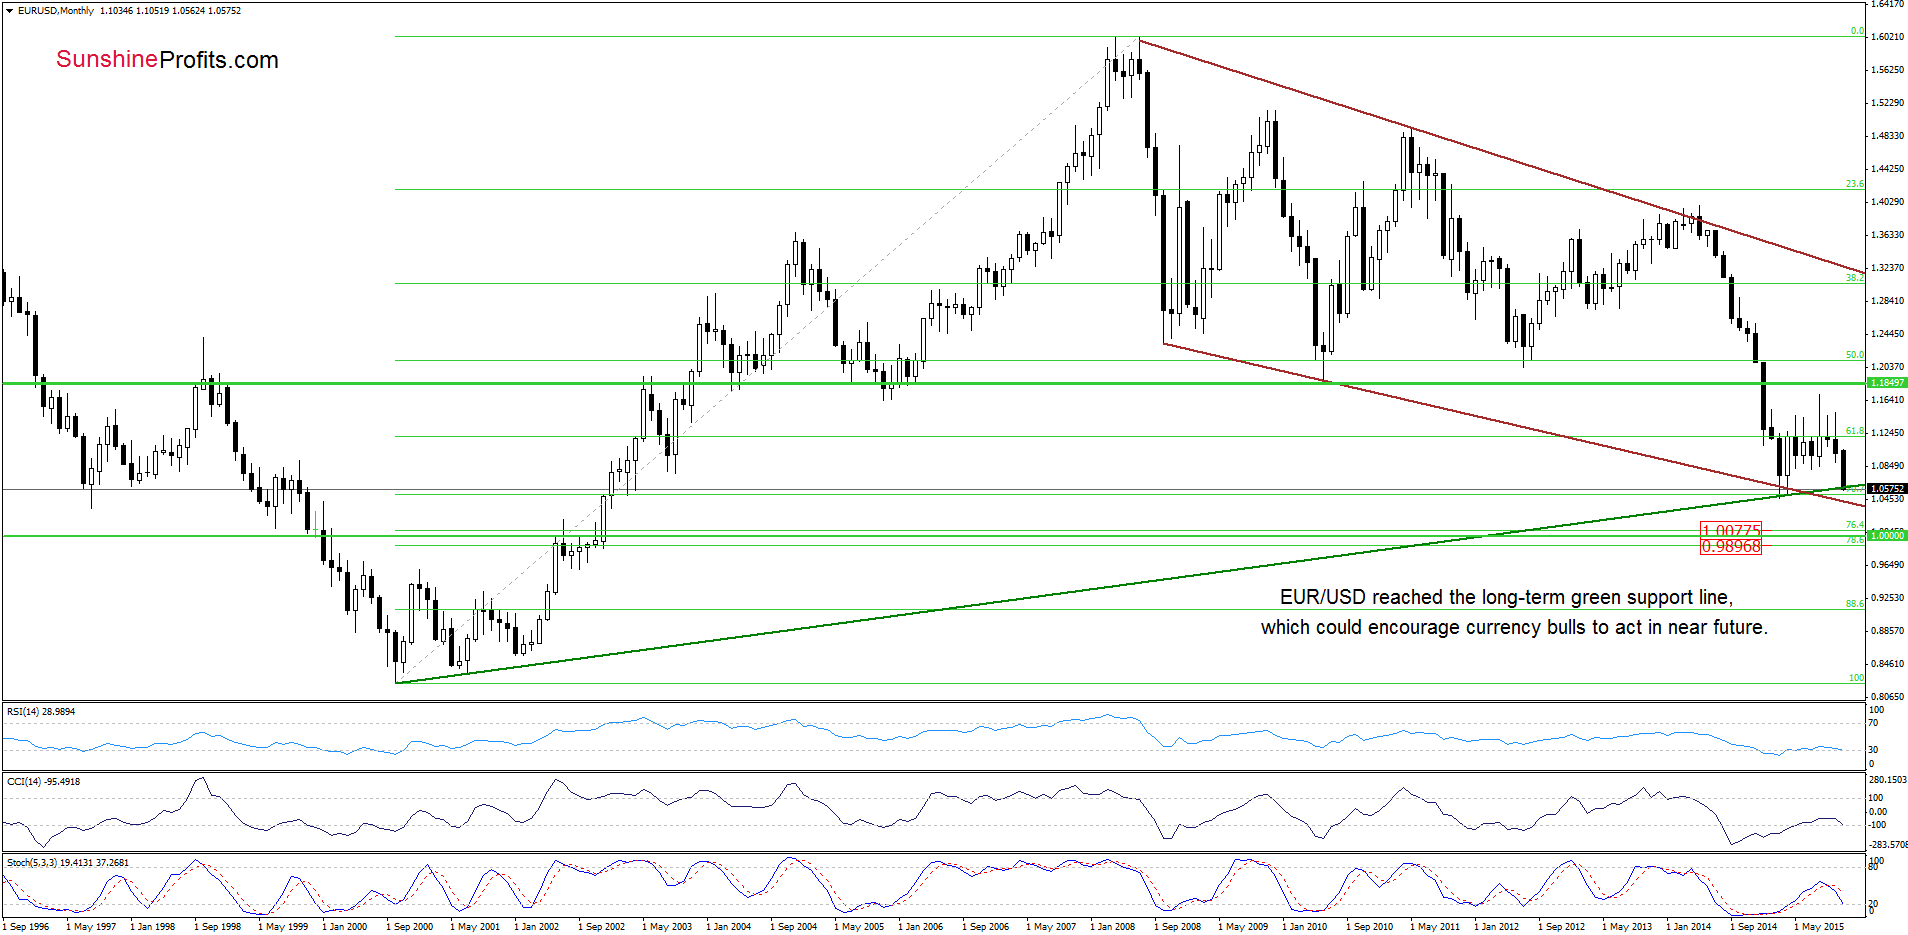
As you see on the monthly chart, this important support line was strong enough to stop further declines in March, which suggests that we may see a similar price action in the coming day(s).
On top of that, the current situation in USD Index increases the probability of a reversal.
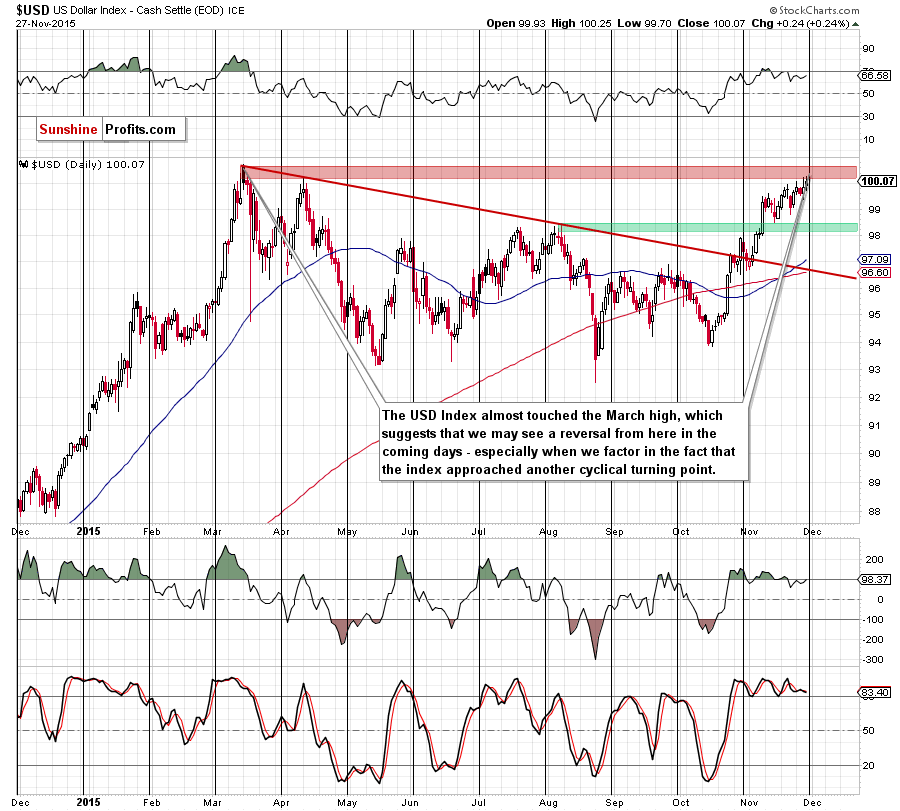
From this perspective, we see that the USD Index reached the red resistance zone on Friday (earlier today, the index almost touched the March high) and approached another cyclical turning point, which suggests that reversal is just around the corner. Additionally, the Stochastic Oscillator generated a sell signal and there are negative divergences between the RSI, CCI and the index, which could encourage currency bears to act in near future.
Taking all the above into account, we believe that closing short positions (we opened half of them when EUR/USD was around 1.1427 and half when the pair was trading around 1.1000) and taking profits off the table is the best investment decision at the moment.
Very short-term outlook: mixed
Short-term outlook: mixed
MT outlook: mixed
LT outlook: mixed
Trading position (short-term; our opinion): No positions are justified from the risk/reward perspective at the moment. We will keep you informed should anything change, or should we see a confirmation/invalidation of the above.
GBP/USD
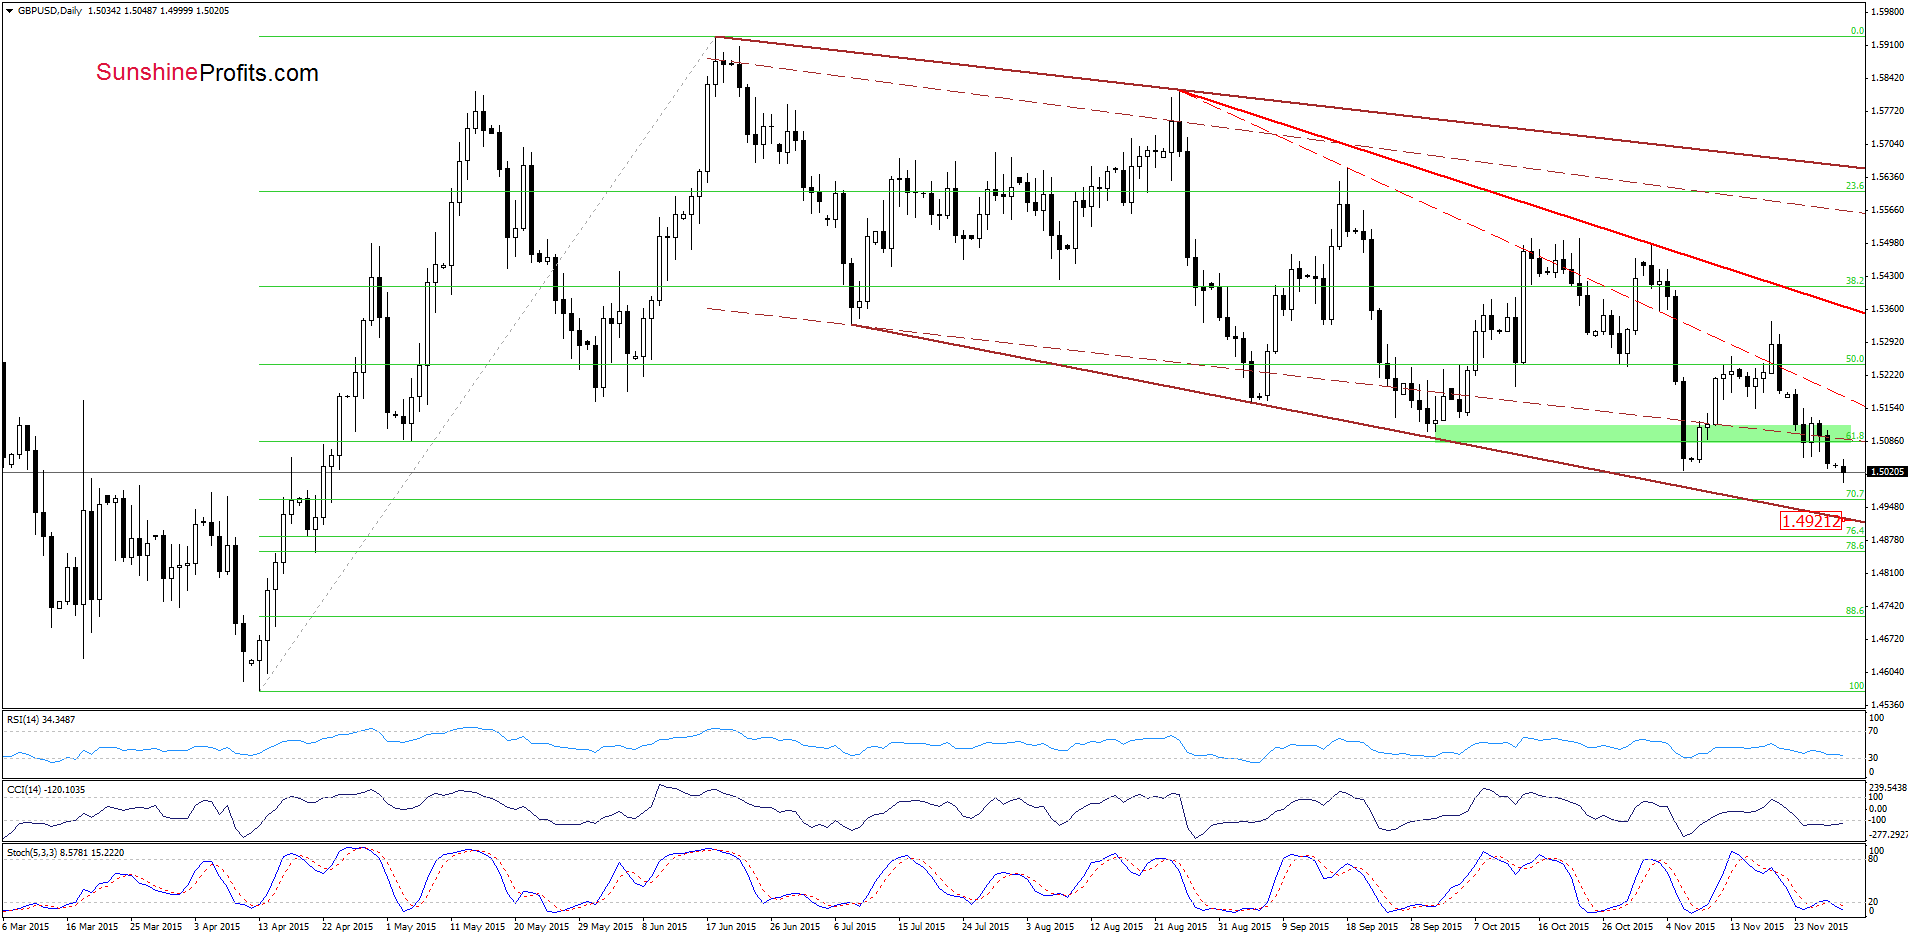
A week ago, we wrote the following:
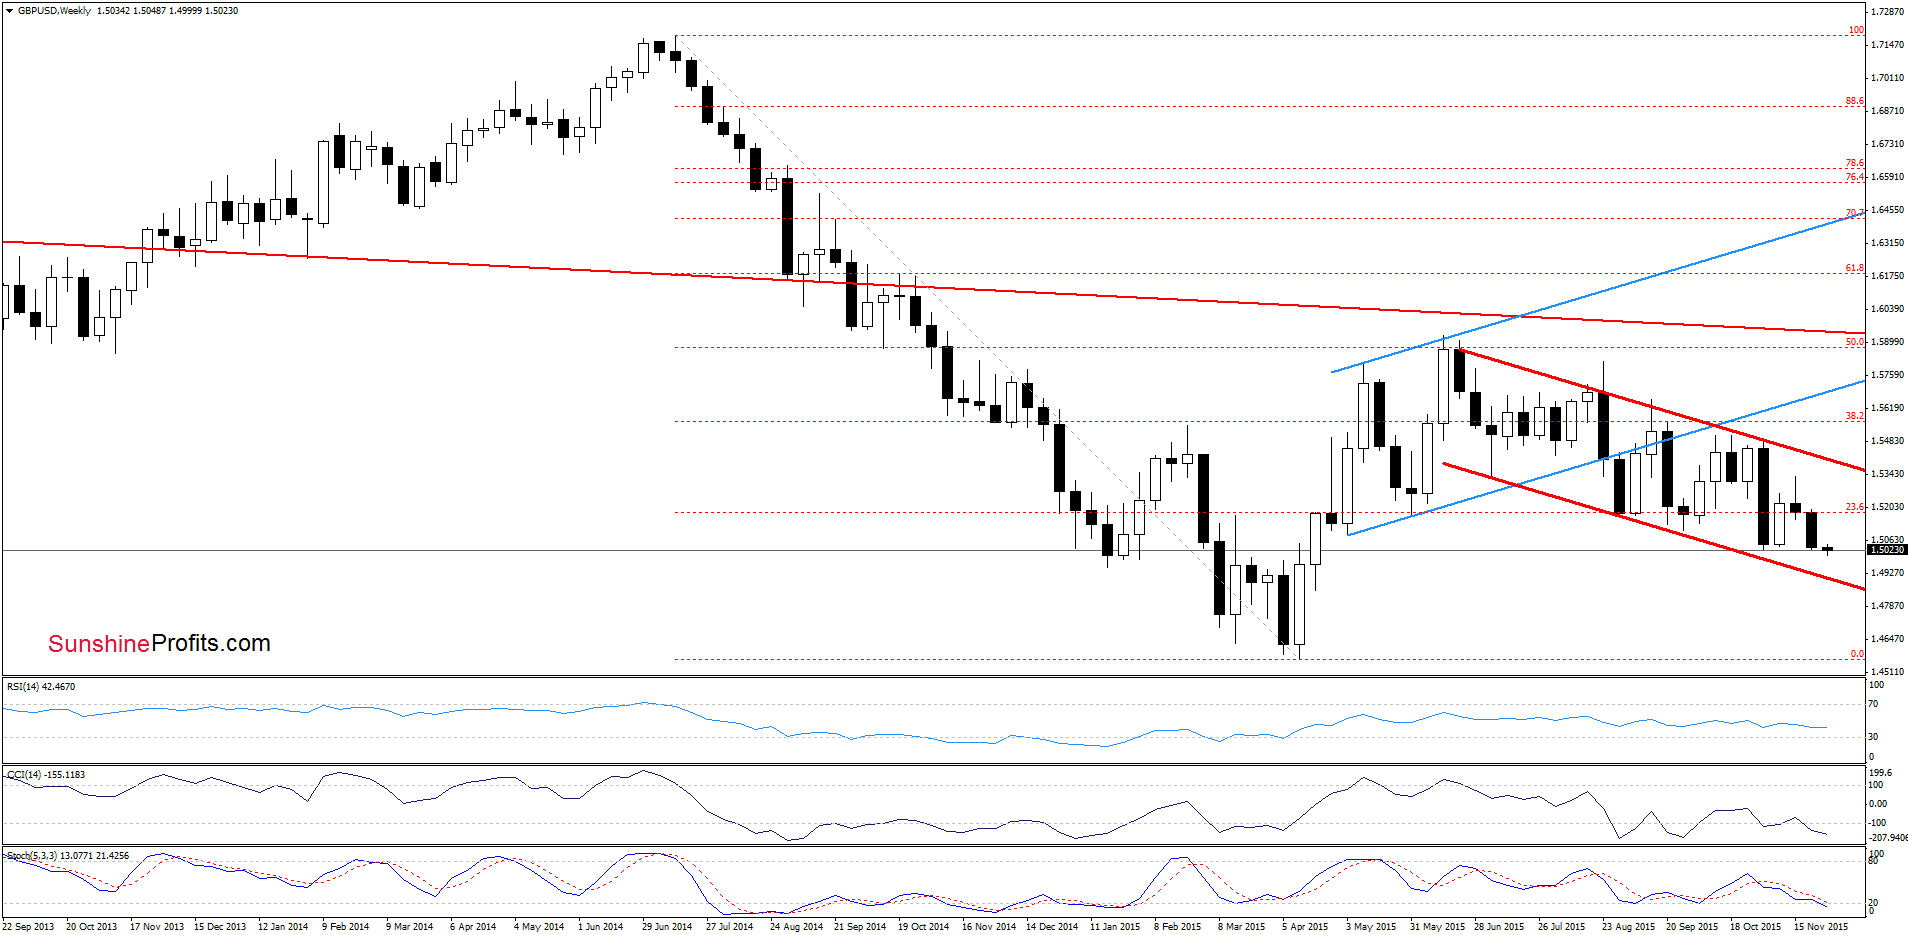
(…) GBP/USD broke below the last week’s low and approached the green support zone. Although the pair could rebound from here, the current position of the indicators (sell signals remain in place, supporting currency bears) suggests further deterioration and a test of the Nov lows in the coming week.
Looking at the daily chart, we see that the situation developed in line with the above scenario and the exchange rate broke not only below the green zone, but also under the Nov lows. Taking this negative signal into account, we think that the pair will test the 70.7% Fibonacci retracement in the coming days. However, at this point, it s worth noting that even if the exchange rate moves lower, the space for further declines seems limited as the lower border of the red declining trend channel (marked on the weekly chart) and the brown support line based on the previous lows (marked on the daily chart) are quite close the current levels.
Very short-term outlook: mixed with bearish bias
Short-term outlook: mixed
MT outlook: mixed
LT outlook: mixed
Trading position (short-term; our opinion): No positions are justified from the risk/reward perspective at the moment. We will keep you informed should anything change, or should we see a confirmation/invalidation of the above.
USD/CHF
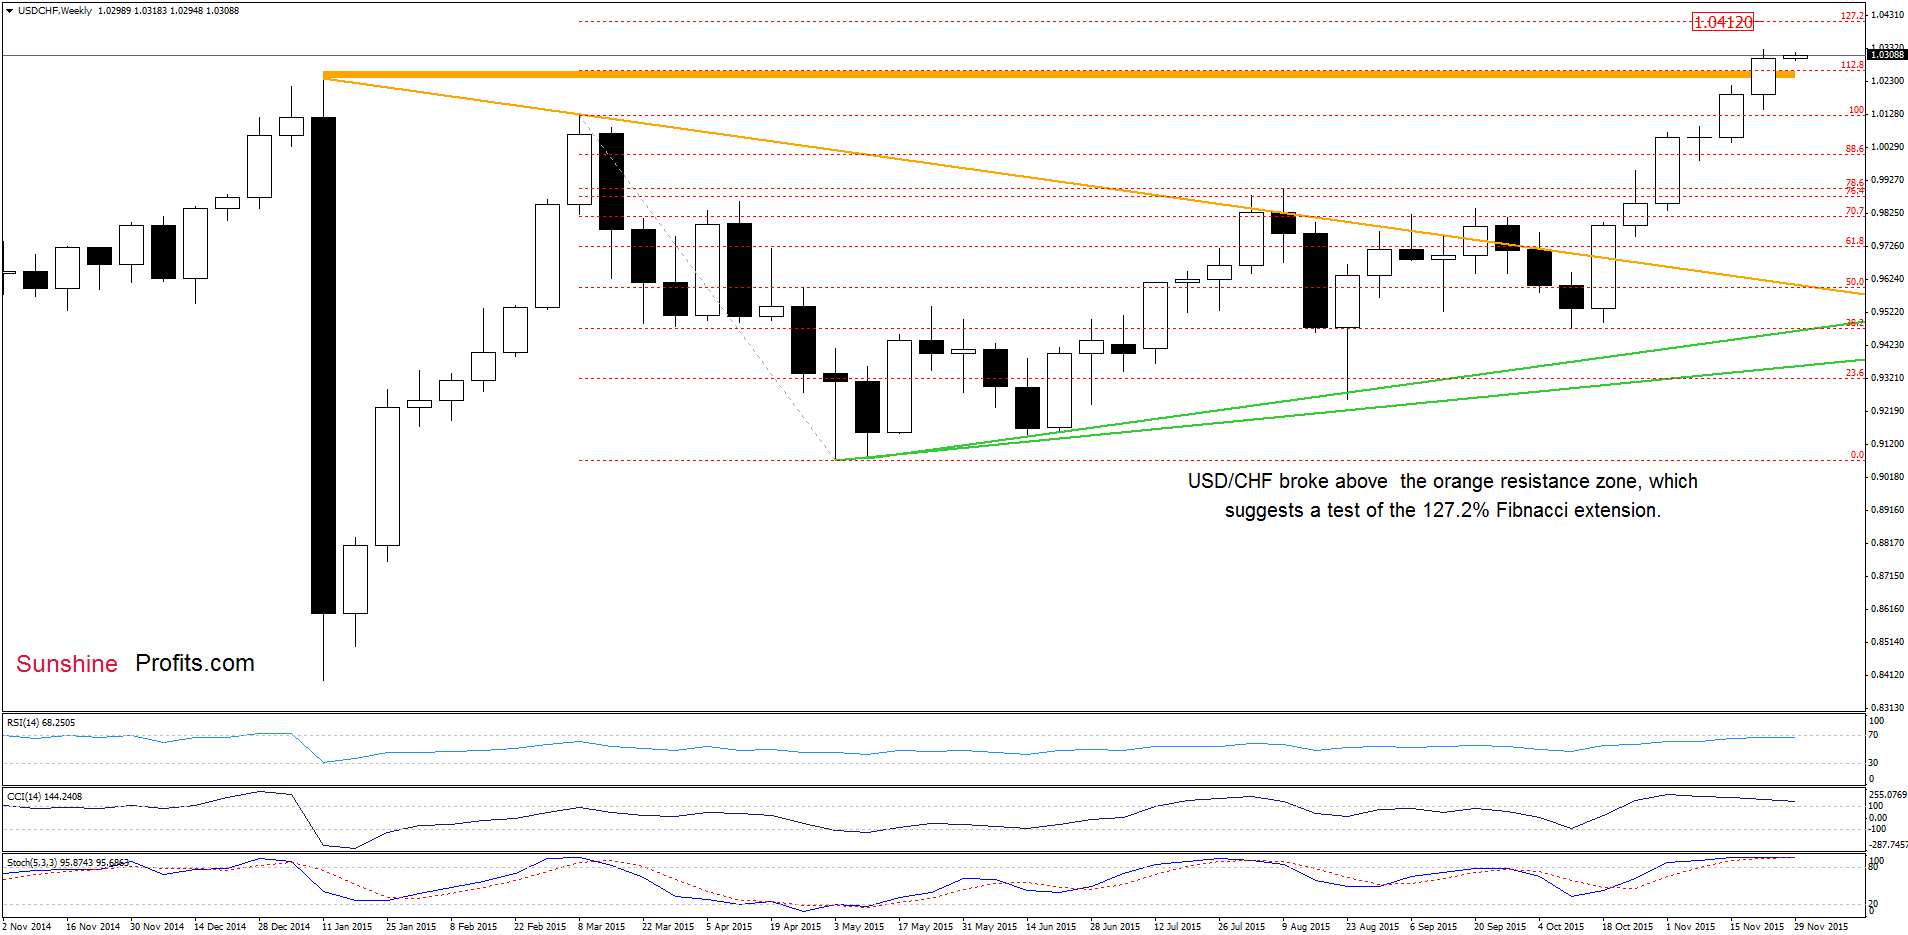
The first thing that catches the eye on the daily chart is a breakout above the orange resistance zone, which is a positive signal that suggest further improvement and an increase to around 1.0412, where the 127.2% Fibonacci extension is.
What impact did this move have on the very short-term picure? Let’s examine the daily chart and find out.
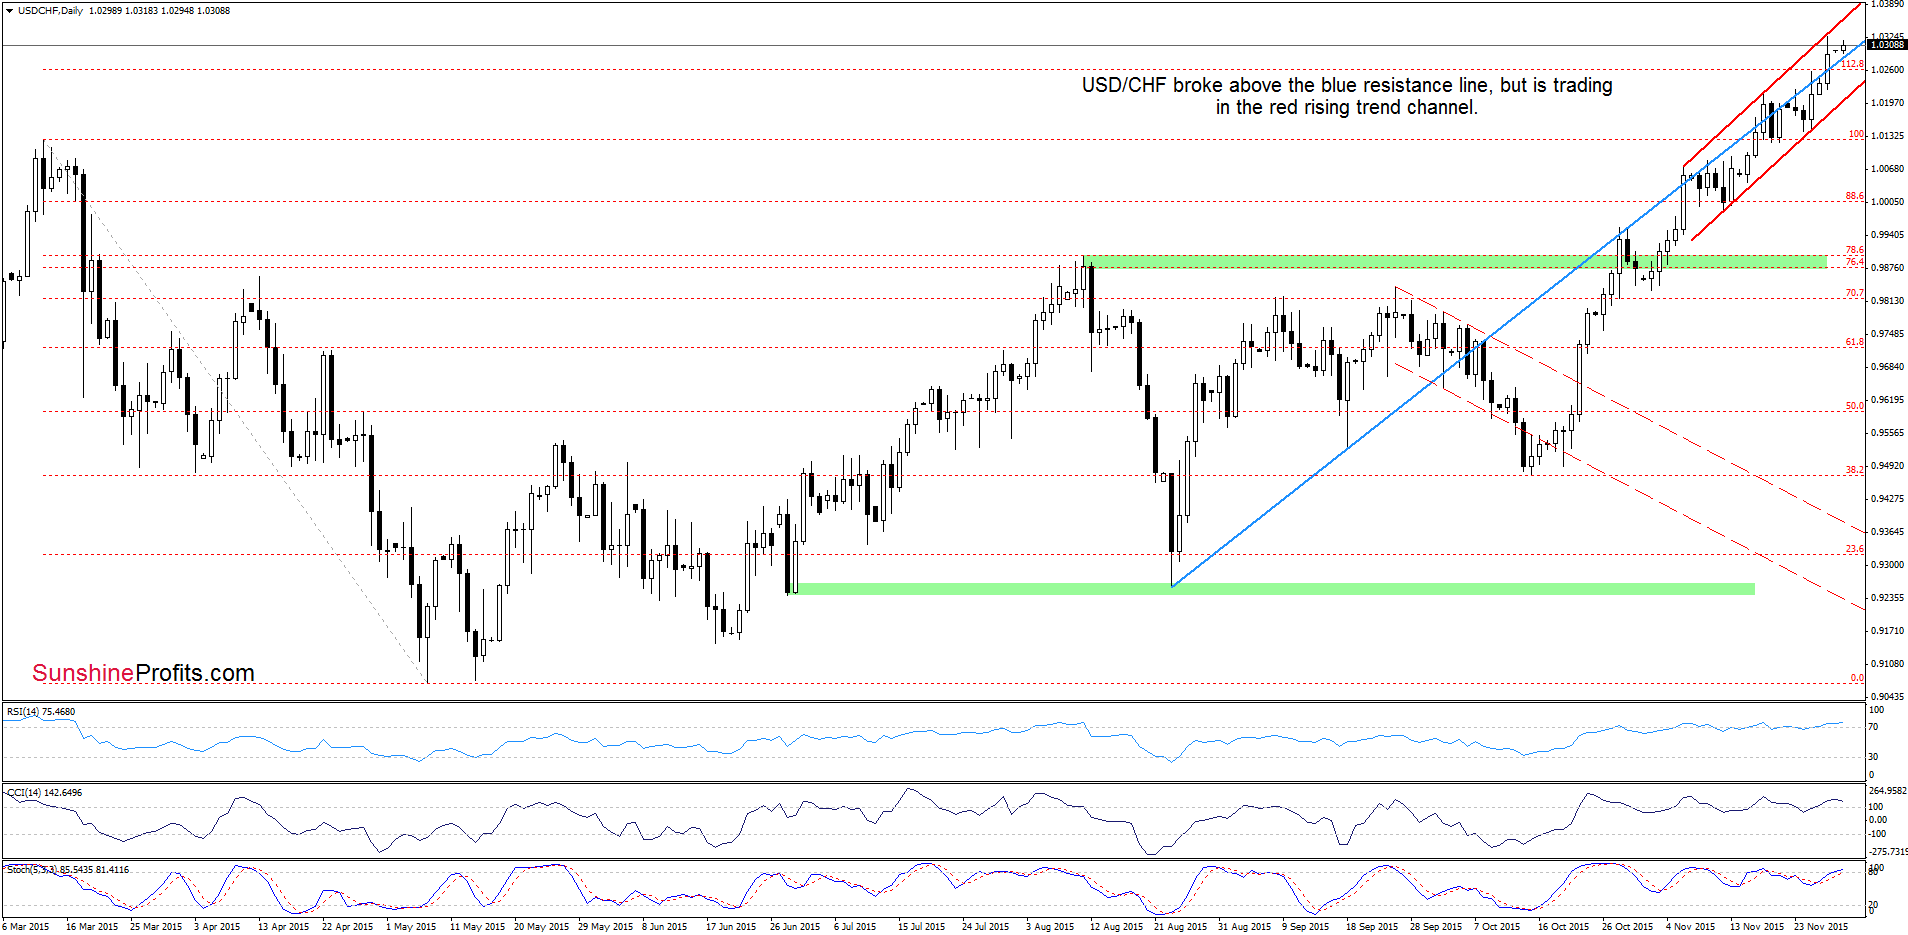
On the above chart, we see that although the pair closed the previous week above the blue resistance line, the exchange rate is trading in the red rising trend channel. This suggests that we’ll likely see a test of the upper border of the formation in the coming days (currently around 1.0357). Finishing today’s commentary on this currency pair, please note that the daily and weekly indicators are overbought, which suggests that the space for further improvement may be limited and reversal in the coming days should not surprise us. If this is the case, and the exchange rate declines, the initial downside target would be around 1.0127, where the previously-broken March high is. If tis support is broken, the next target for currency bears would be around 0.9988, where the bottom of the mid-Nov pullback is.
Very short-term outlook: mixed
Short-term outlook: mixed
MT outlook: mixed
LT outlook: mixed
Trading position (short-term; our opinion): No positions are justified from the risk/reward perspective at the moment. We will keep you informed should anything change, or should we see a confirmation/invalidation of the above.
Thank you.
Nadia Simmons
Forex & Oil Trading Strategist
Przemyslaw Radomski, CFA
Founder, Editor-in-chief
Gold & Silver Trading Alerts
Forex Trading Alerts
Oil Investment Updates
Oil Trading Alerts

