

Although the USD Index gave up some gains yesterday, the U.S. currency remains quite close to the seven month high as hopes that the Federal Reserve will raise interest rates on its next meeting in Dec continue to support the greenback. Will the current picture of our six currency pairs give us more clues about future moves?
In our opinion the following forex trading positions are justified - summary:
- EUR/USD: short (stop-loss order at 1.1476; initial downside target around 1.0462)
- GBP/USD: none
- USD/JPY: none
- USD/CAD: none
- USD/CHF: none
- AUD/USD: none
EUR/USD
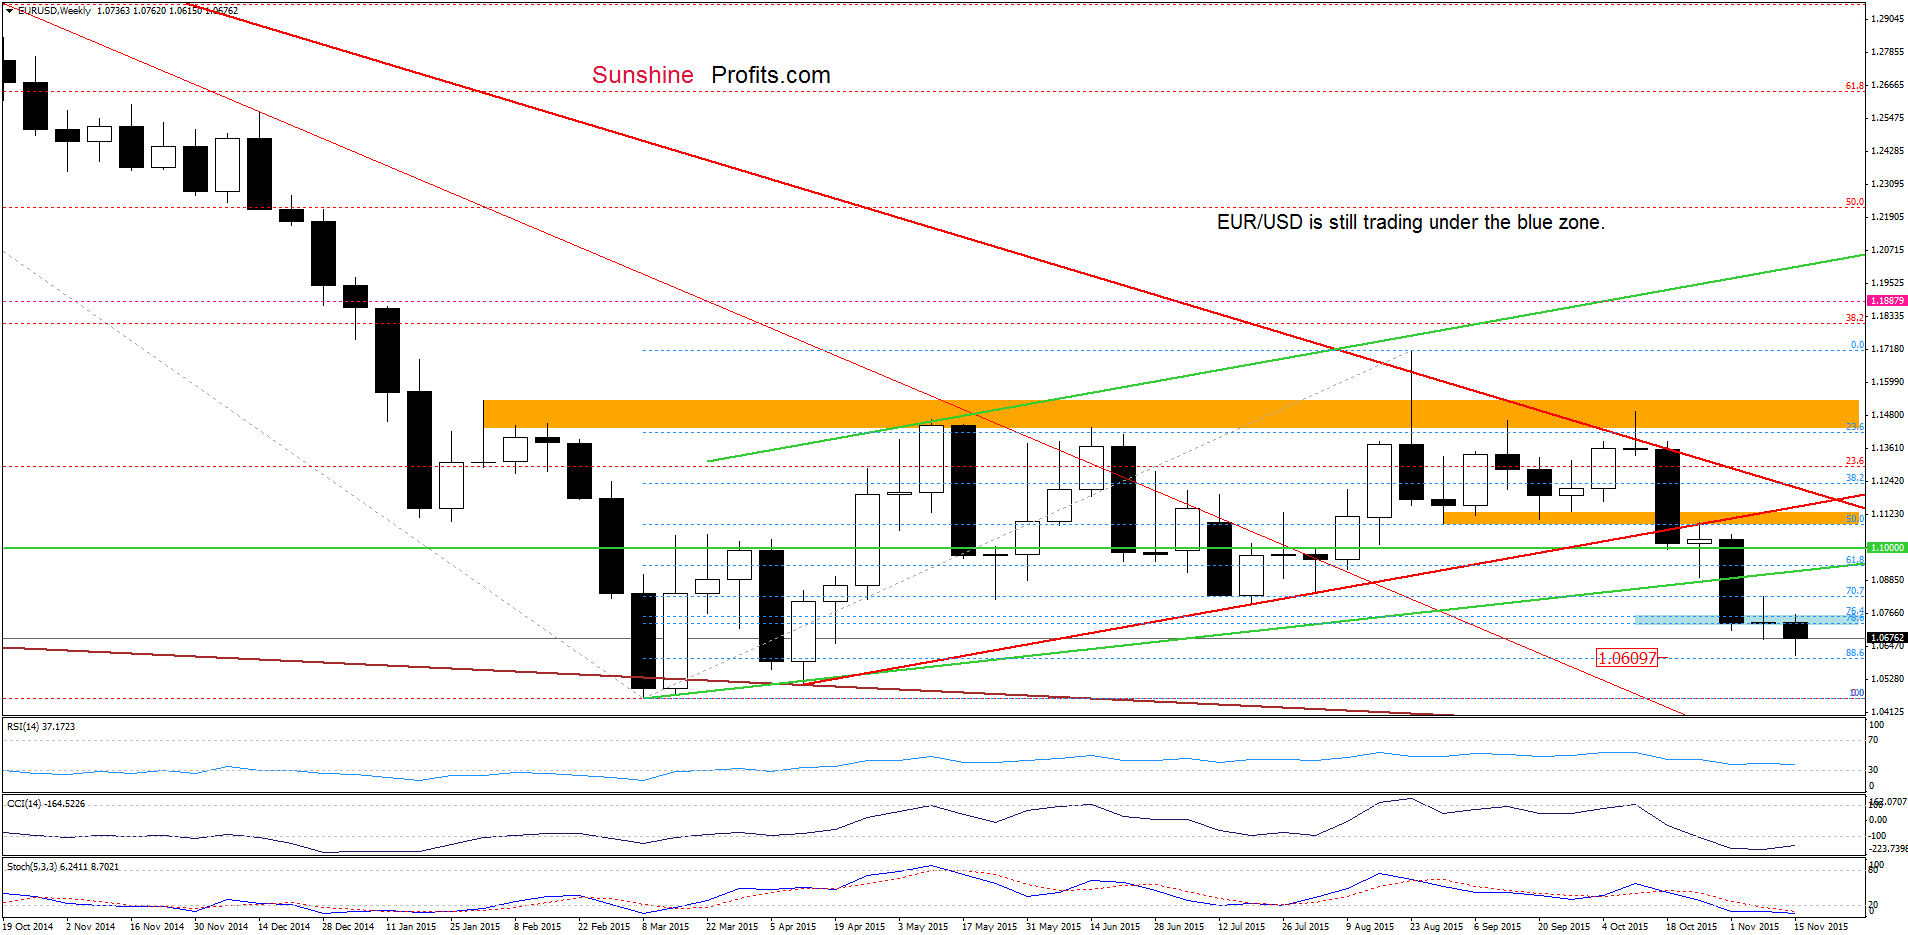
Although EUR/USD moved little higher earlier this week, the situation in the medium term hasn’t changed much as the exchange rate is still trading under the blue resistance zone (created by the 76.4% and 78.6% Fibonacci retracement levels) and last week’s low.
Today, we’ll focus on the very short-term changes.
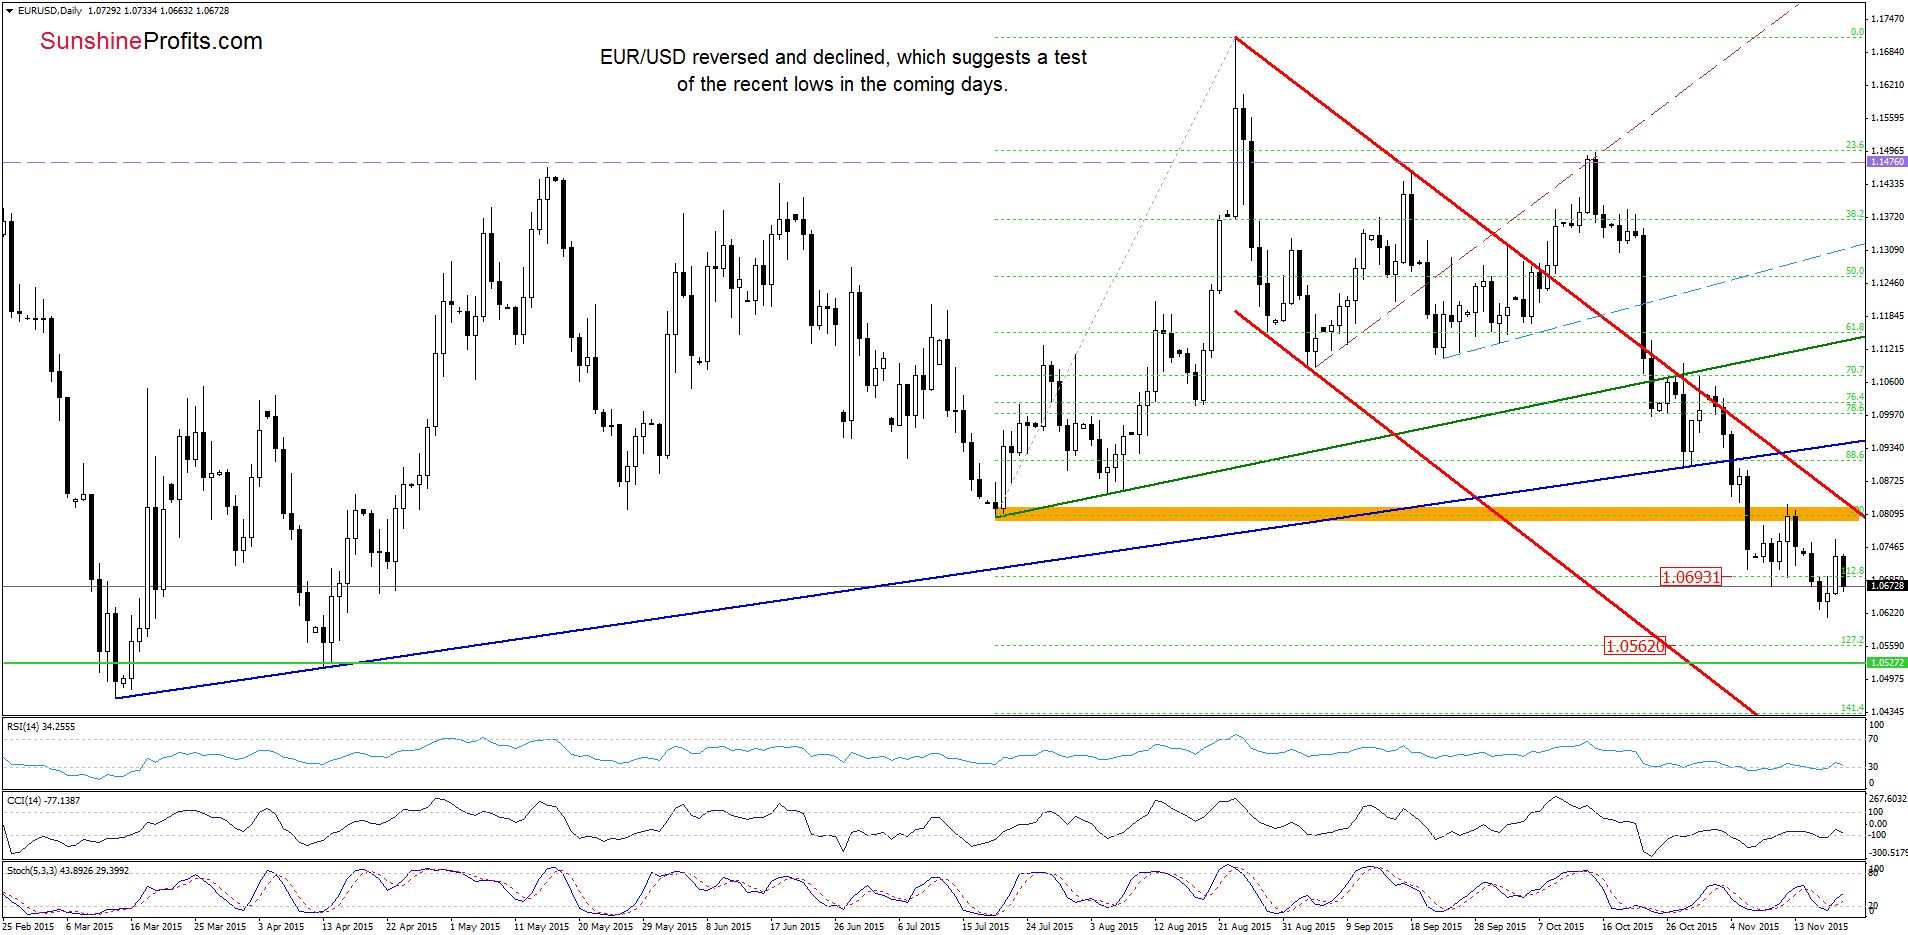
Looking at the daily chart, we see that EUR/USD reversed and gave up some of recent gains, which suggests that what we wrote yesterday is up-to-date also today:
(…) the pair remains under the orange resistance zone and the upper border of the red declining trend channel. This suggests that as long as there is no breakout above this area, another attempt to move lower is very likely. If this is the case and the exchange rate reverses, we’ll see a test of yesterday’s low of 1.0615. Please note that if this support is broken, the next downside target would be around 1.0562, where the 127.2% Fibonacci extension (based on the Jul-Aug rally) is.
Very short-term outlook: bearish
Short-term outlook: bearish
MT outlook: mixed with bearish bias
LT outlook: mixed
Trading position (short-term; our opinion): Short positions (which are profitable) with a stop-loss order at 1.1476 are justified from the risk/reward perspective. We will keep you informed should anything change, or should we see a confirmation/invalidation of the above.
GBP/USD
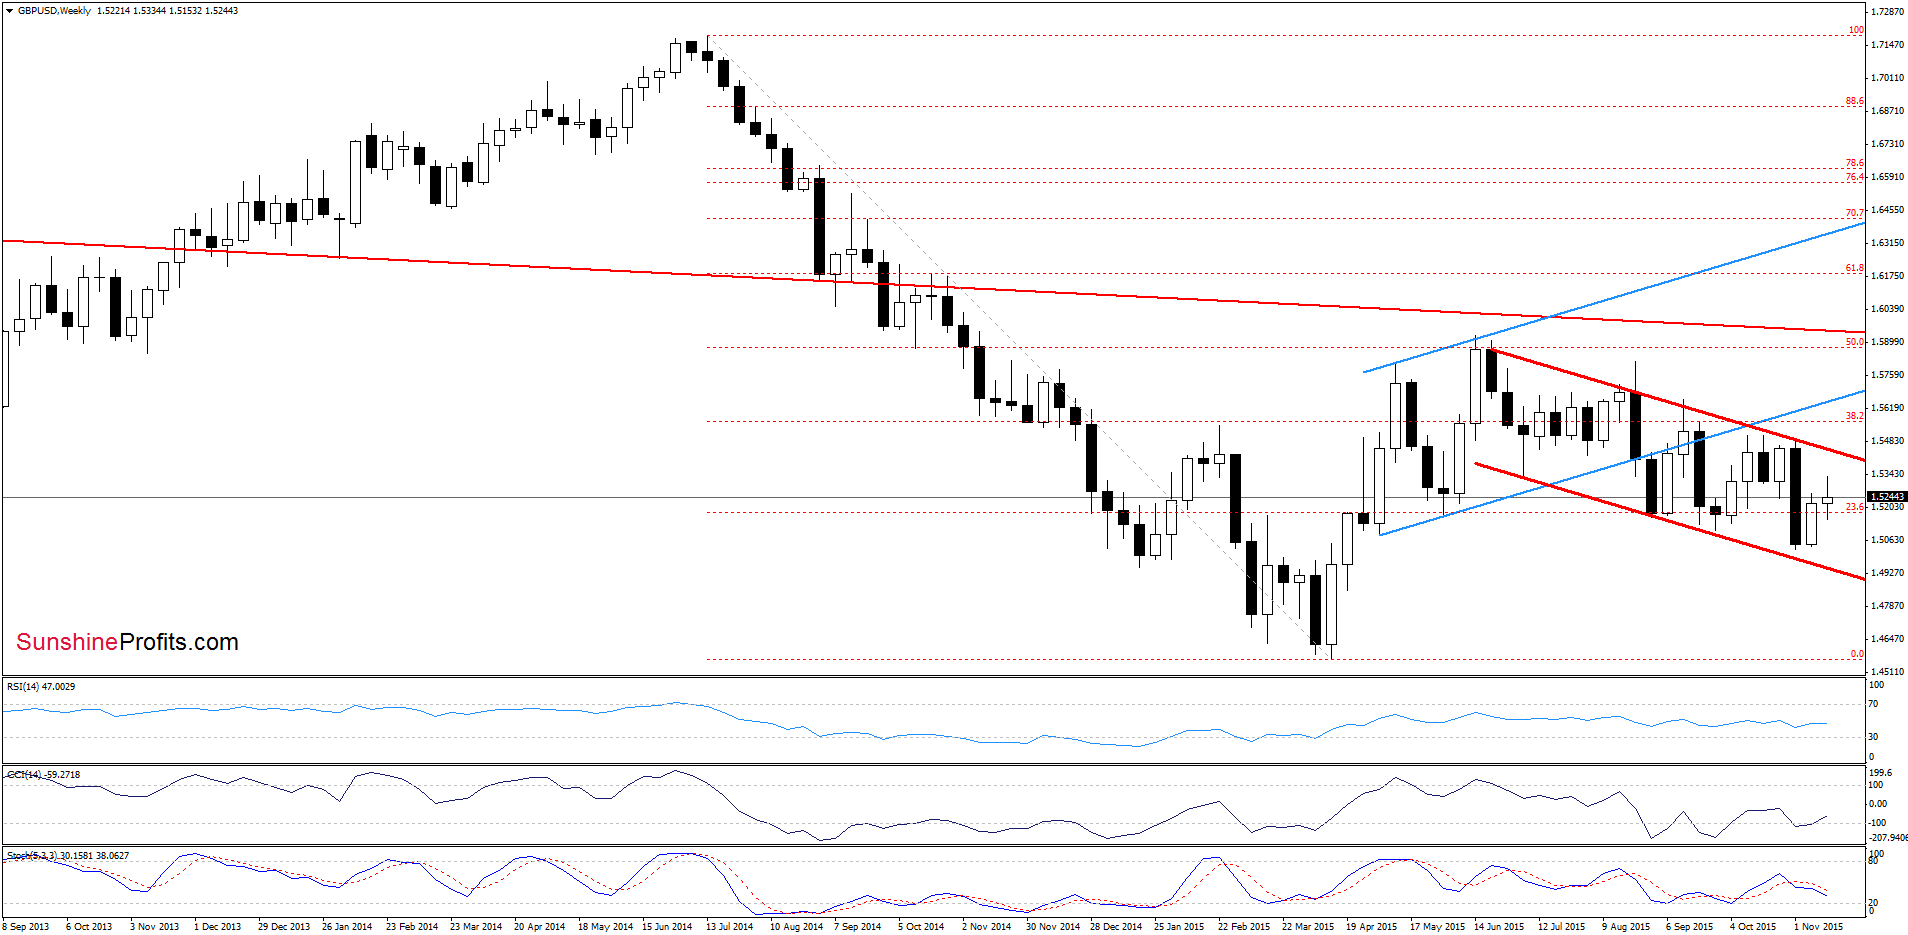
The medium-term picture remains almost unchanged as GBP/USD is trading in the red declining trend channel.
Will the daily chart give us more clues about future moves? Let’s check.
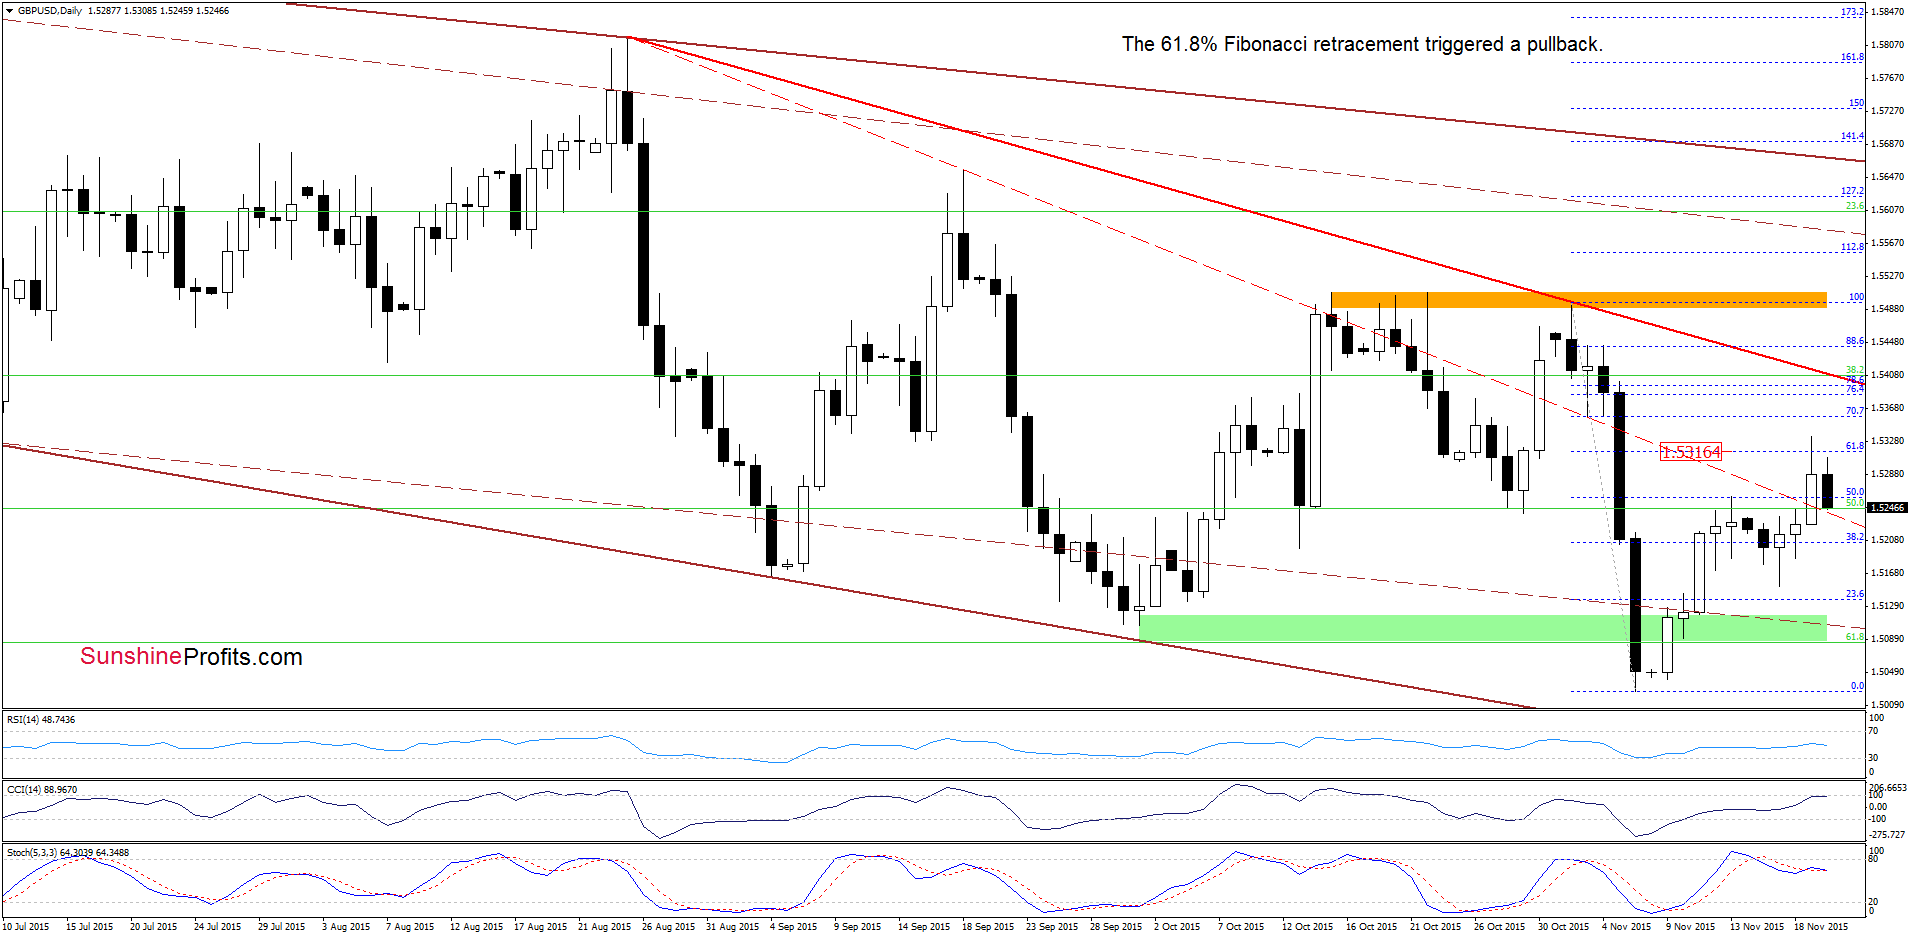
From this perspective we see that although GBP/USD broke above red dashed resistance line yesterday, the 61.8% Fibonacci retracement triggered a pullback. With this downswing the exchange rate lipped to the previously-broken red line, which may be a verification of earlier breakout. However, the current position of the indicators suggests that further deterioration is just around the corner. Nevertheless, in our opinion, such price action will be more likely if we see a daily closure under the above-mentioned line. Please note that if GBP/USD extends losses, currency bears will likely push the pair to around 1.5153, where this week’s low is.
Very short-term outlook: mixed with bearish bias
Short-term outlook: mixed
MT outlook: mixed
LT outlook: mixed
Trading position (short-term; our opinion): No positions are justified from the risk/reward perspective at the moment. We will keep you informed should anything change, or should we see a confirmation/invalidation of the above.
USD/JPY
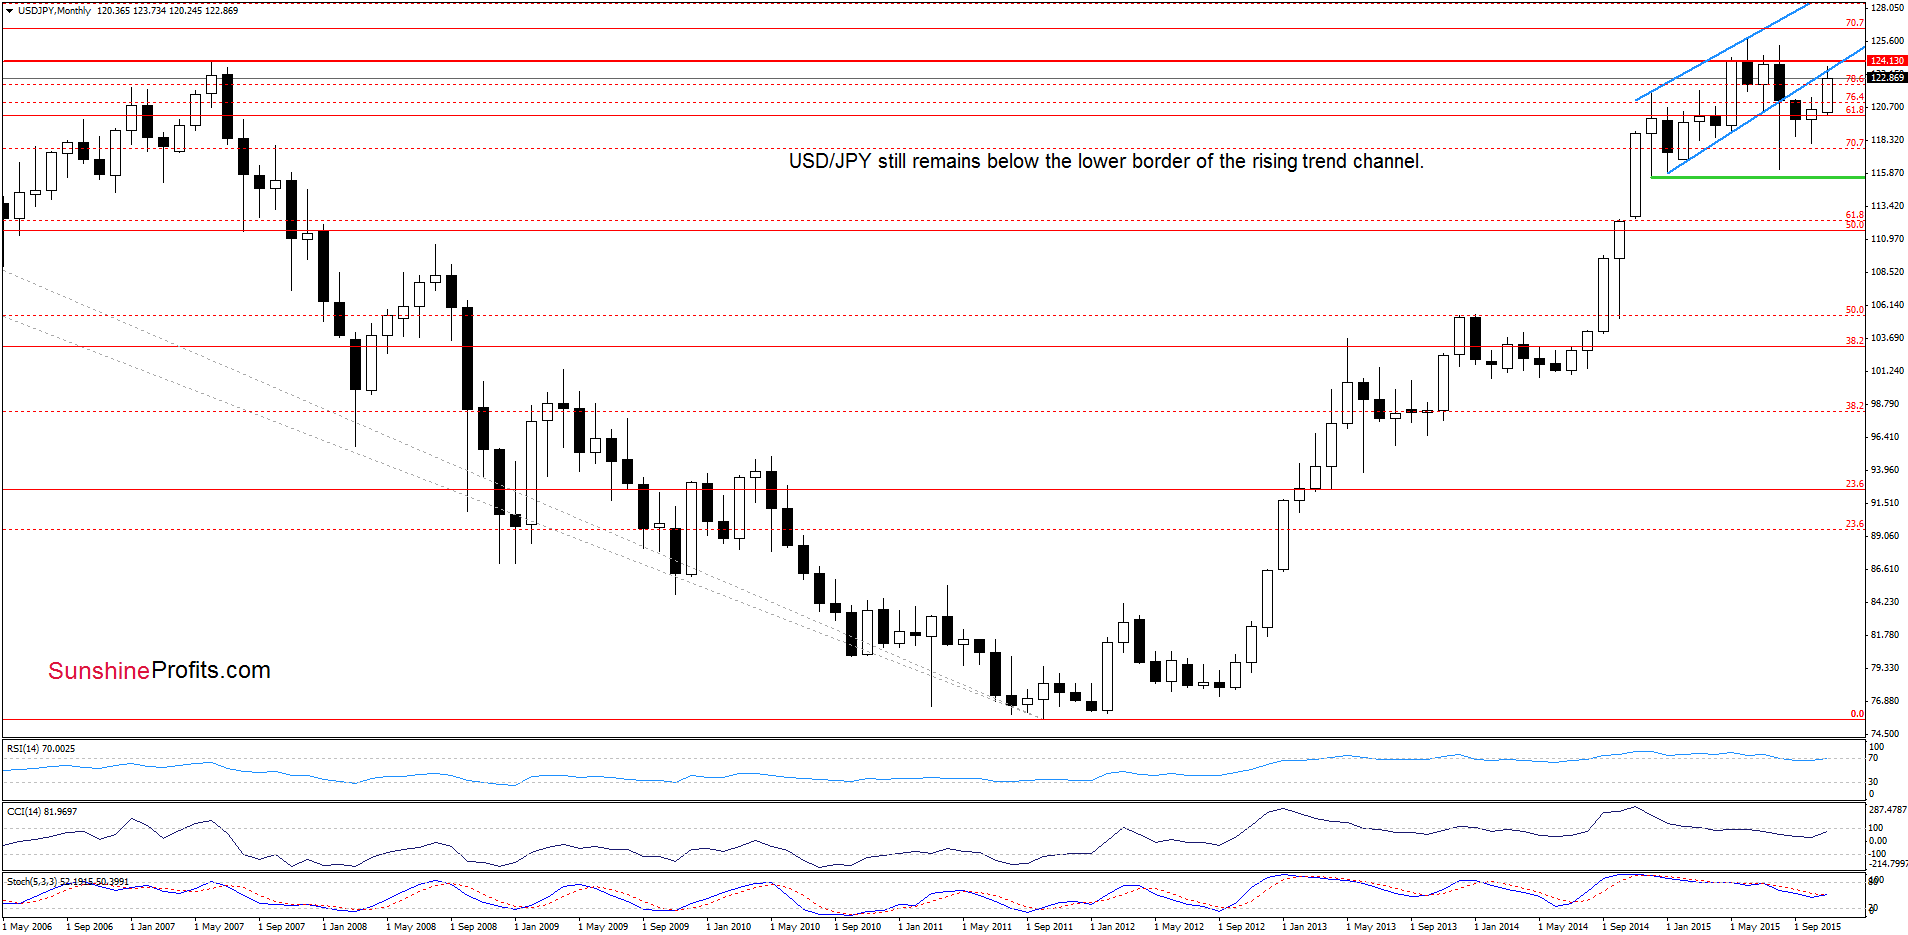
As you see on the above chart, USD/JPY invalidated earlier small breakout above the lower border of the blue rising trend channel, which triggered a pullback. What impact did this move have on the very short-term chart? Let’s check.
In our previous commentary on this currency pair we wrote the following:
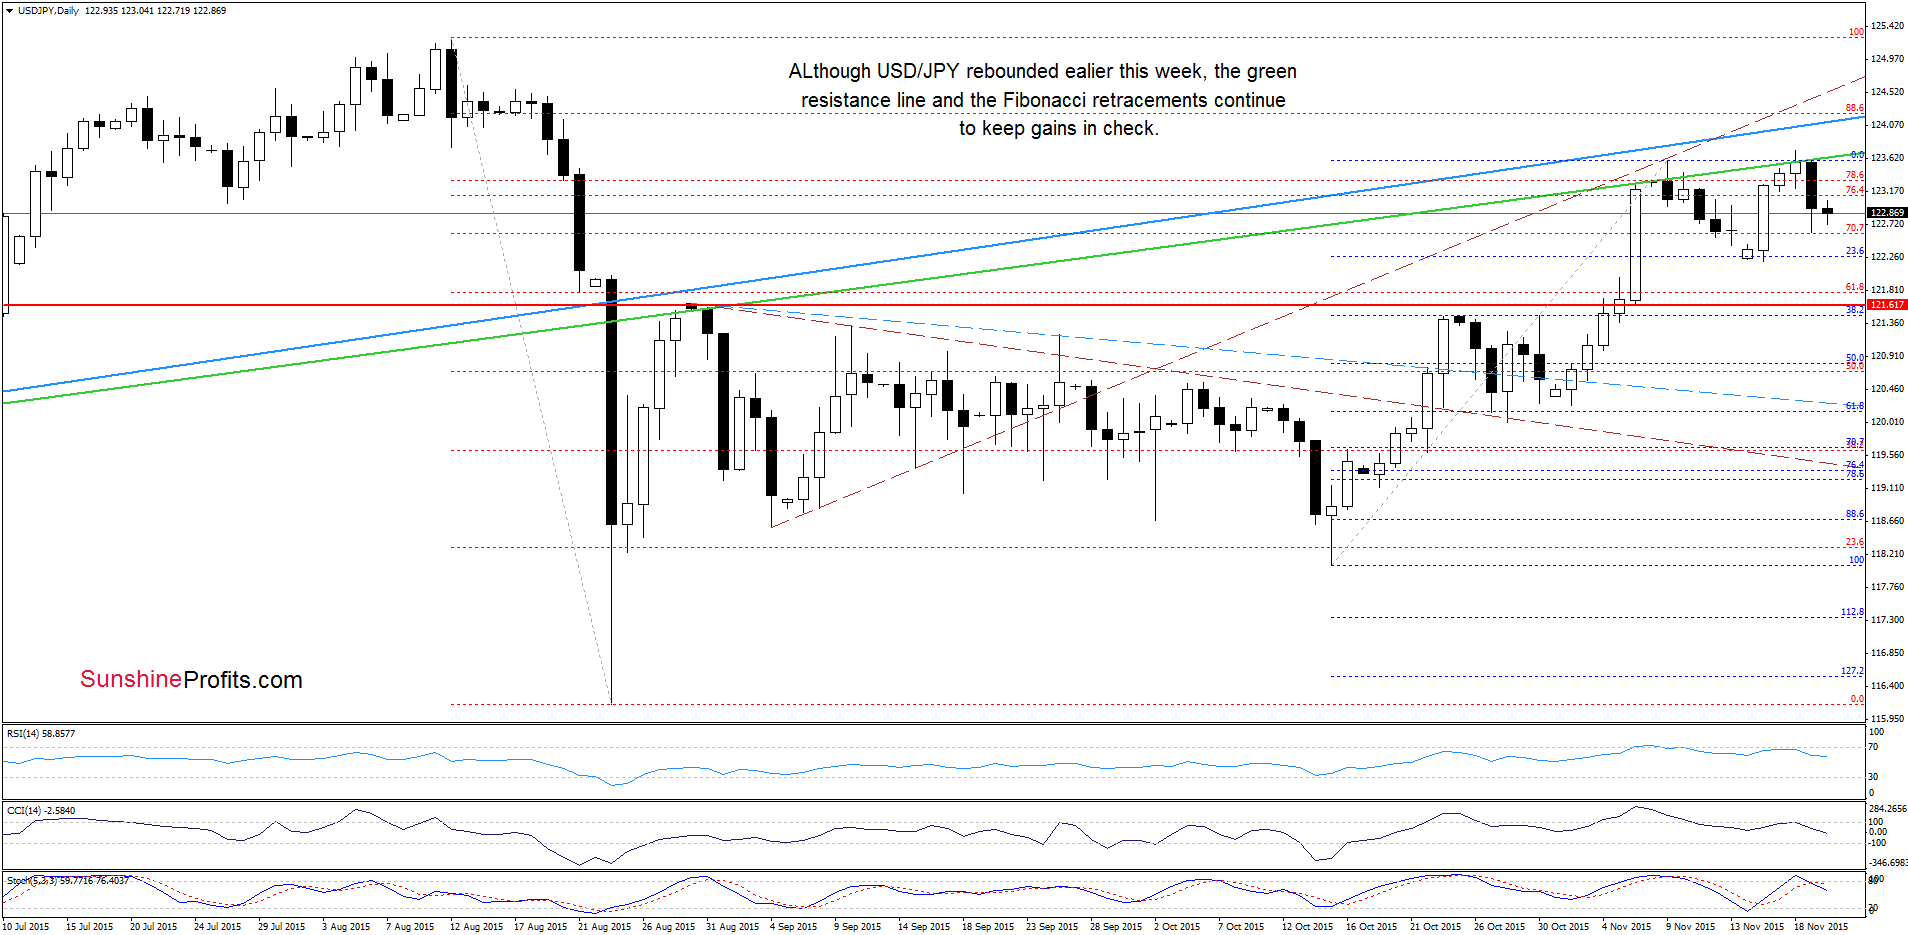
(…) the lower border of the rising trend channel (marked on the monthly chart) and the green resistance line (seen on the daily chart) continue to keep gains in check. Additionally, this area is reinforced by the 76.4% and 78.6% Fibonacci retracement levels, which means that as long as there is no breakout above these lines, further rally is questionable and another pullback should not surprise us. Nevertheless, lower values of the exchange rate will be more likely if all indicators generate sell signals (…)
From today’s point of view we see that the situation developed in line with the above scenario and USD/JPY pulled back in recent days. Taking this fact into account and combining it with sell signals generated by the indicators, we think that our downside target from Wednesday’s commentary will be in play in the coming day(s):
(…) the initial downside target would be around 122.21, where the Monday’s low is.
Please note that if this support is broken we may see a decline even to the red horizontal support line based on the Aug high (around 121.64).
Very short-term outlook: mixed with bearish bias
Short-term outlook: mixed
MT outlook: mixed
LT outlook: mixed
Trading position (short-term; our opinion): No positions are justified from the risk/reward perspective at the moment. We will keep you informed should anything change, or should we see a confirmation/invalidation of the above.
USD/CAD
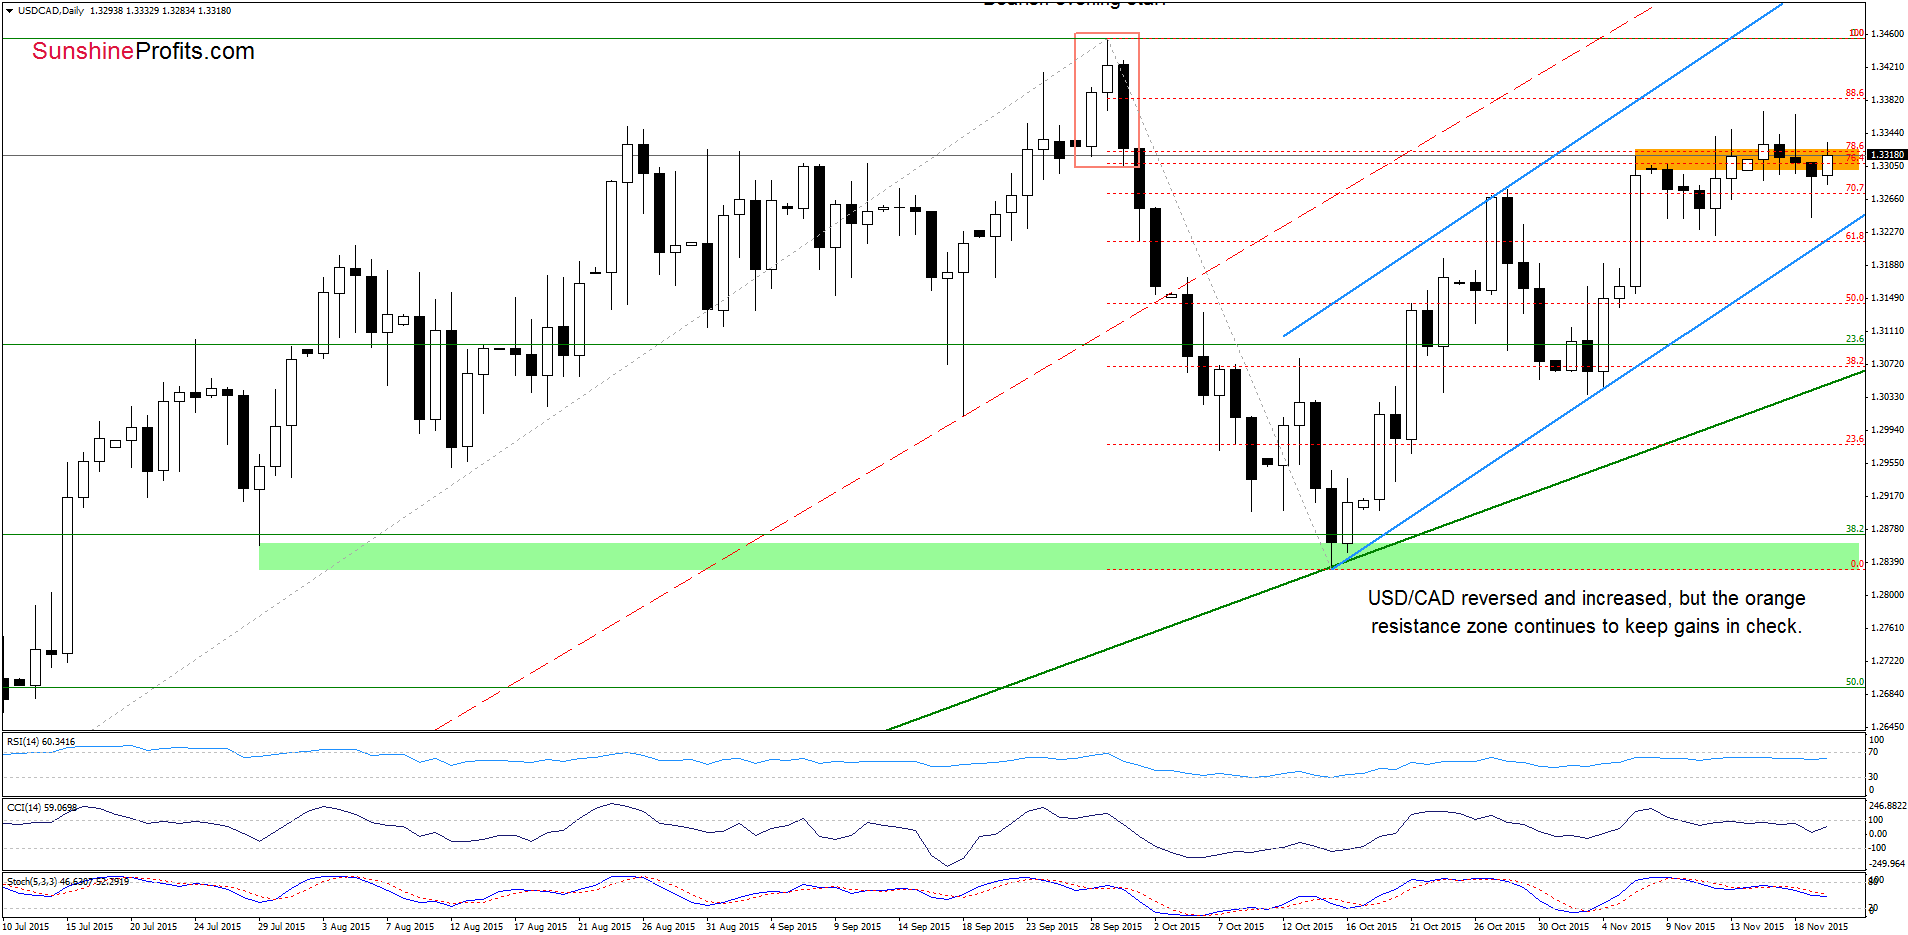
On the daily chart, we see that USD/CAD reversed and increased to the previously-broken orange zone, which looks like a verification of earlier breakdown – especially when we factor in sell signals generated by the indicators. If this is the case, and the pair declines from here, we’ll see (at least) a test of the blue support line (the lower border of the rising trend channel) in the coming day(s).
Very short-term outlook: mixed with bearish bias
Short-term outlook: mixed
MT outlook: mixed
LT outlook: mixed
Trading position (short-term; our opinion): No positions are justified from the risk/reward perspective at the moment. We will keep you informed should anything change, or should we see a confirmation/invalidation of the above.
USD/CHF
Quoting our previous alert:
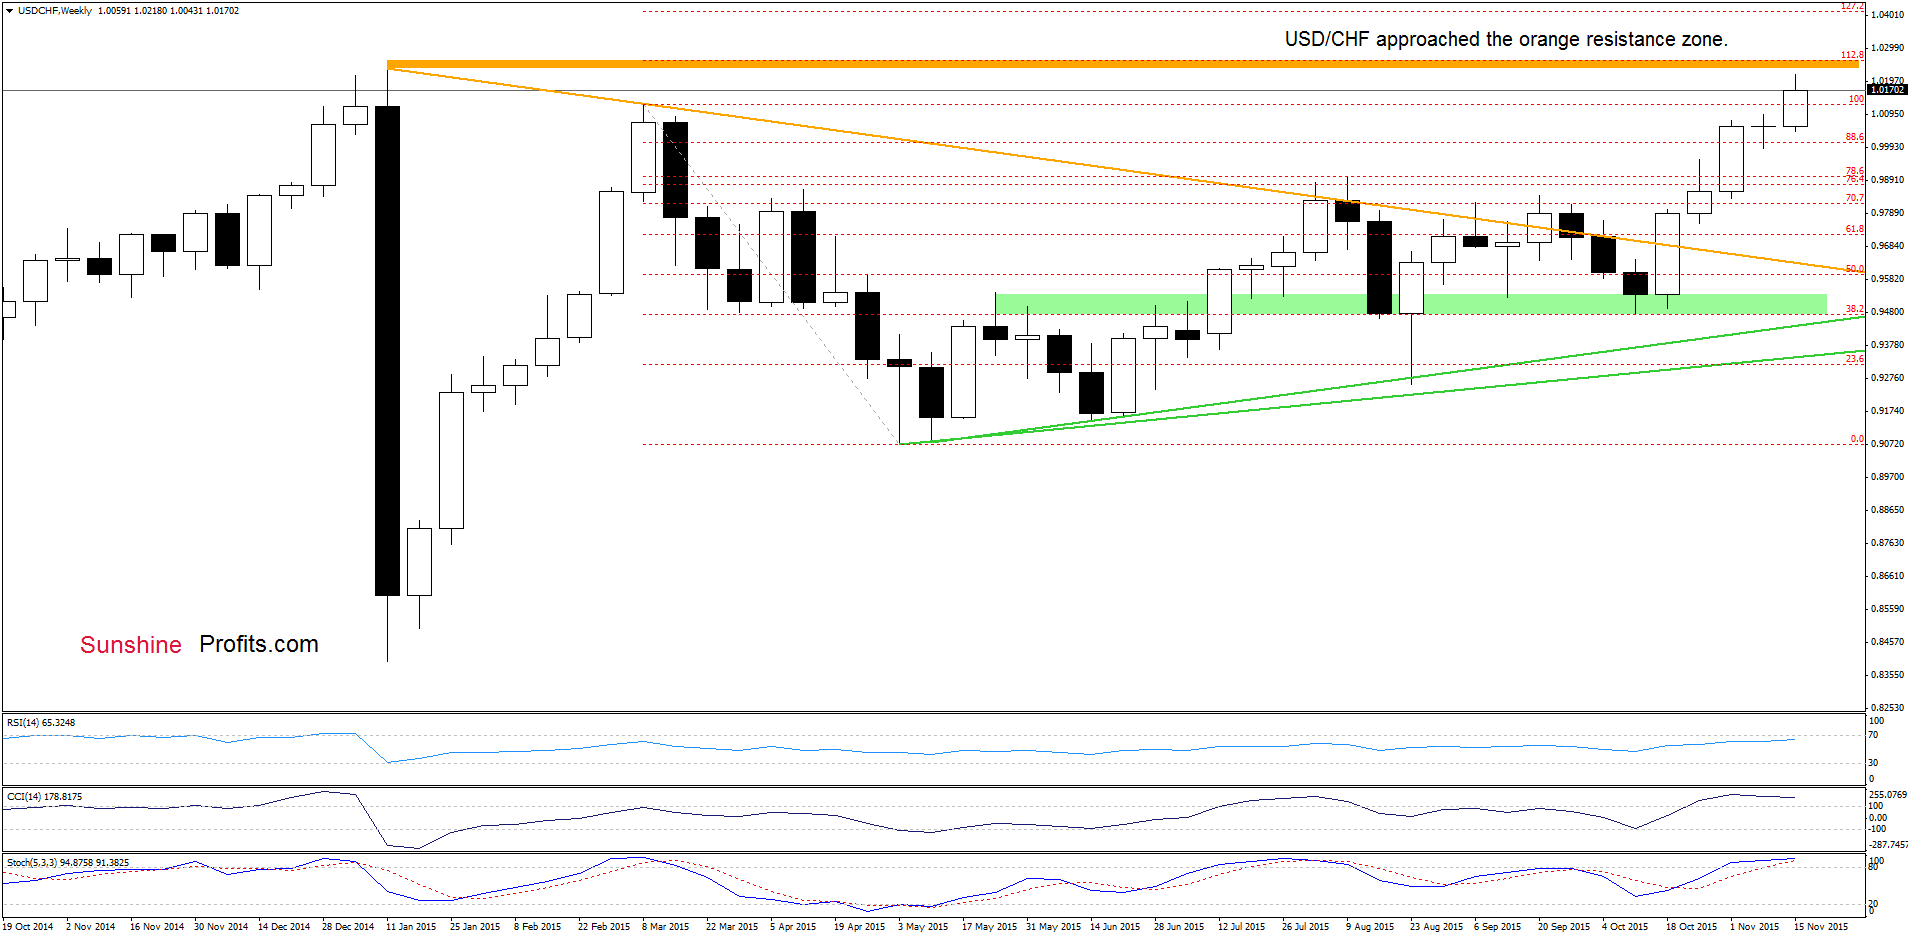
(…) USD/CHF broke above the Mar high and the blue resistance line, approaching the orange resistance zone (created by the Jan high and the 112.8% Fibonacci extension) yesterday. Despite this improvement, currency bulls didn’t manage to hold gained levels and the pair reversed, slipping to the previously-broken blue line. (…) the current position of the indicators suggests that further deterioration is just around the corner. Nevertheless, another attempt to move lower will be more likely (and a downswing will be more reliable) if we see an invalidation of the breakout above the blue line.
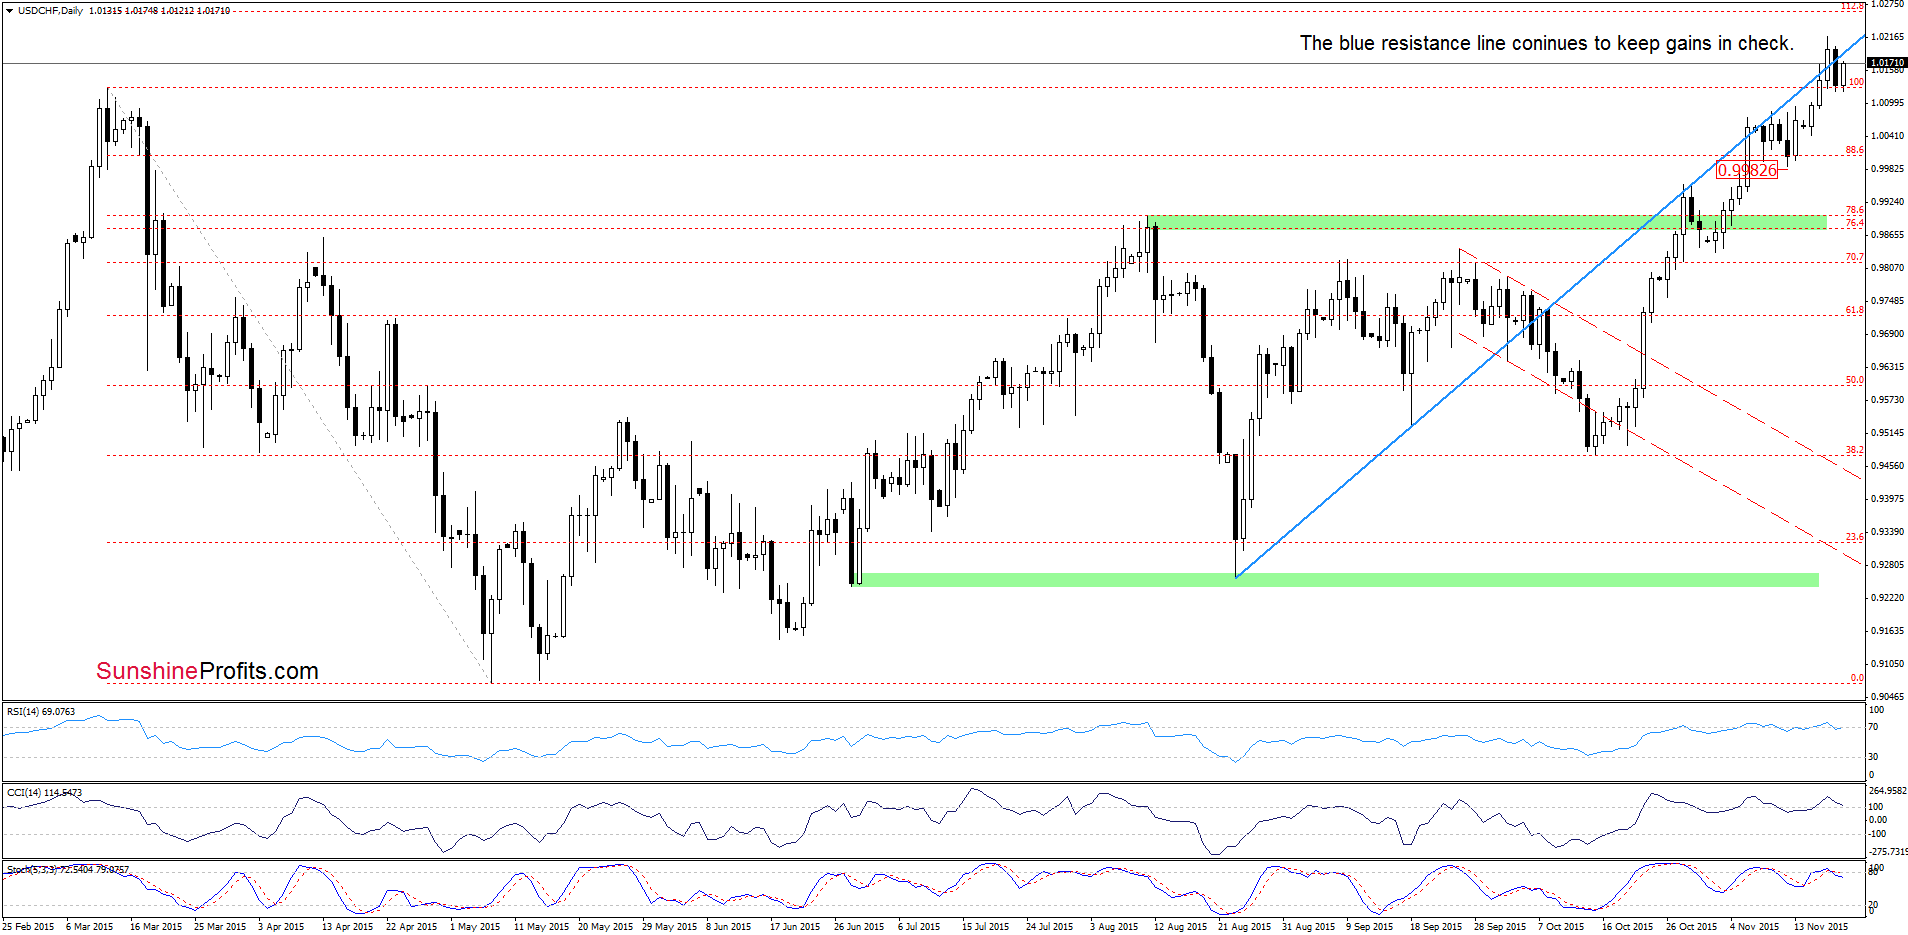
On the daily chart, we see that currency bears pushed the pair under the blue line (as we had expected) yesterday. Earlier today, USD/CHF rebounded and increased to the previously-broken line, but (similarly to what we wrote in case USD/CAD) this upswing looks like a verification of earier breakdown. This scenario is also reinforced by the current position of the inicators (they are very close to generaing sell signal), which suggets that our initial downside target from the previous commentary (around 0.9988, where the bottom of the revious pullback is) will be in play in the coming days.
Very short-term outlook: mixed with bearish bias
Short-term outlook: mixed
MT outlook: mixed
LT outlook: mixed
Trading position (short-term; our opinion): No positions are justified from the risk/reward perspective at the moment. We will keep you informed should anything change, or should we see a confirmation/invalidation of the above.
AUD/USD
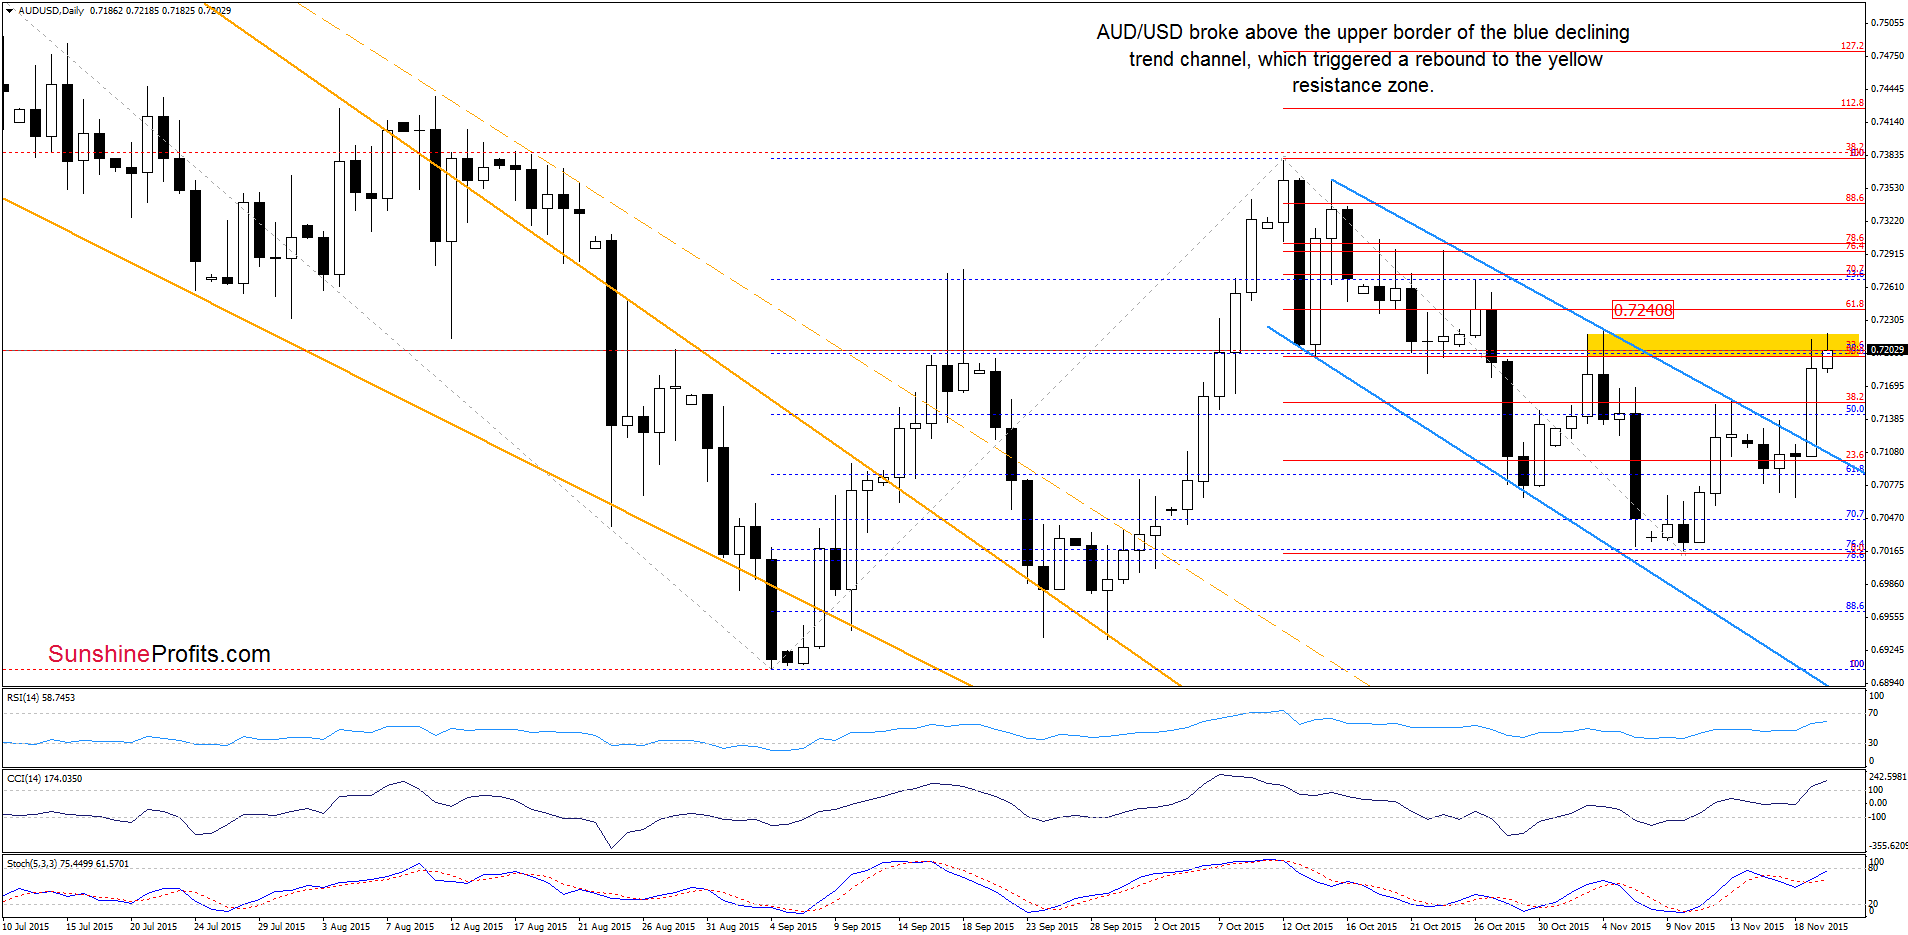
The first thing that catches the eye on the daily chart is a breakout above the upper border of the declining blue trend channel. This positive signal encouraged currency bulls to act, which resulted in a rally to the yellow resistance zone (created by the previous highs and the 50% Fibonacci retracement). Although the pair could pull back from here, the current position of the indicators (buy signals remain in place) suggests further improvement. If this is the case, and AUD/USD moves higher from here, the initial upside target would be the 61.8% retracement or even the resistance area created by the 76.4% and 78.6% Fibonacci levels (around 0.7294-0.7300).
Are there any technical factors that could hinder the realization of the above scenario? Let’s take a closer look at the weekly chart and find out.
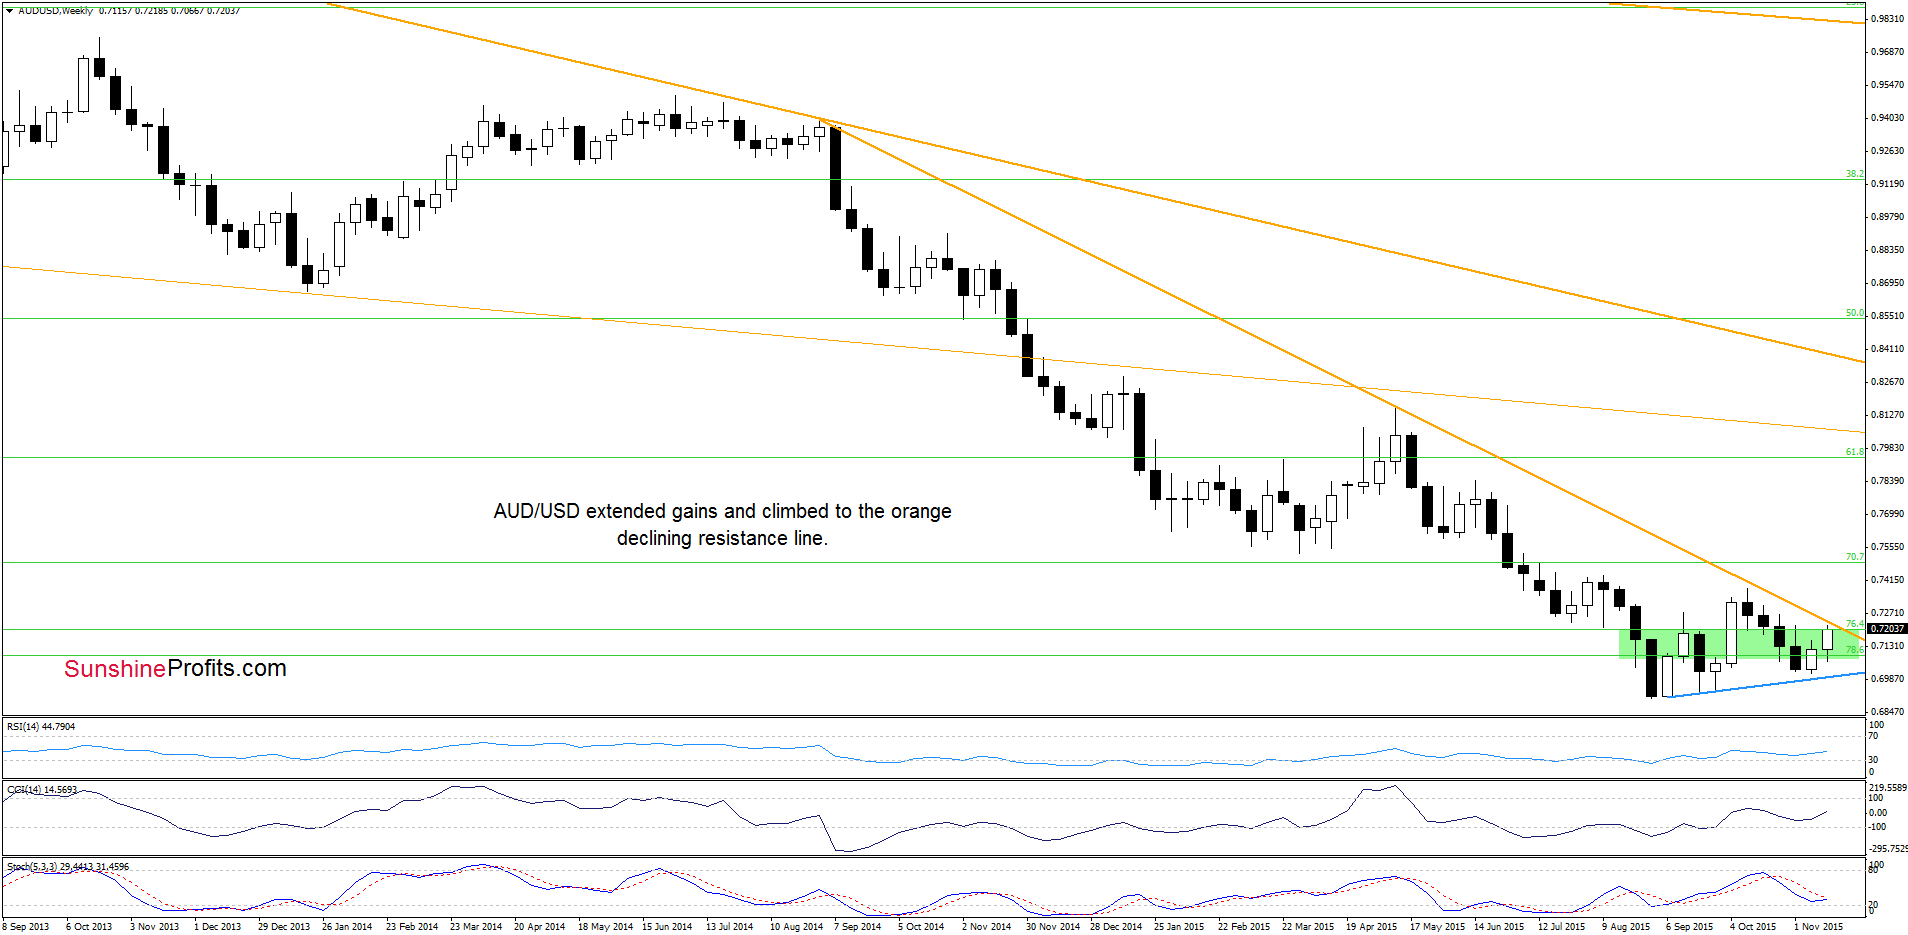
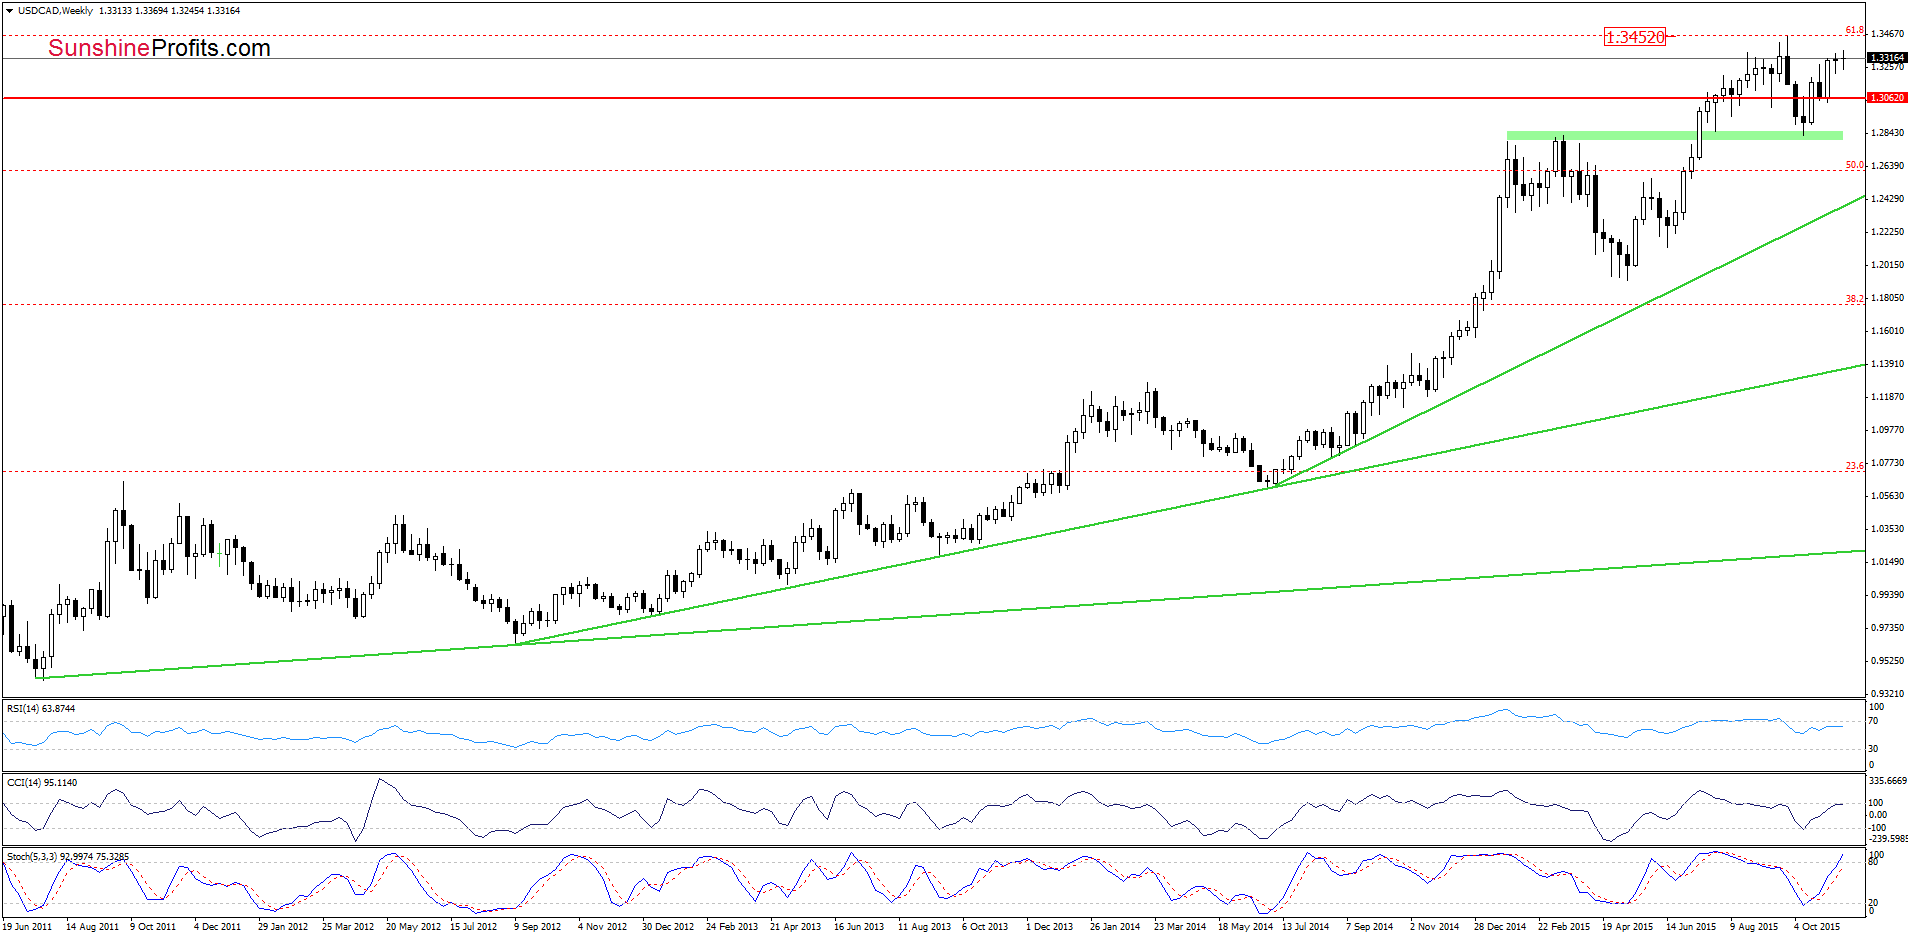
From this perspective, we see that AUD/USD approached the medium-term orange resistance line. Therefore, in our opinion, further rally will be likely only if we see a breakout above this line.
Very short-term outlook: mixed with bullish bias
Short-term outlook: mixed
MT outlook: mixed
LT outlook: mixed
Trading position (short-term; our opinion): No positions are justified from the risk/reward perspective at the moment. We will keep you informed should anything change, or should we see a confirmation/invalidation of the above.
Thank you.
Nadia Simmons
Forex & Oil Trading Strategist
Przemyslaw Radomski, CFA
Founder, Editor-in-chief
Gold & Silver Trading Alerts
Forex Trading Alerts
Oil Investment Updates
Oil Trading Alerts

