

Yesterday, the U.S. Department of Labor showed that the number of initial jobless claims in the week ending November 7 was unchanged from a week earlier (at 276,000), which missed analysts’ expectations for a fall by 6,000. These disappointing numbers, in combination with the Fed Chair Janet Yellen commentary (which gave no indications on the near-term outlook for the U.S. economy or monetary policy) weakened the greenback. As a result, the USD Index declined below the level of 99. What impact did this drop have on the short-term picture of our six currency pairs?
In our opinion the following forex trading positions are justified - summary:
- EUR/USD: short (stop-loss order at 1.1476; initial downside target around 1.0462)
- GBP/USD: none
- USD/JPY: none
- USD/CAD: none
- USD/CHF: none
- AUD/USD: none
EUR/USD
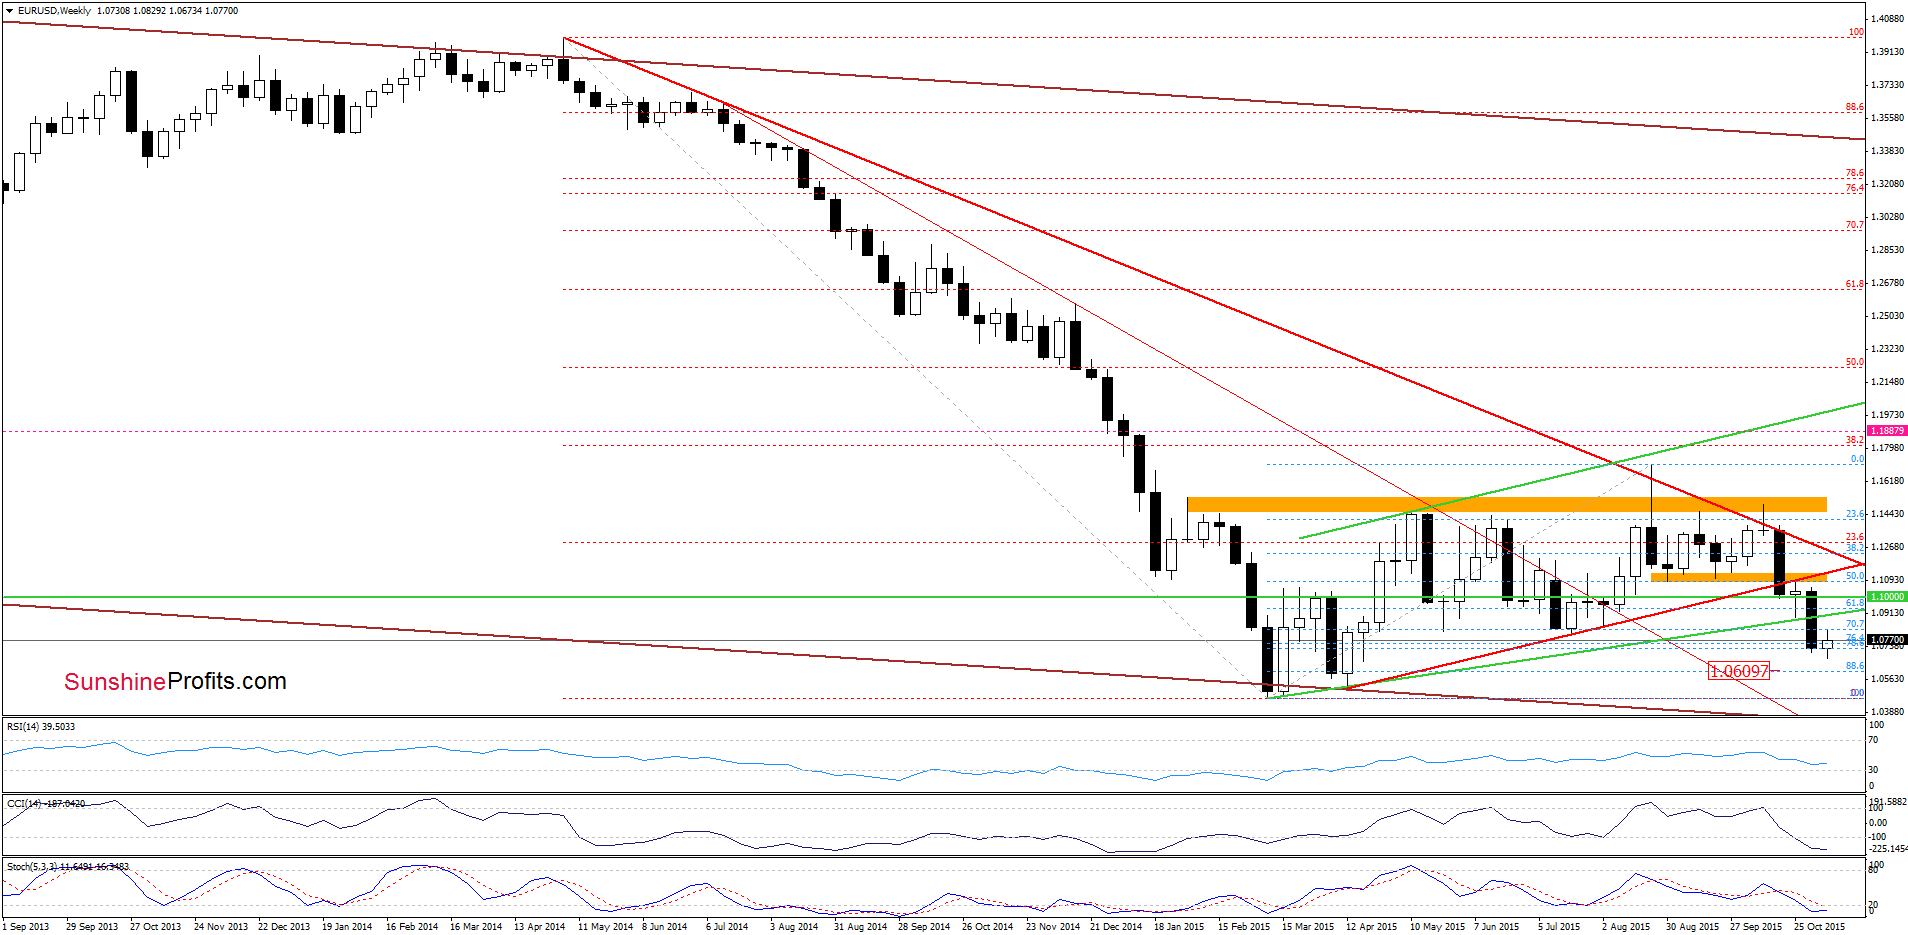
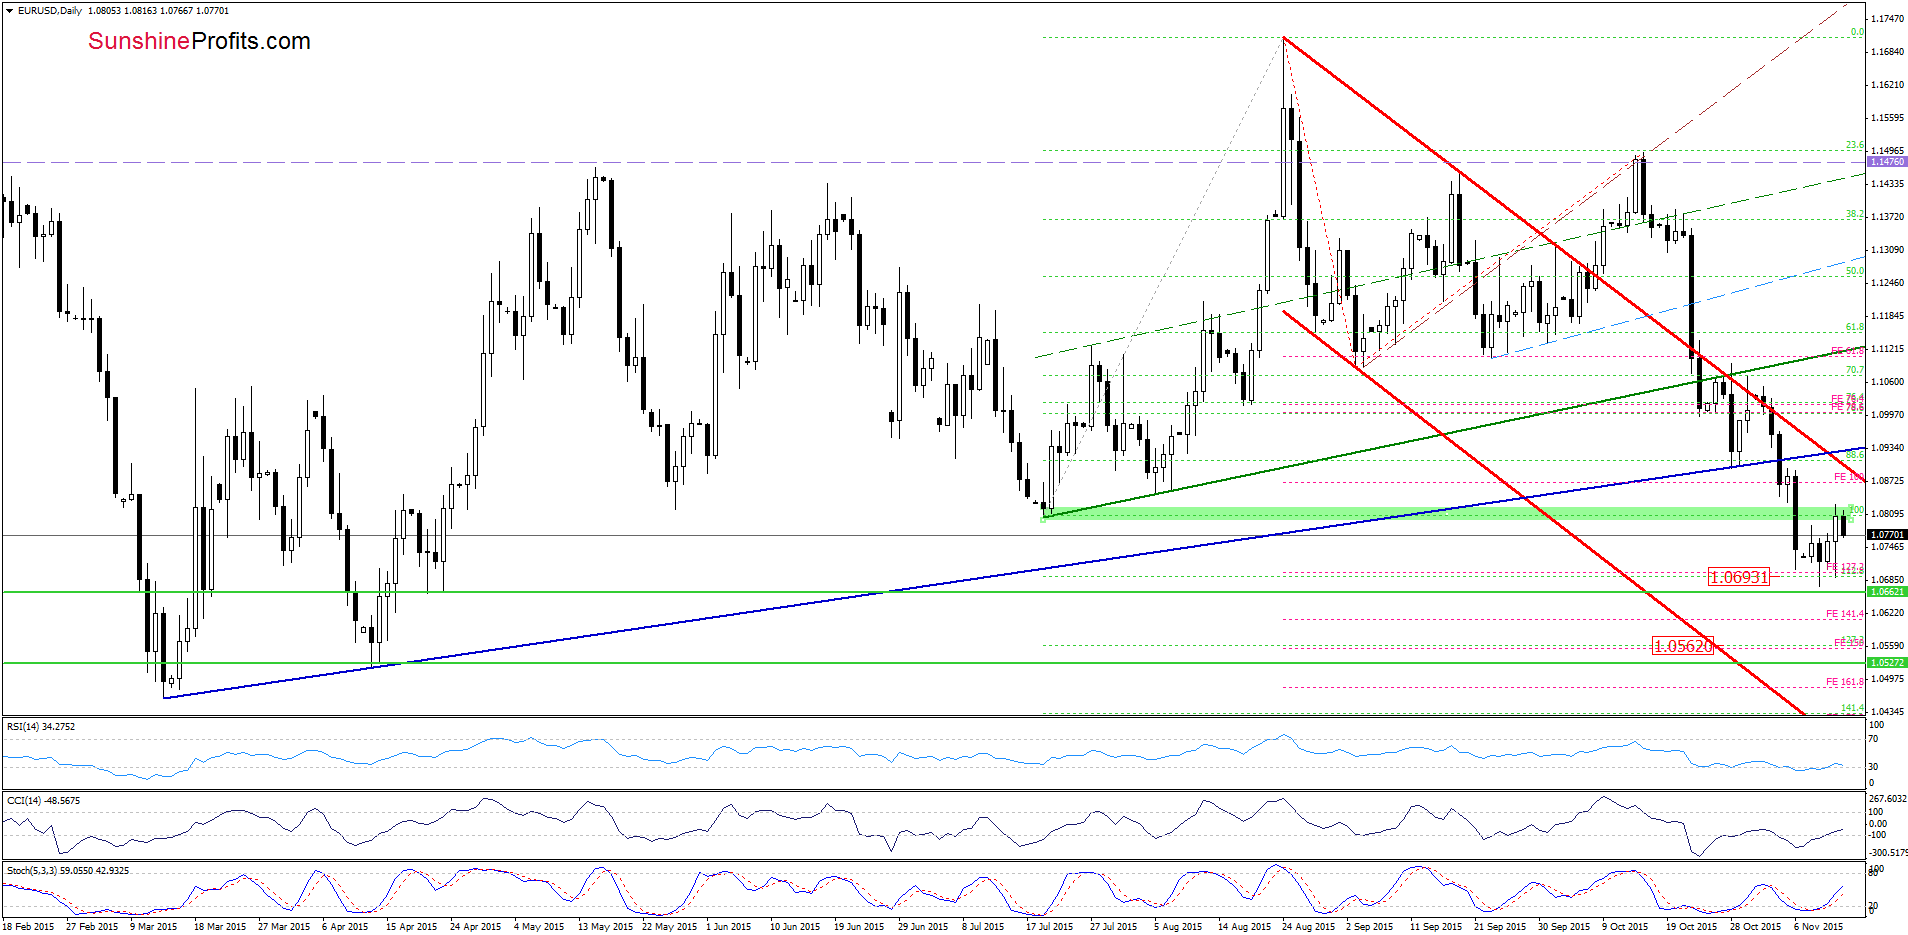
Looking at the charts, we see that EUR/USD moved higher and reached the green zone (based on the Jul lows), which serves as the nearest resistance. Despite this increase, the pair reversed and gave up some of earlier gains earlier today, which means that we’ll likely see further deterioration and a test of the recent low in the coming days. If it withstands the selling pressure, we’ll see another attempt to climb to the green zone. However if it is broken, the next downside target from our Monday’s alert would be in play:
(…) If (…) the pair extends losses, the first target for currency bears would be around 1.0693, where the 112.8% Fibonacci extension (based on the Jul-Aug rally) is. If this support is broken, we may see a decline to 1.0609, where the 88.6% Fibonacci retracement (marked on the weekly chart) is.
Very short-term outlook: bearish
Short-term outlook: bearish
MT outlook: mixed with bearish bias
LT outlook: mixed
Trading position (short-term; our opinion): Short positions (which are profitable) with a stop-loss order at 1.1476 are justified from the risk/reward perspective. We will keep you informed should anything change, or should we see a confirmation/invalidation of the above.
GBP/USD
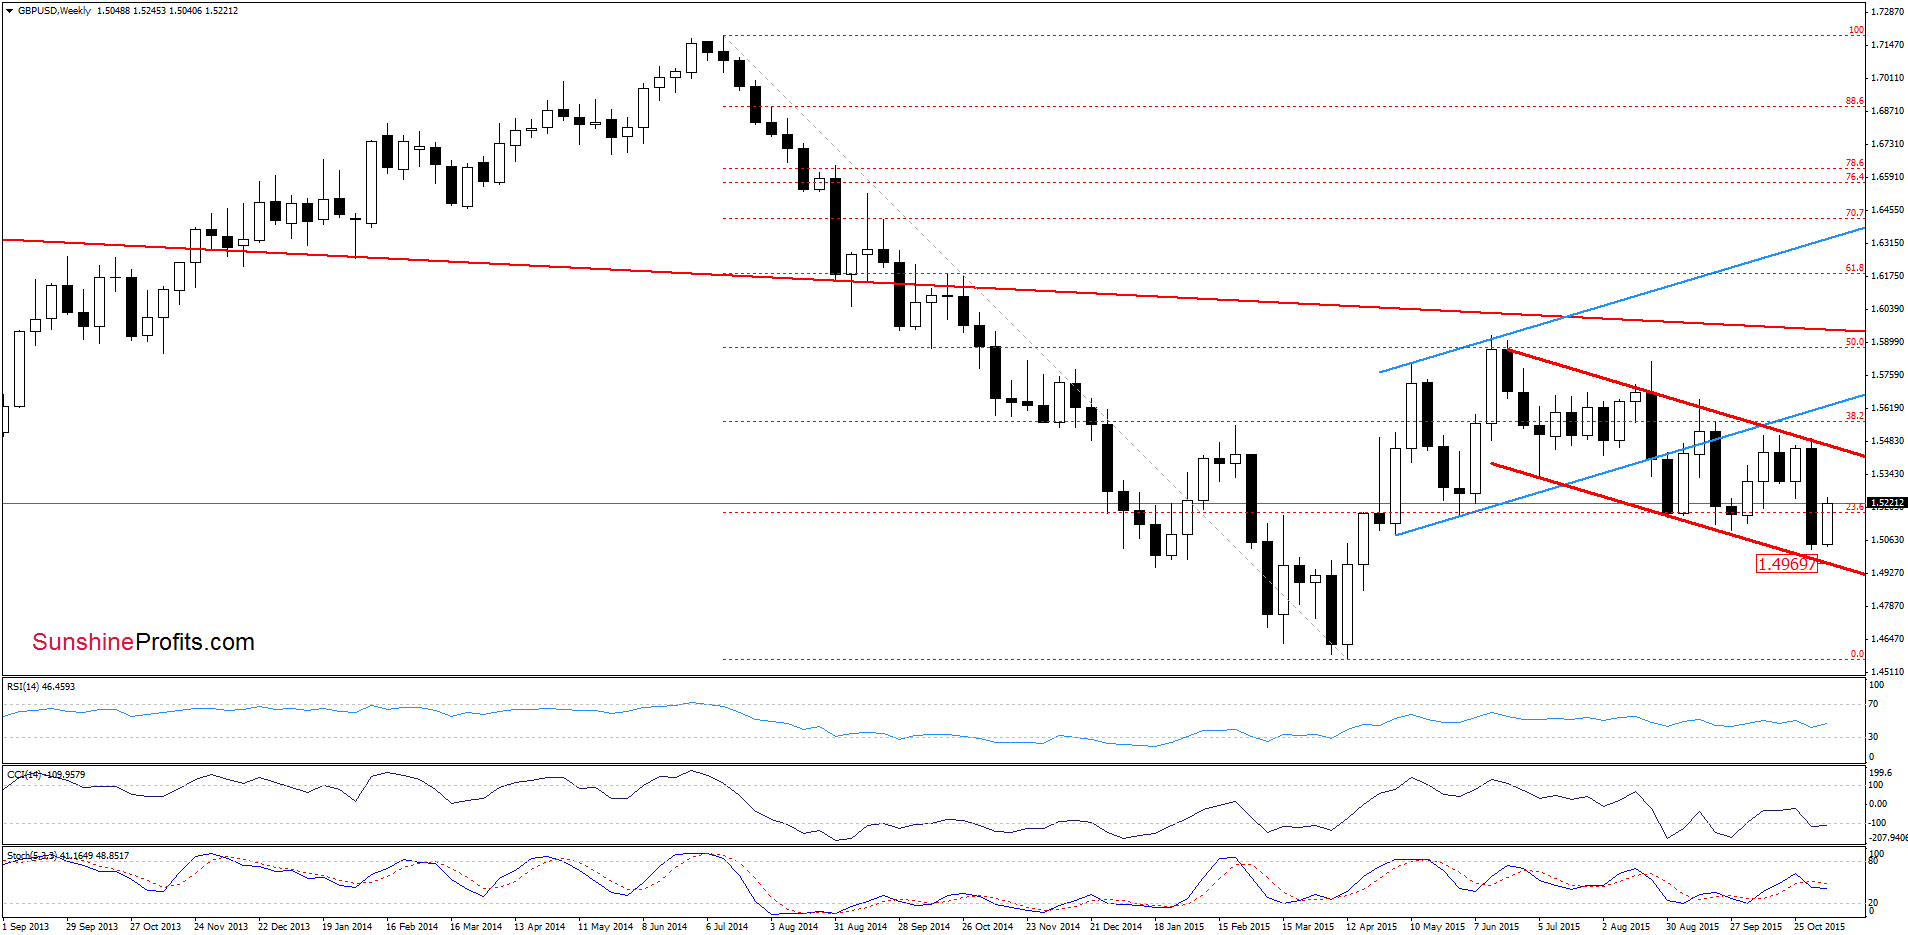
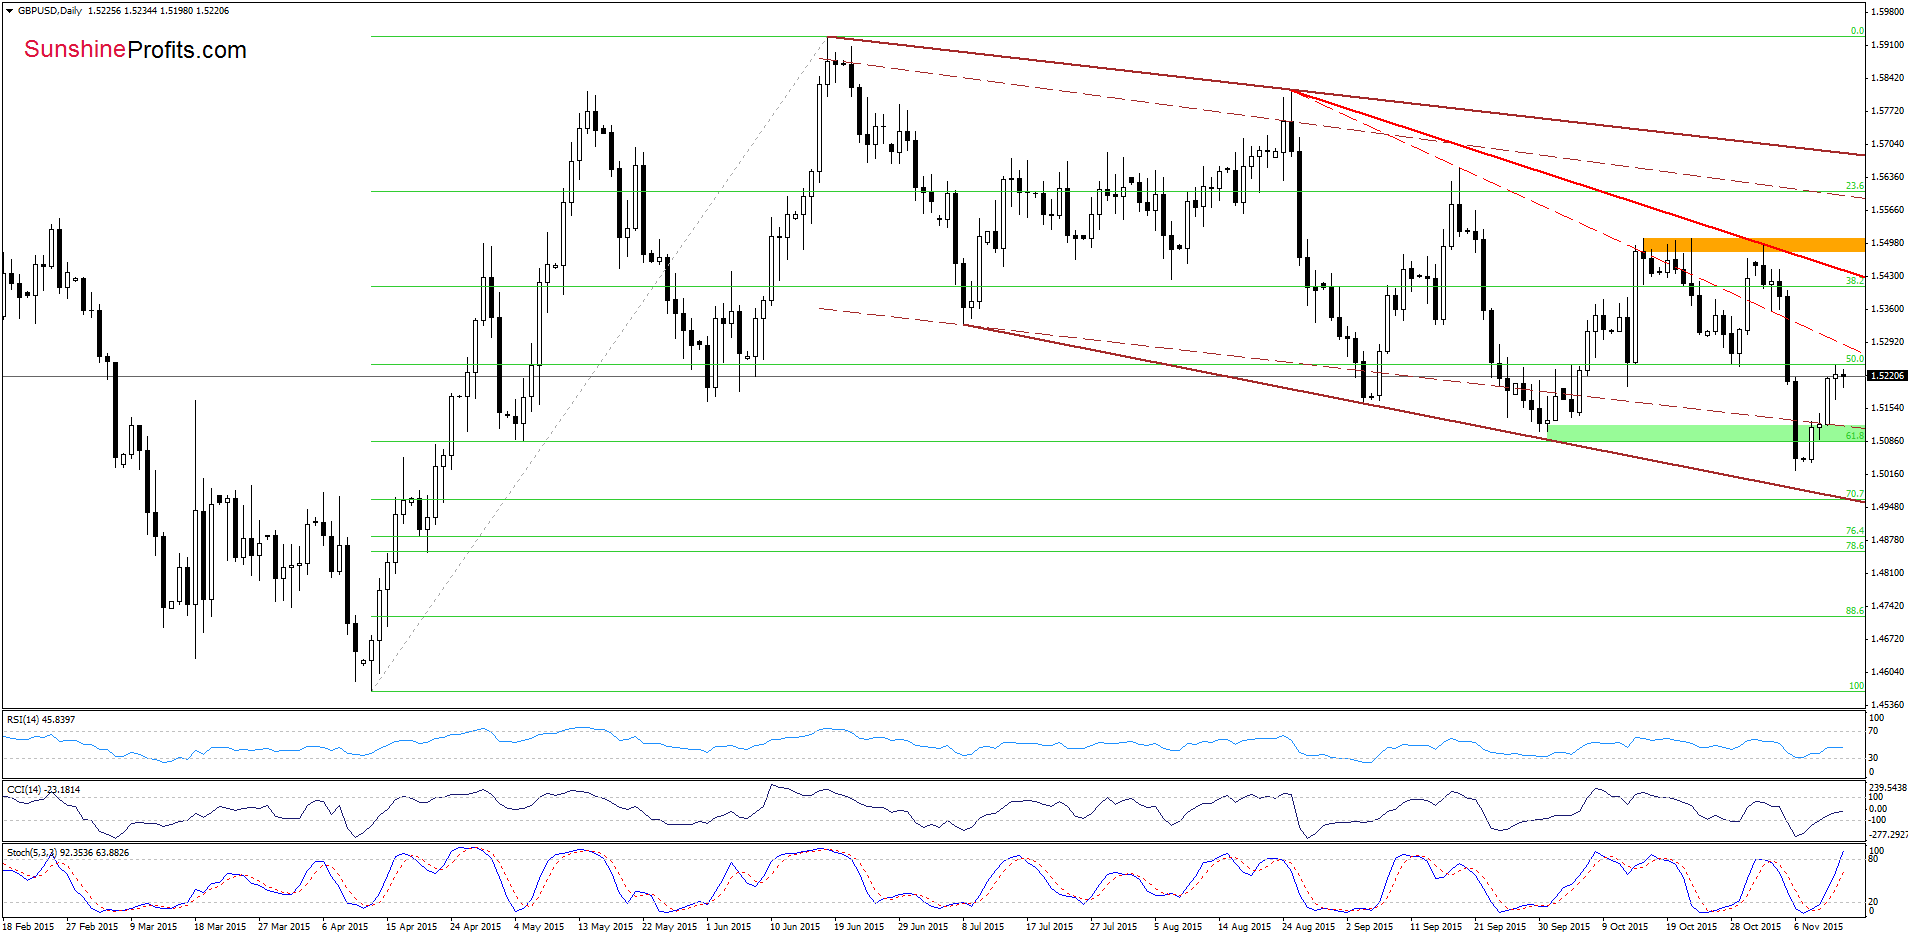
As you see on the charts, currency bulls managed to stop their opponents and triggered a rebound, which invalidated earlier breakdown under the green zone and the lower border of the brown declining trend channel. This positive signal resulted in further improvement and GBP/USD approached the red dashed resistance line. Although the pair could decline from here, the current position of the indicators suggests another attempt to move higher. In this case, the initial upside target would be the above-mentioned red dashed resistance line (around 1.5287) or even the 61.8% Fibonacci retracement (at 1.5316) based on the Nov decline.
Very short-term outlook: mixed
Short-term outlook: mixed
MT outlook: mixed
LT outlook: mixed
Trading position (short-term; our opinion): No positions are justified from the risk/reward perspective at the moment. We will keep you informed should anything change, or should we see a confirmation/invalidation of the above.
USD/JPY
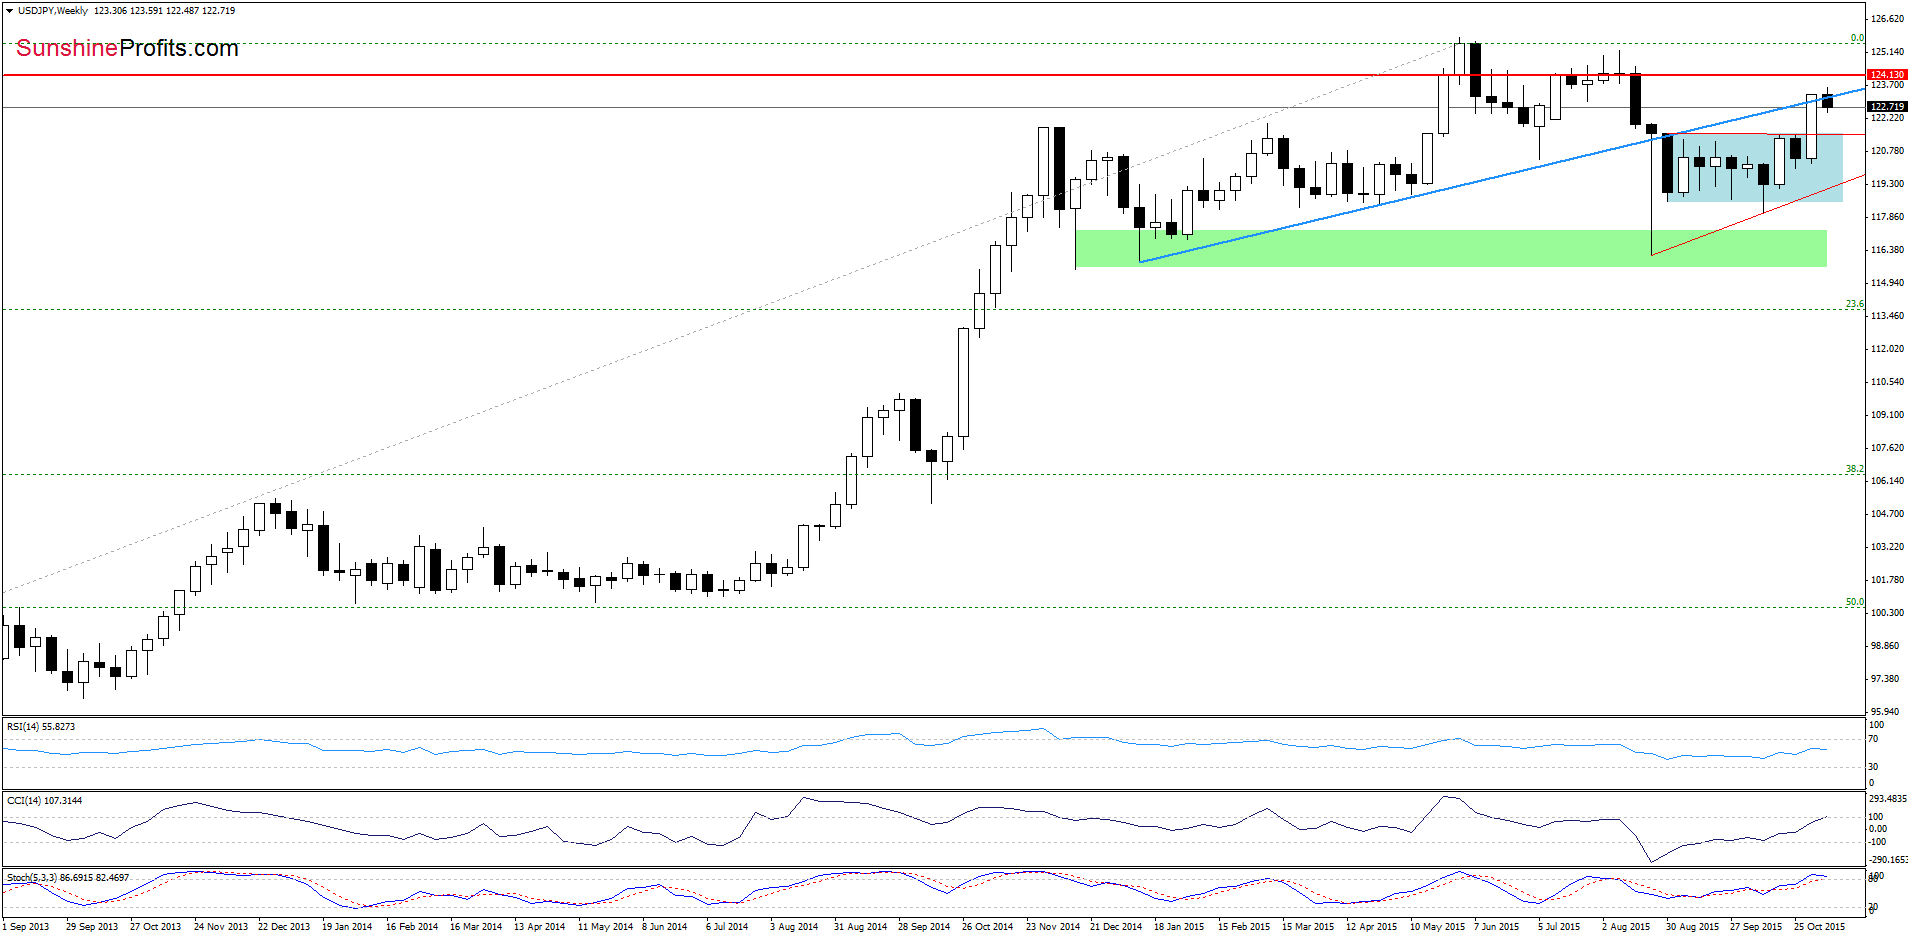
The first thing that catches the eye on te weekly chart is an invalidation of the breakout above the blue resistance line. What impact did this move have n the daily chart? Le’s check.
Quoting our previous commentary:
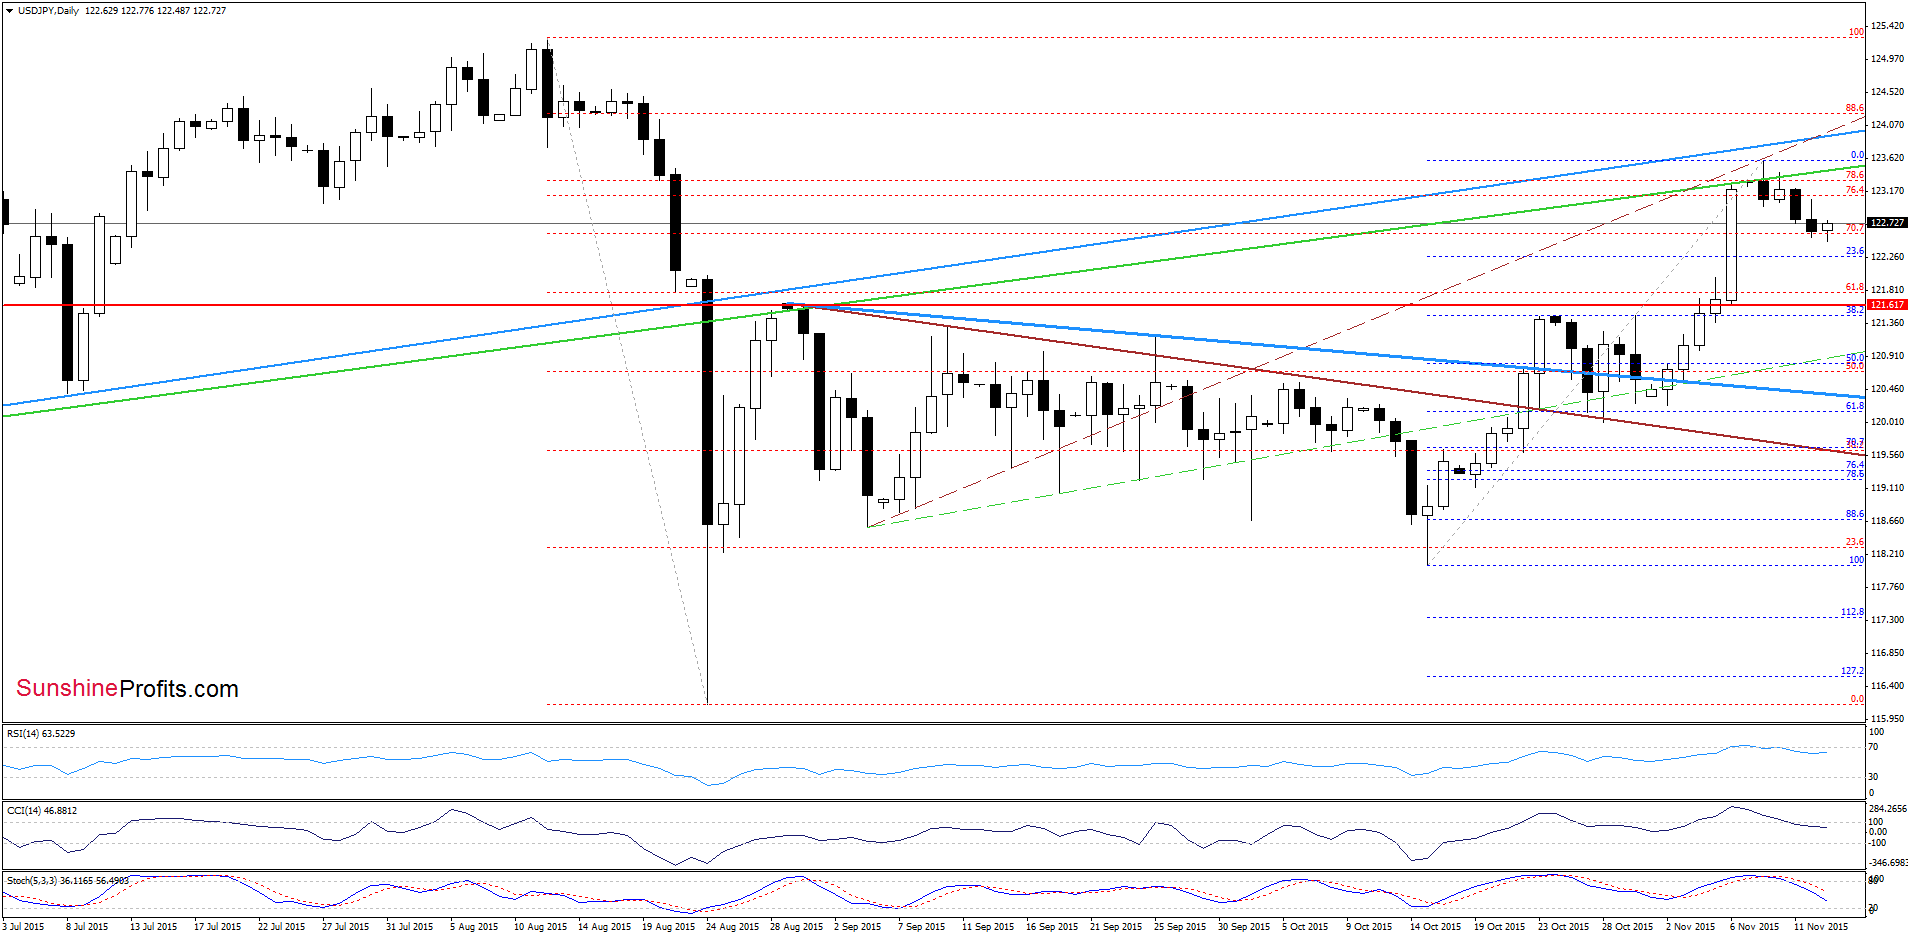
(…) currency bulls managed to push USD/JPY to the resistance area created by the 76.4%, 78.6% Fibonacci retracement levels and the long-term green resistance line. Taking this fact into account, and combining it with the current position of the indicators, it seems that reversal is just around the corner.
As you see on the daily chart, the situation developed in line with the above scenario and USD/JPY reversed in recent days. With this downswing, the pair invalidated earlier breakout above the green line and Fibonacci retracements, which suggests further declines – especially when we factor in sell signals generated by the indicators and an invalidation of the breakout (marked on the weekly chart). Taking all the above into account, we think that the exchange rate will test the previously-broken red horizontal line (based on the Aug high of 121.64) in the coming days.
Very short-term outlook: mixed with bearish bias
Short-term outlook: mixed
MT outlook: mixed
LT outlook: mixed
Trading position (short-term; our opinion): No positions are justified from the risk/reward perspective at the moment. We will keep you informed should anything change, or should we see a confirmation/invalidation of the above.
USD/CAD
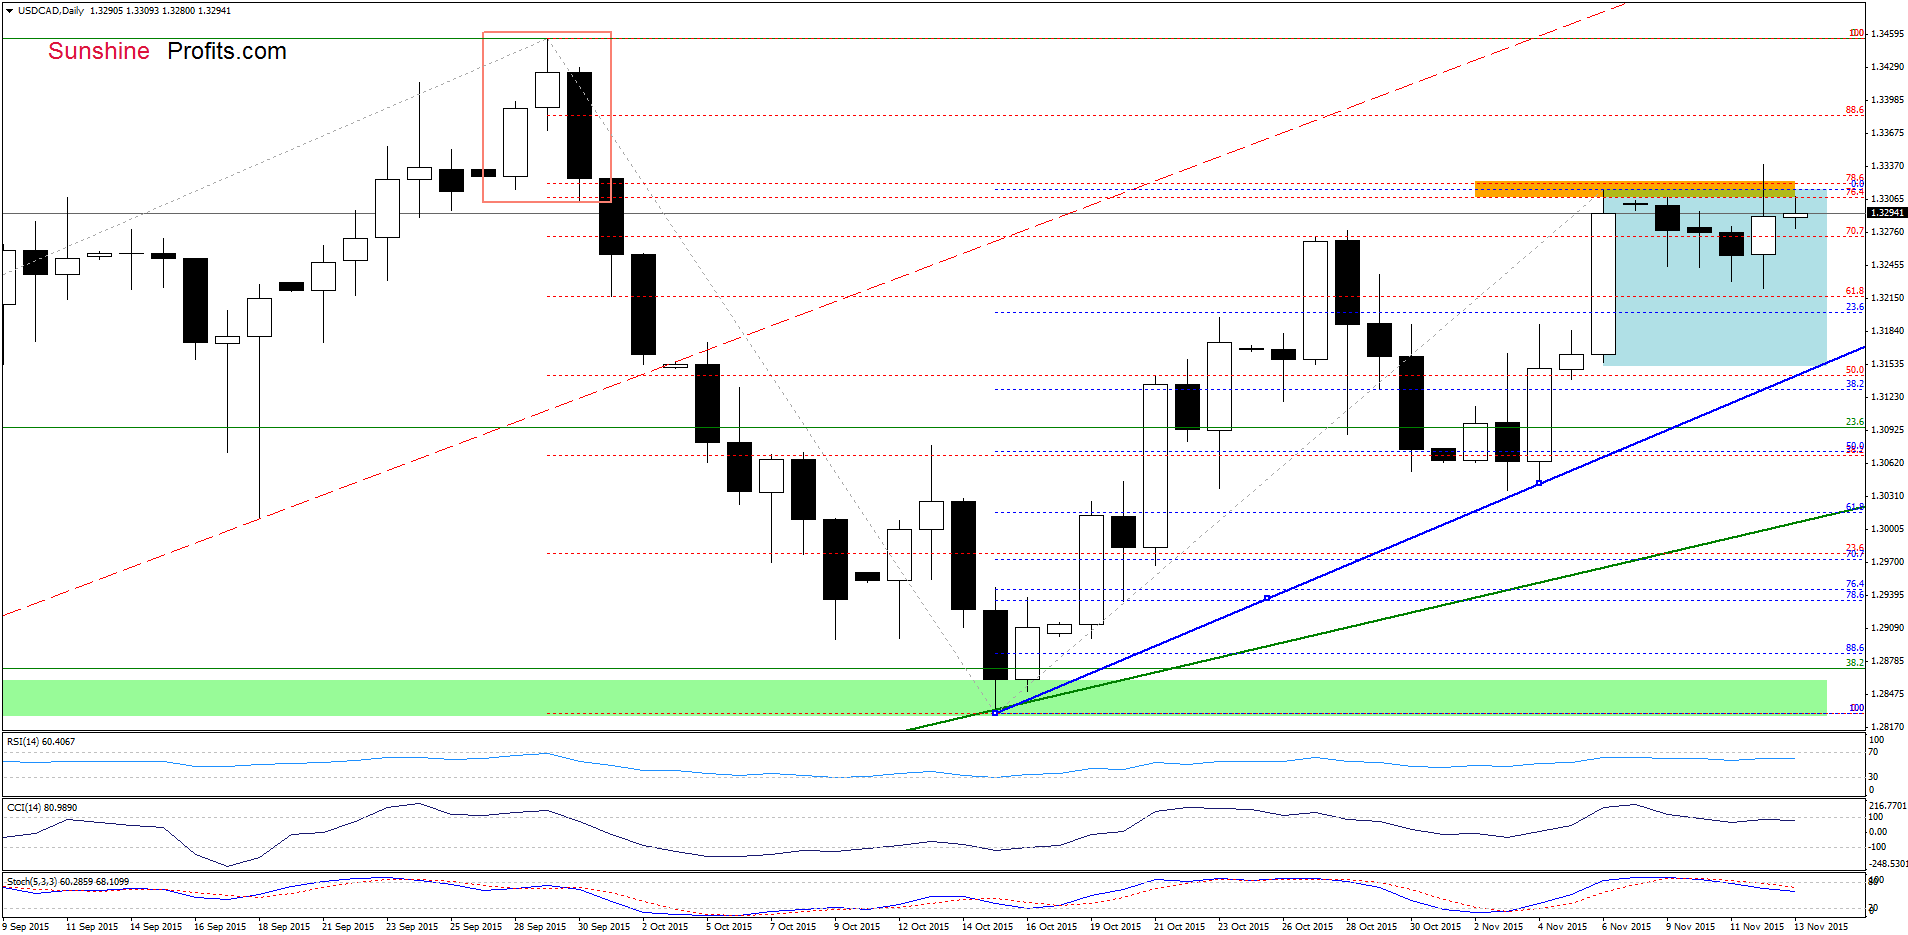
Looking at the charts, we see that USD/CAD extended gains and re-tested the orange resistance zone (created by the 74.6% and 78.6% Fibonacci retracement levels) once again. In the previous week, this area was strong enough to stop further rally and trigger a pullback, which suggests that we may see similar price action in the coming day(s) – especially when we factor in sell signals generated by the indicators. If his is the case, and the pair declines from here, the initial downside target would be the blue support line, which currently intersects the lower border of the blue consolidation (around 1.3150).
Very short-term outlook: mixed with bearish bias
Short-term outlook: mixed
MT outlook: mixed
LT outlook: mixed
Trading position (short-term; our opinion): No positions are justified from the risk/reward perspective at the moment. We will keep you informed should anything change, or should we see a confirmation/invalidation of the above.
USD/CHF
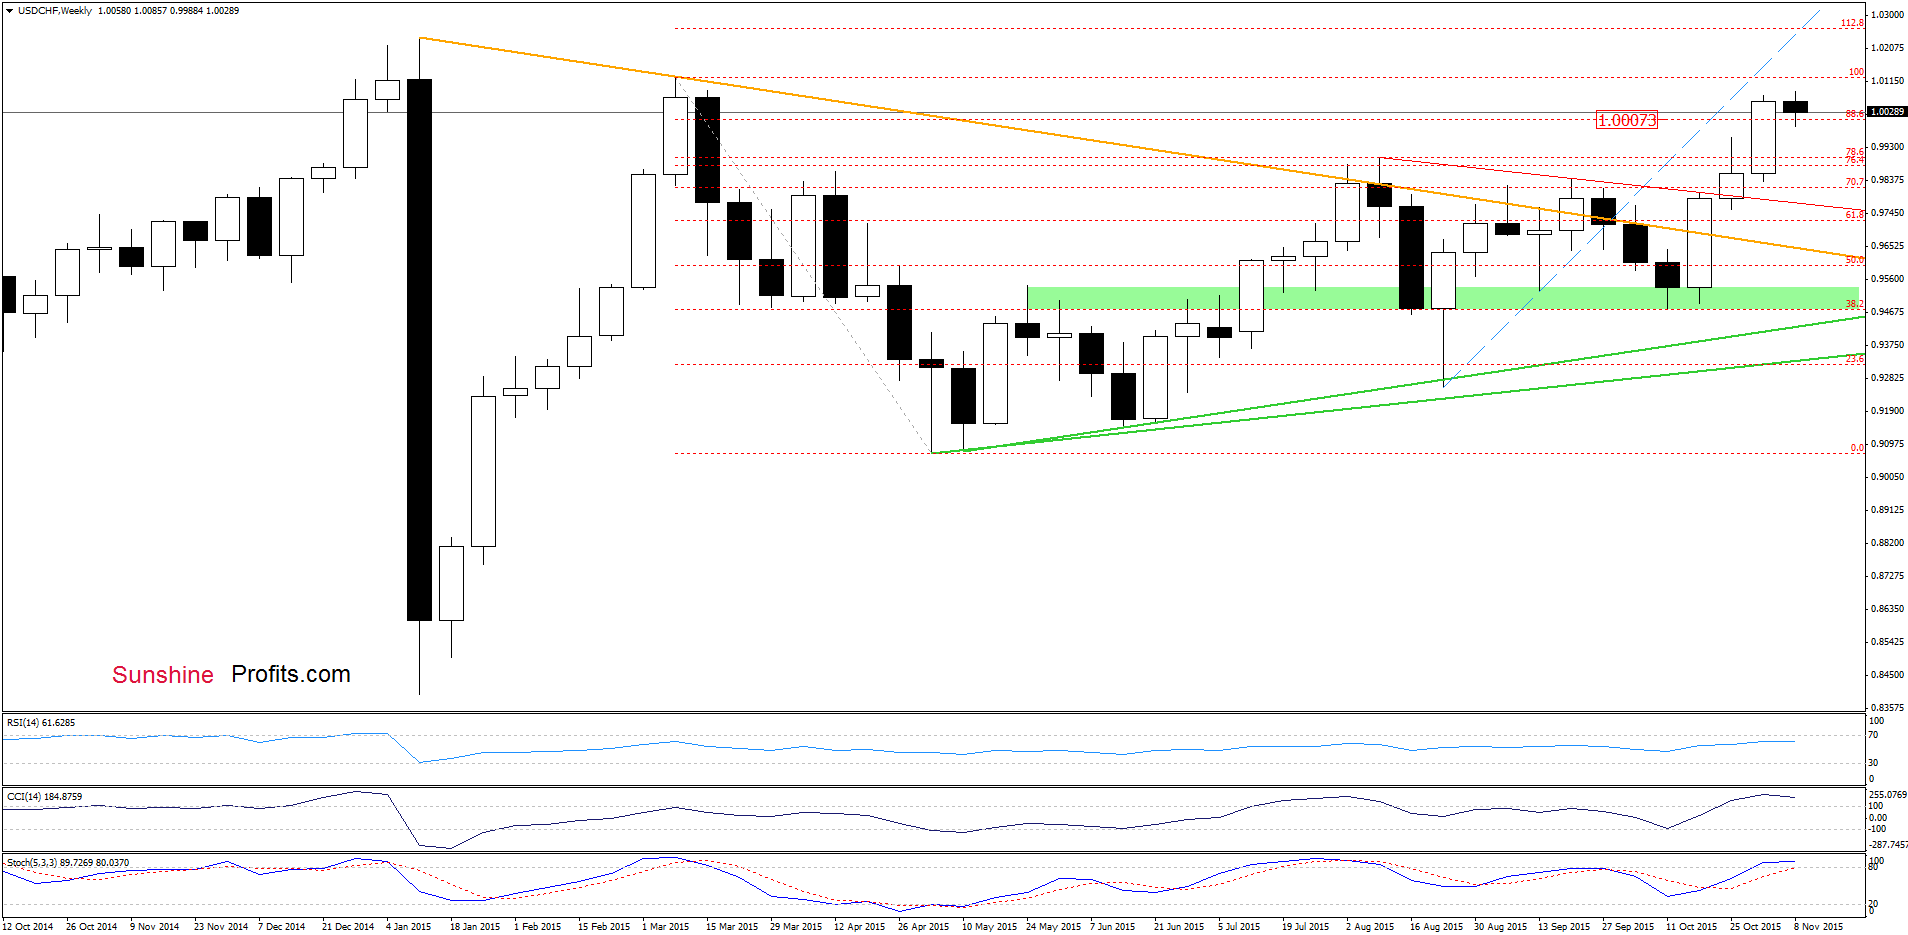
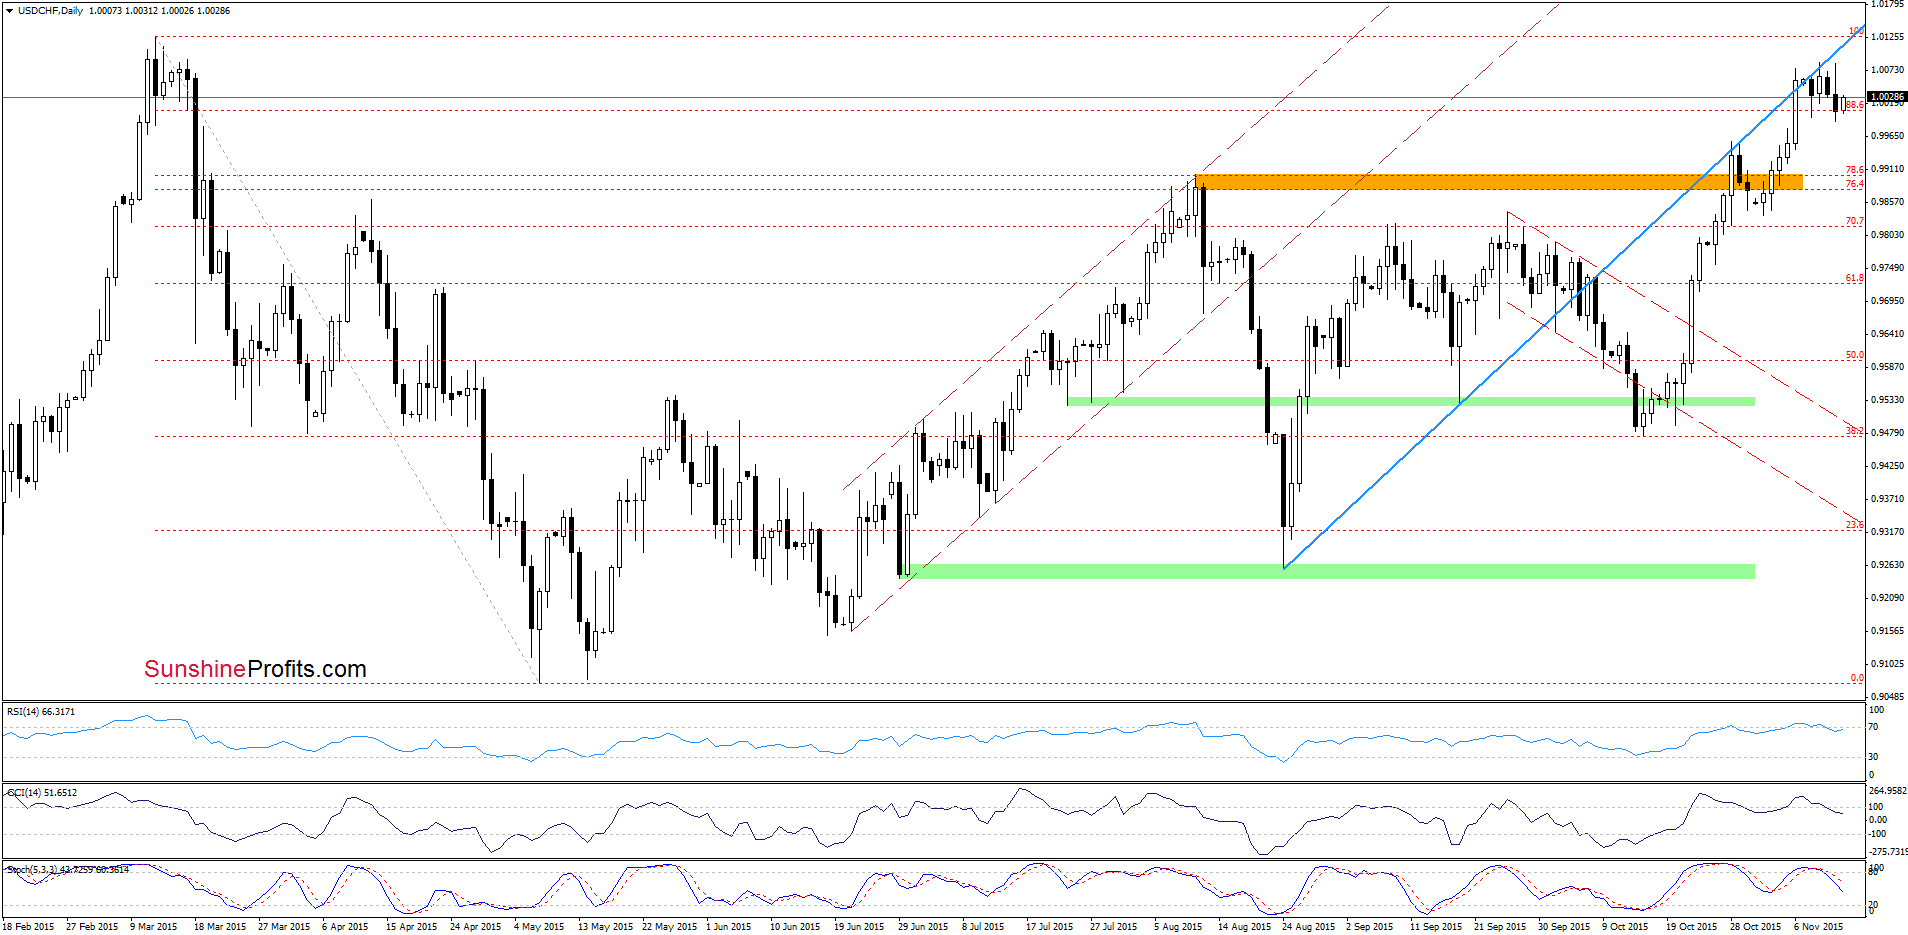
As you see on the daily chart, the blue resistance line continues to keep gains in check. Taking this fact into account, and combining it with sell signals generated by the indicators, it seems that reversal is more likely than not. Nevertheless, in our opinion, further deterioration will be more likely if we see an invalidation of the breakout above the 886 % Fibonacci retracement. If we see such price action, the initial downside target for currency bears would be the previously-broken orange zone.
Very short-term outlook: mixed with bearish bias
Short-term outlook: mixed
MT outlook: mixed
LT outlook: mixed
Trading position (short-term; our opinion): No positions are justified from the risk/reward perspective at the moment. We will keep you informed should anything change, or should we see a confirmation/invalidation of the above.
AUD/USD
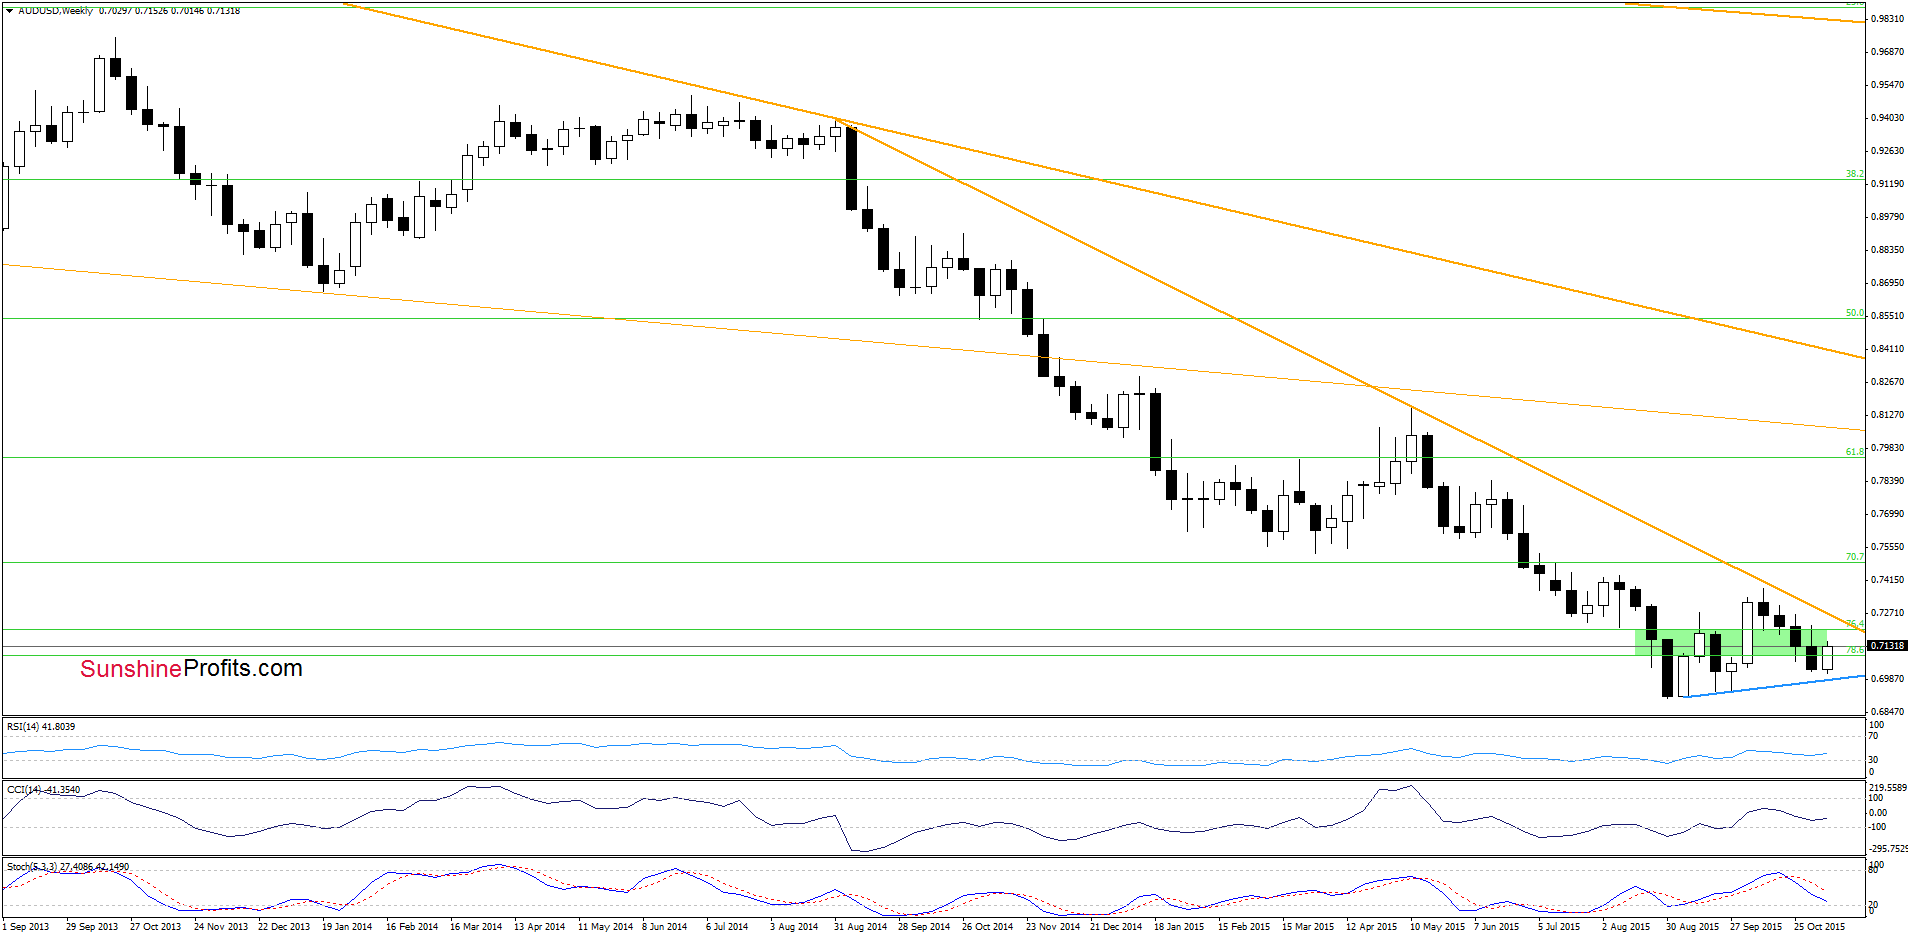
The proximity to the blue support line based on the previous lows encouraged currency bulls to act. As a result, AUD/USD reversed and invalidated earlier breakdown under the lower border of the green support zone, which is a positive signal that suggests further improvement.
But will we see such price action in the coming days? Let’s examine the daily chart and find out.
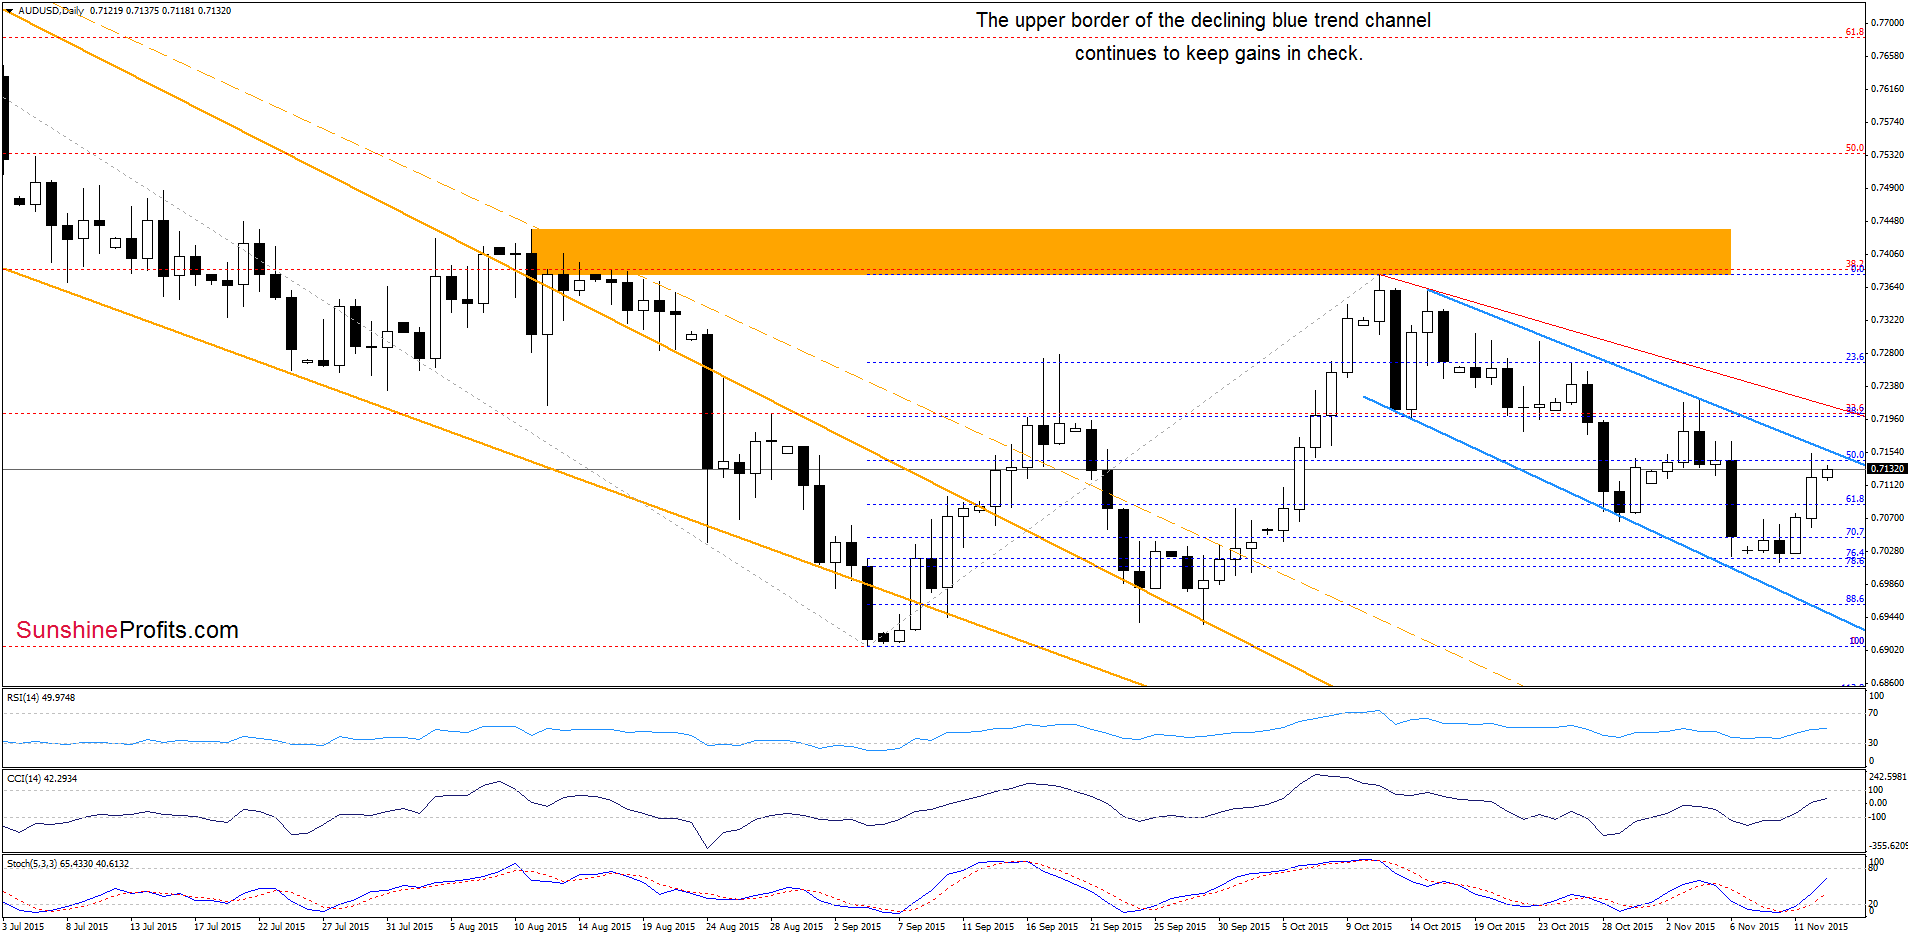
Looking at the daily hart we see that AUD/USD moved little higher earlier today which means that our yesterday’s commentary is up-to-date:
(…) AUD/USD remains under the upper border of the blue declining trend channel, which means that as long as there is no breakout above it further rally is questionable. Nevertheless, the current position of the indicators suggests that currency bulls will try to push the pair higher in the coming day(s).
Very short-term outlook: mixed
Short-term outlook: mixed
MT outlook: mixed
LT outlook: mixed
Trading position (short-term; our opinion): No positions are justified from the risk/reward perspective at the moment. We will keep you informed should anything change, or should we see a confirmation/invalidation of the above.
Thank you.
Nadia Simmons
Forex & Oil Trading Strategist
Przemyslaw Radomski, CFA
Founder, Editor-in-chief
Gold & Silver Trading Alerts
Forex Trading Alerts
Oil Investment Updates
Oil Trading Alerts

