

Earlier today, official data showed that Australia's trade deficit narrowed to A$2.317 billion in September from A$2.711 billion in August, beating analysts’ forecasts. As a result, AUD/USD increased to one-week high and broke above the level of 0.7200. Will we see further improvement in the coming days?
In our opinion the following forex trading positions are justified - summary:
- EUR/USD: short (stop-loss order at 1.1476; initial downside target around 1.0462)
- GBP/USD: none
- USD/JPY: none
- USD/CAD: none
- USD/CHF: none
- AUD/USD: none
EUR/USD
Quoting our previous commentary:
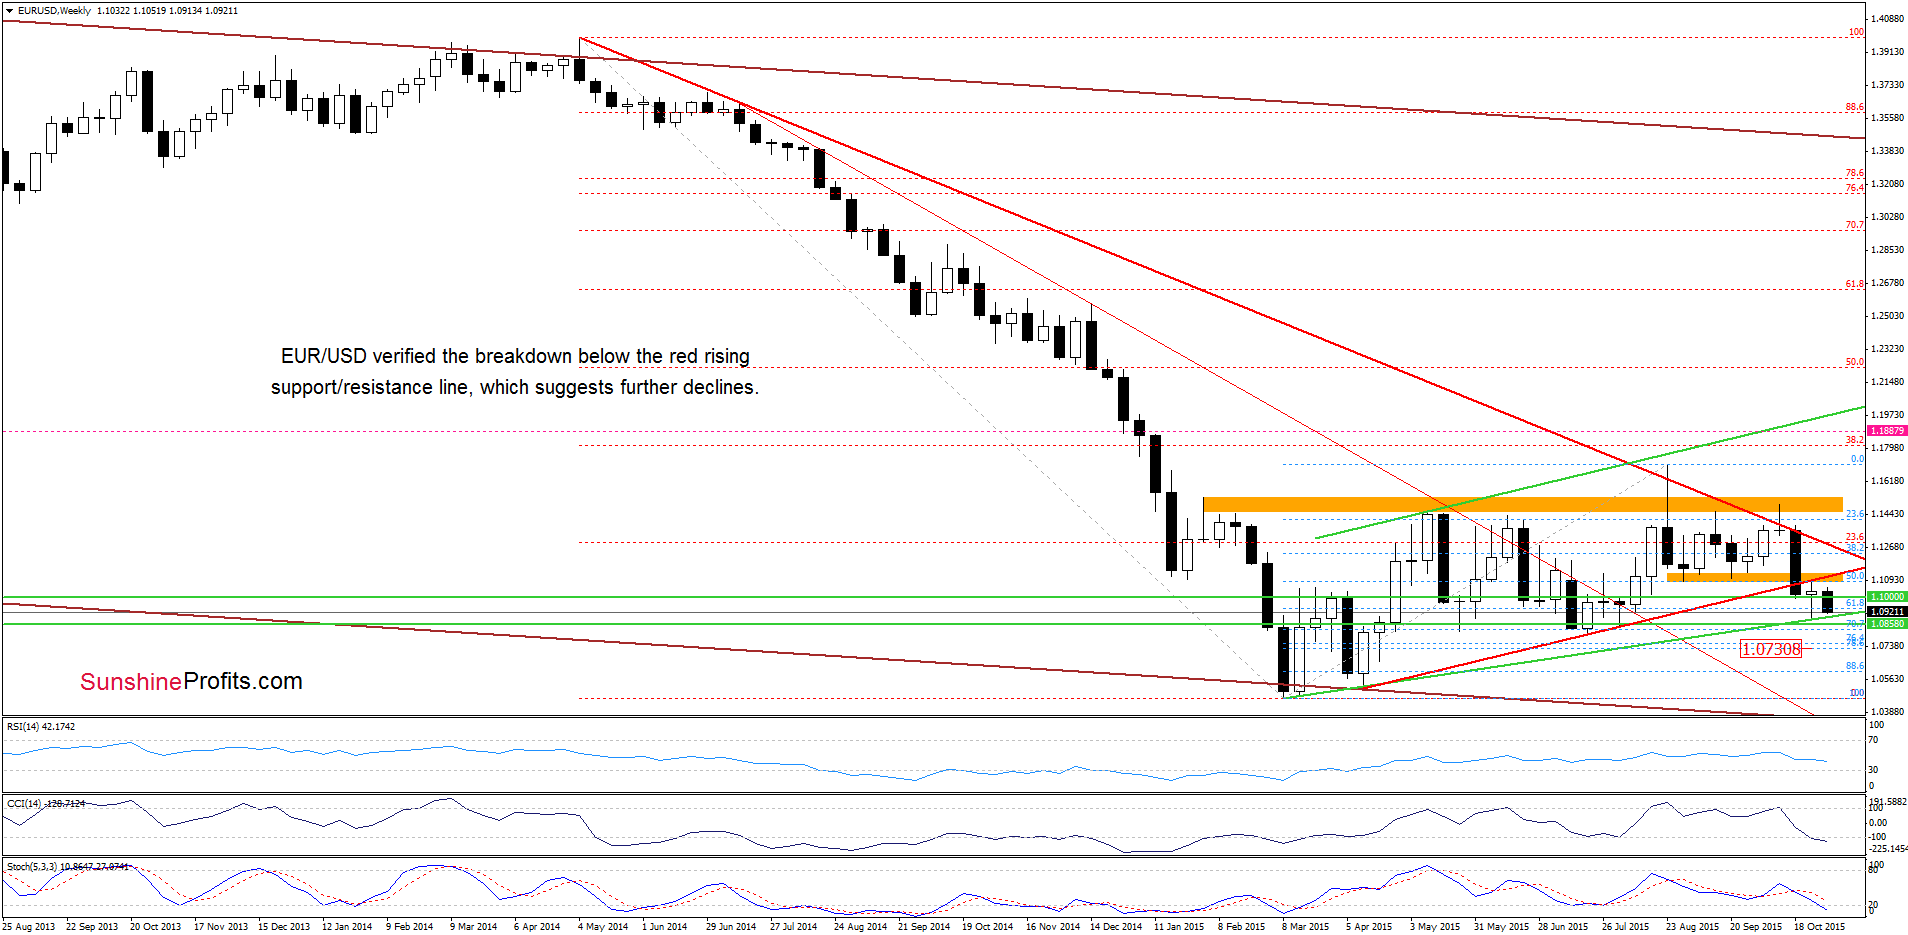
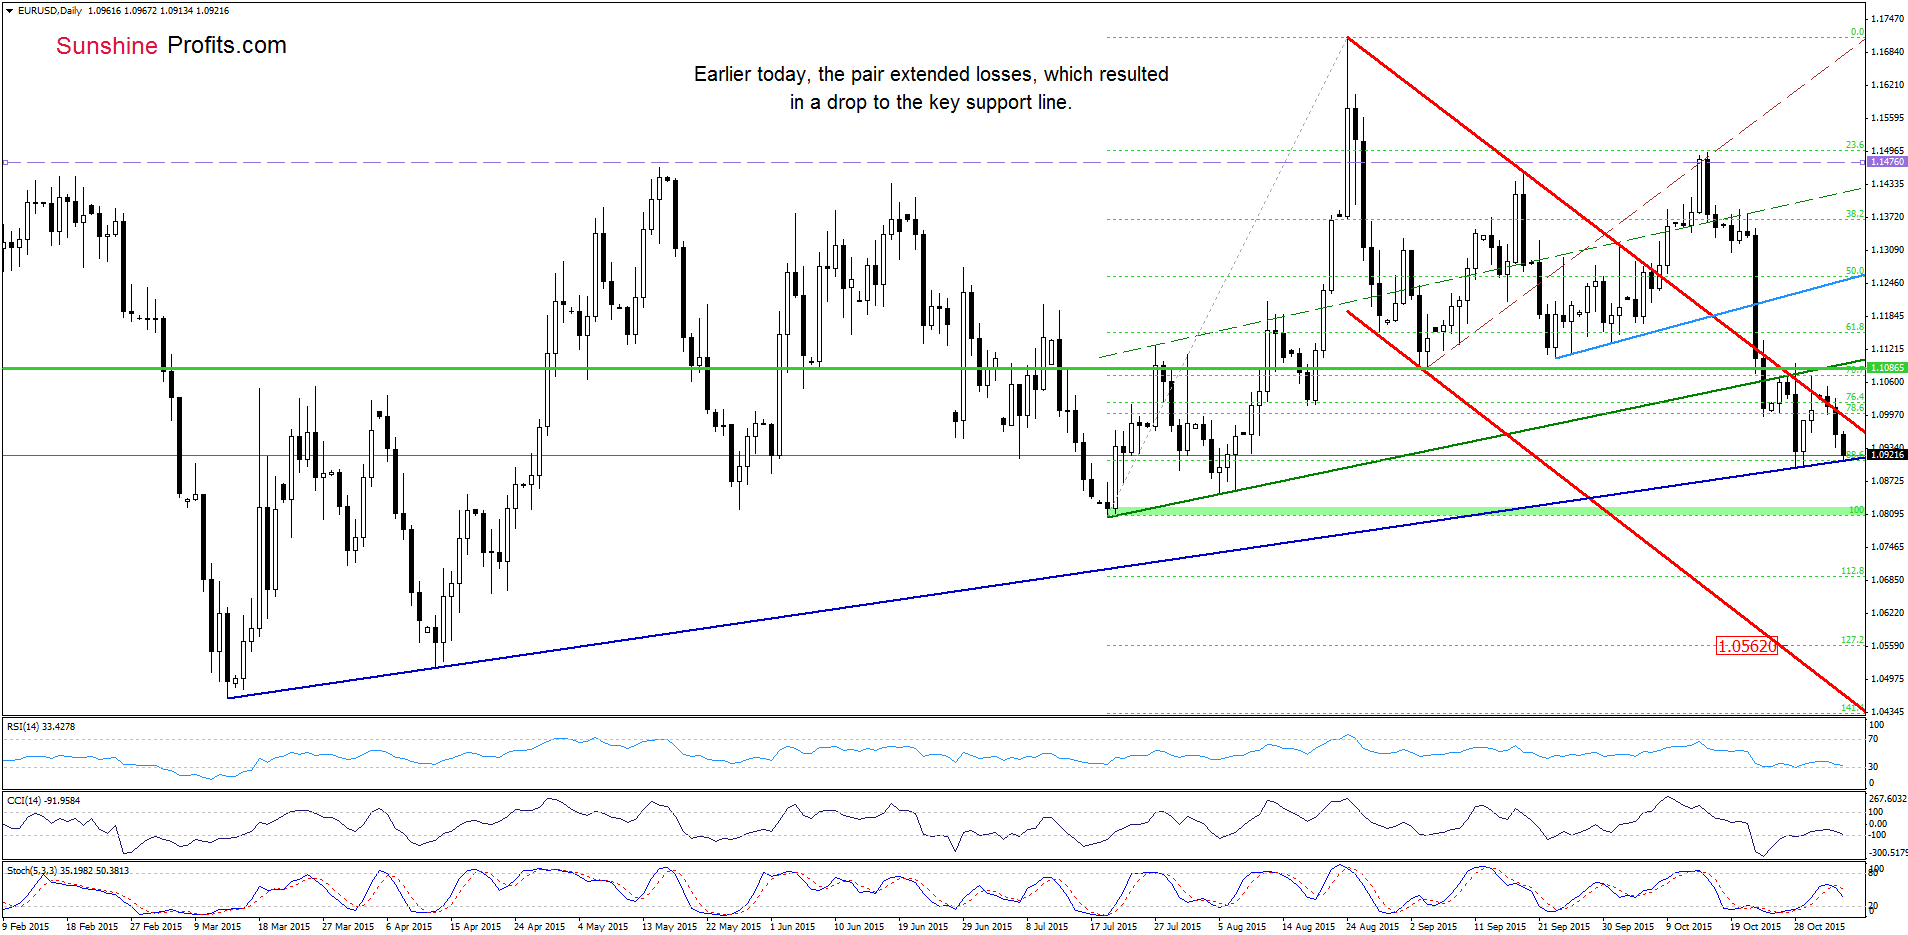
(…) EUR/USD extended losses below the upper border of the red declining trend channel. This means that the exchange rate will move lower from here and re-test the strength of the navy blue support line in the coming days (currently around 1.0912).
As you see on the daily chart, the situation developed in line with the above scenario and the exchange rate reached our yesterday’s target. Although the pair could rebound from here (similarly to what we saw at the end of Oct), a sell signal generated by the daily indicator in combination with the fact the pair verified earlier breakdown below the medium-term support/resistance line (marked with red on the weekly chart) suggests that currency bears will try to push the pair lower. If they succeed, and EUR/USD declines below the above-mentioned key support line, it would be a strong negative signal, which will trigger a drop to the green support zone based on Jul lows (around 1.0808-1.0821) in the coming days.
Very short-term outlook: bearish
Short-term outlook: bearish
MT outlook: mixed with bearish bias
LT outlook: mixed
Trading position (short-term; our opinion): Short positions (which are profitable) with a stop-loss order at 1.1476 are justified from the risk/reward perspective. We will keep you informed should anything change, or should we see a confirmation/invalidation of the above.
GBP/USD
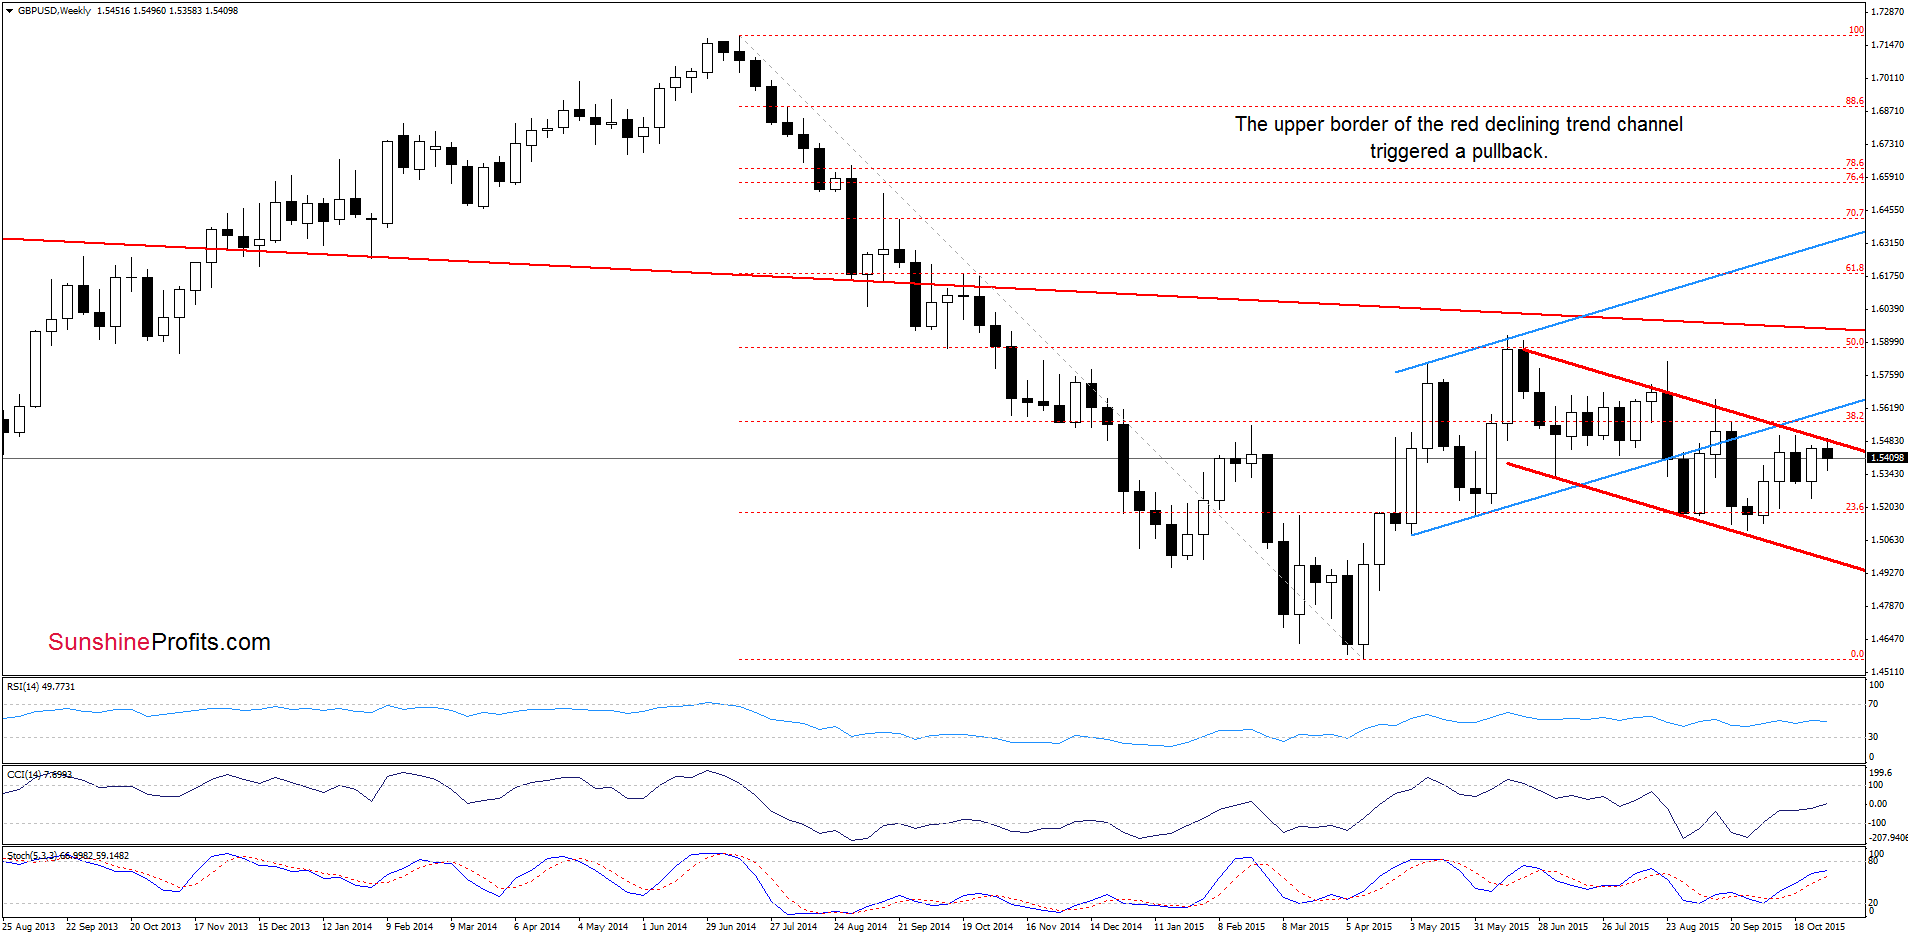
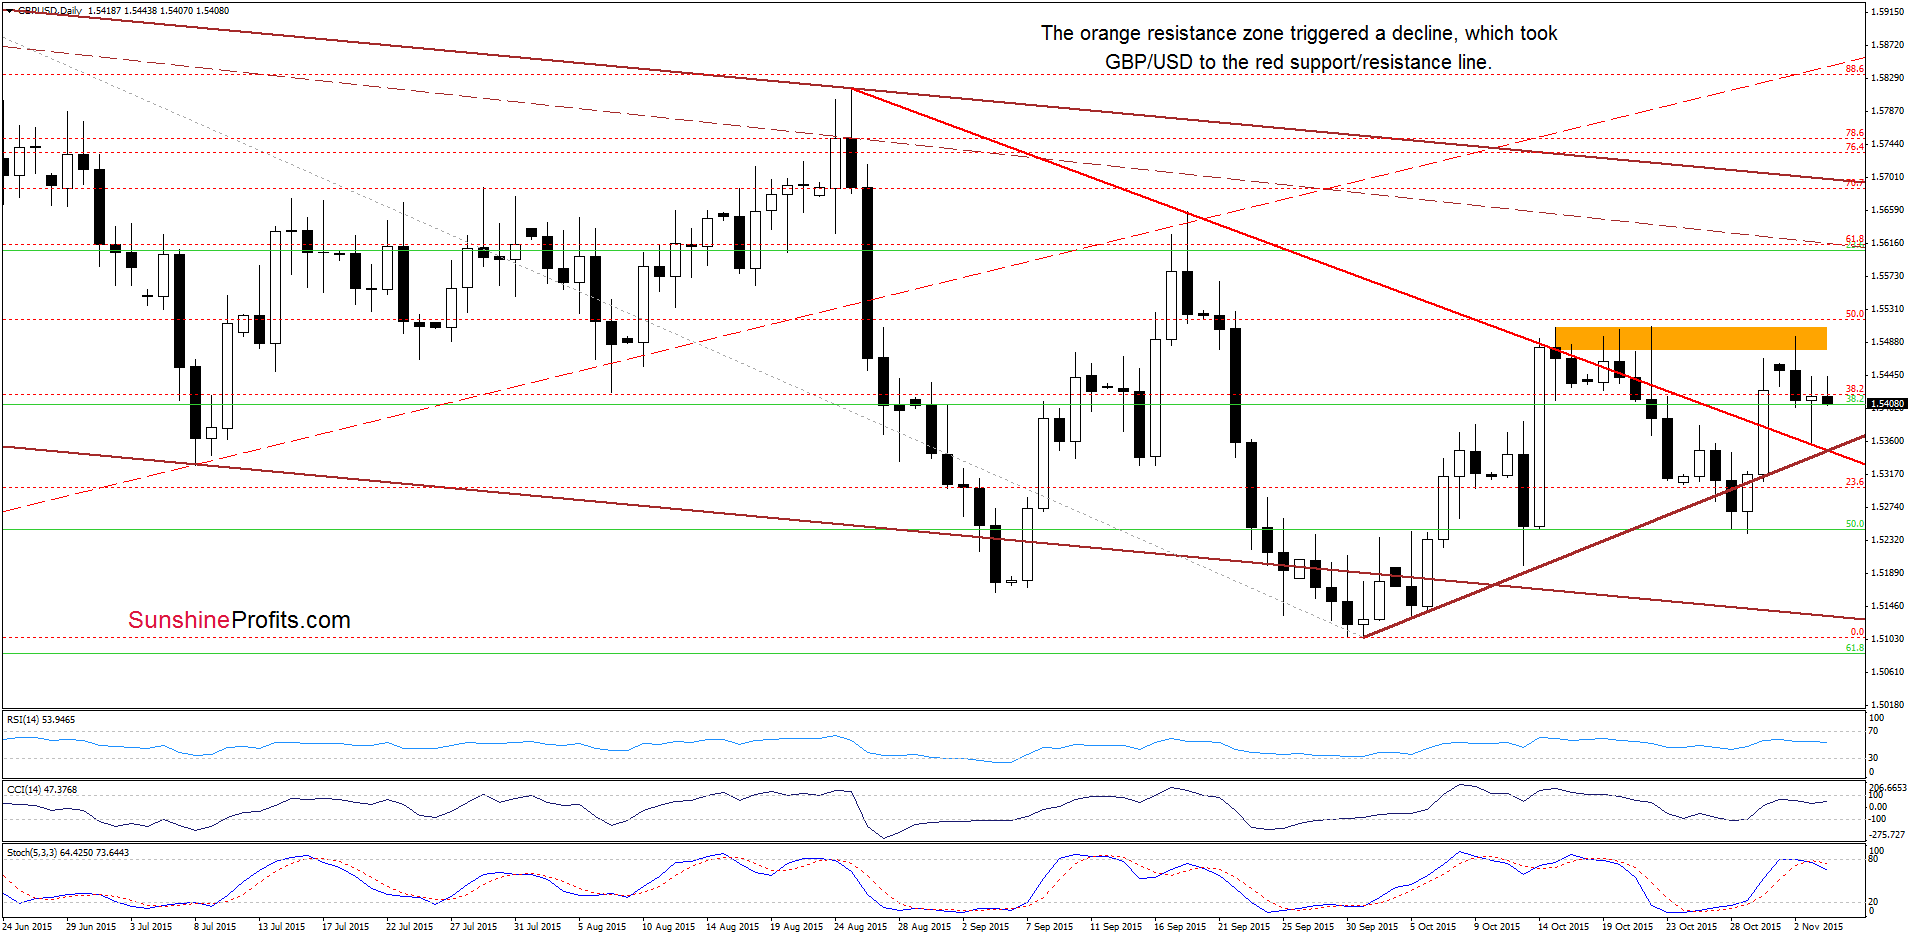
Looking at the charts, we see that the orange resistance zone (marked on the daily chart) in combination with the upper border of the declining red trend channel (seen on the weekly chart) triggered a decline, which took the pair to the previously-broken red support/resistance line. Although GBP/USD rebounded yesterday, the proximity to the key resistance area and a sell signal generated by the Stochastic Oscillator suggest that another pullback and a re-test of the red line is more likely than not.
Very short-term outlook: mixed
Short-term outlook: mixed
MT outlook: mixed
LT outlook: mixed
Trading position (short-term; our opinion): No positions are justified from the risk/reward perspective at the moment. We will keep you informed should anything change, or should we see a confirmation/invalidation of the above.
AUD/USD
The medium-term picture hasn’t changed much as AUD/USD is trading in the green support zone. Today, we’ll focus on the very short-term changes.
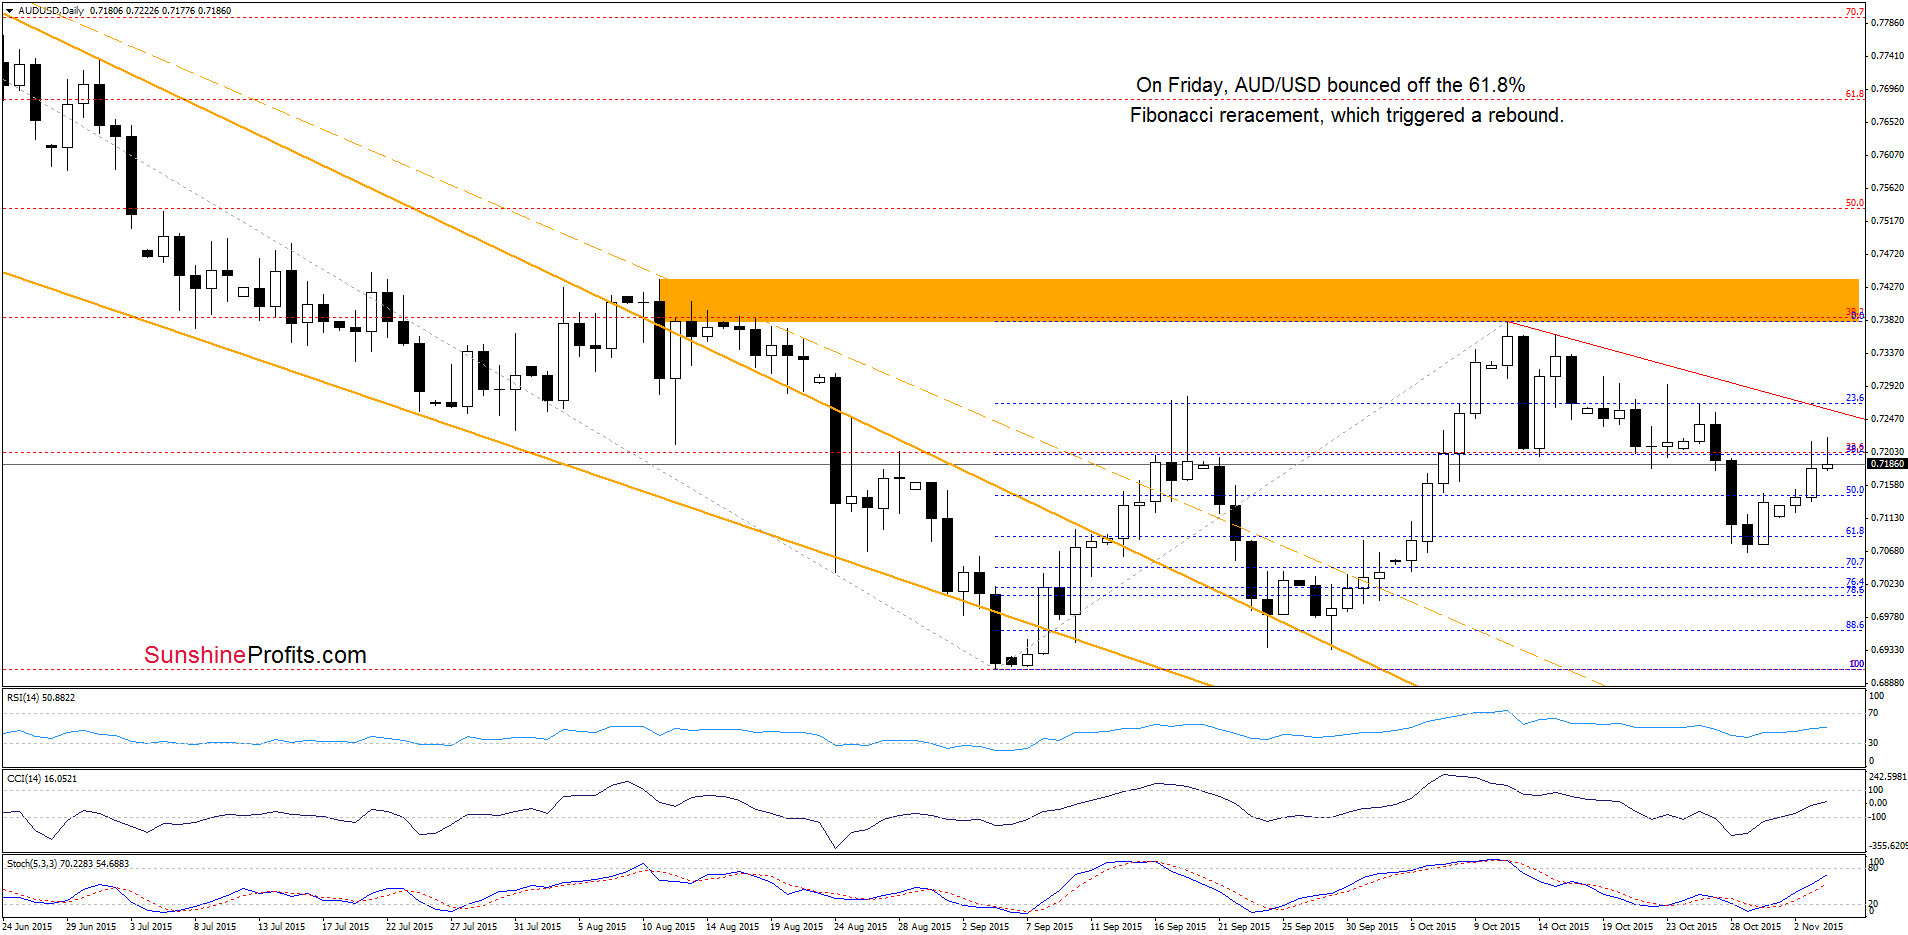
From today’s point of view e see that AUD/USD bounced off the 61.8% Fibonacci retracement, which triggered a rebound in recent days. Additionally, the CCI and Stochastic Oscillator generated buy signals, which suggests that the pair will test the red resistance line (based on the previous highs) in the coming day(s).
Very short-term outlook: mixed with bullish bias
Short-term outlook: mixed
MT outlook: mixed
LT outlook: mixed
Trading position (short-term; our opinion): No positions are justified from the risk/reward perspective at the moment. We will keep you informed should anything change, or should we see a confirmation/invalidation of the above.
Thank you.
Nadia Simmons
Forex & Oil Trading Strategist
Przemyslaw Radomski, CFA
Founder, Editor-in-chief
Gold & Silver Trading Alerts
Forex Trading Alerts
Oil Investment Updates
Oil Trading Alerts

