

Although the Department of Labor showed a larger-than-expected drop in jobless claims in the week ending October 3, yesterday’s minutes from the U.S. Federal Reserve's Sept meeting weakened the greenback, pushing the USD Index to its lowest level since Sept 21. Earlier today, the U.S. currency extended losses and dropped under the level of 95. What impact did this decrease have on the short-term picture of our currency pairs?
In our opinion the following forex trading positions are justified - summary:
- EUR/USD: short (a stop-loss order at 1.1887; the downside target around 1.0938)
- GBP/USD: none
- USD/JPY: none
- USD/CAD: none
- USD/CHF: none
- AUD/USD: none
EUR/USD
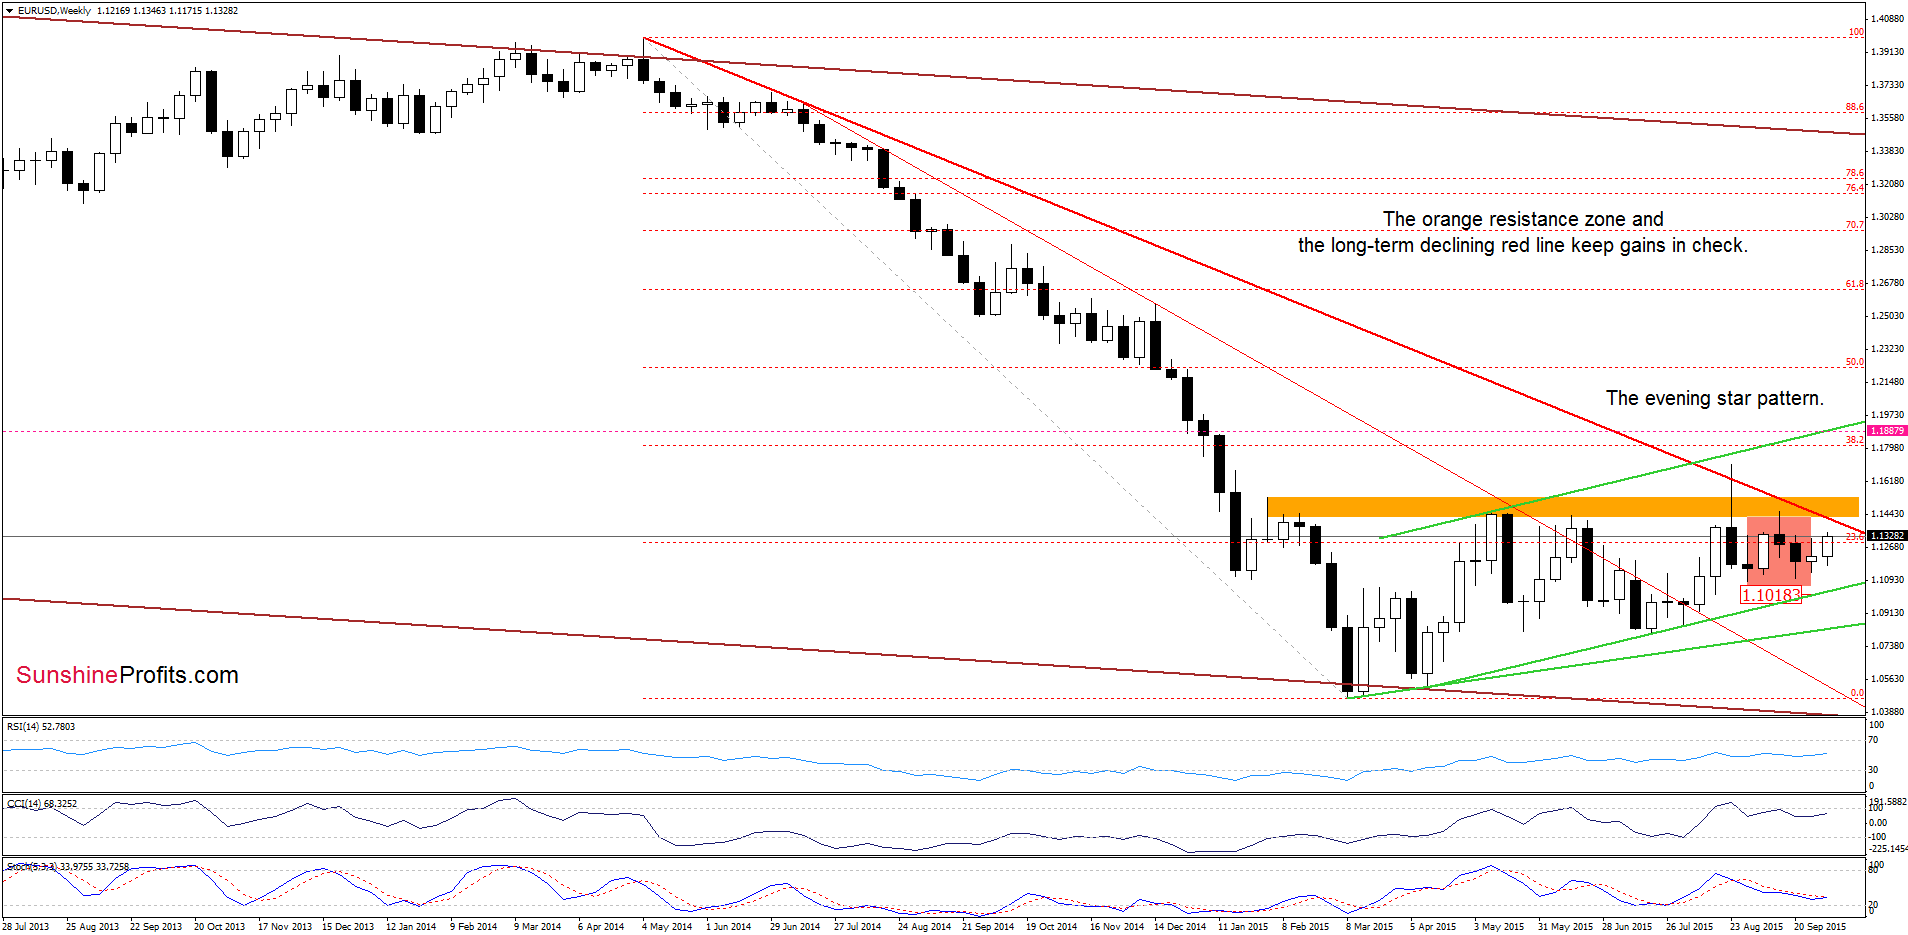
The overall situation in the medium term remains almost unchanged as EUR/USD is still trading under the long-term red declining resistance line and the orange resistance zone (reinforced by the bearish evening pattern), which together continue to keep gains in check.
What can we infer from the daily chart? Let’s check.
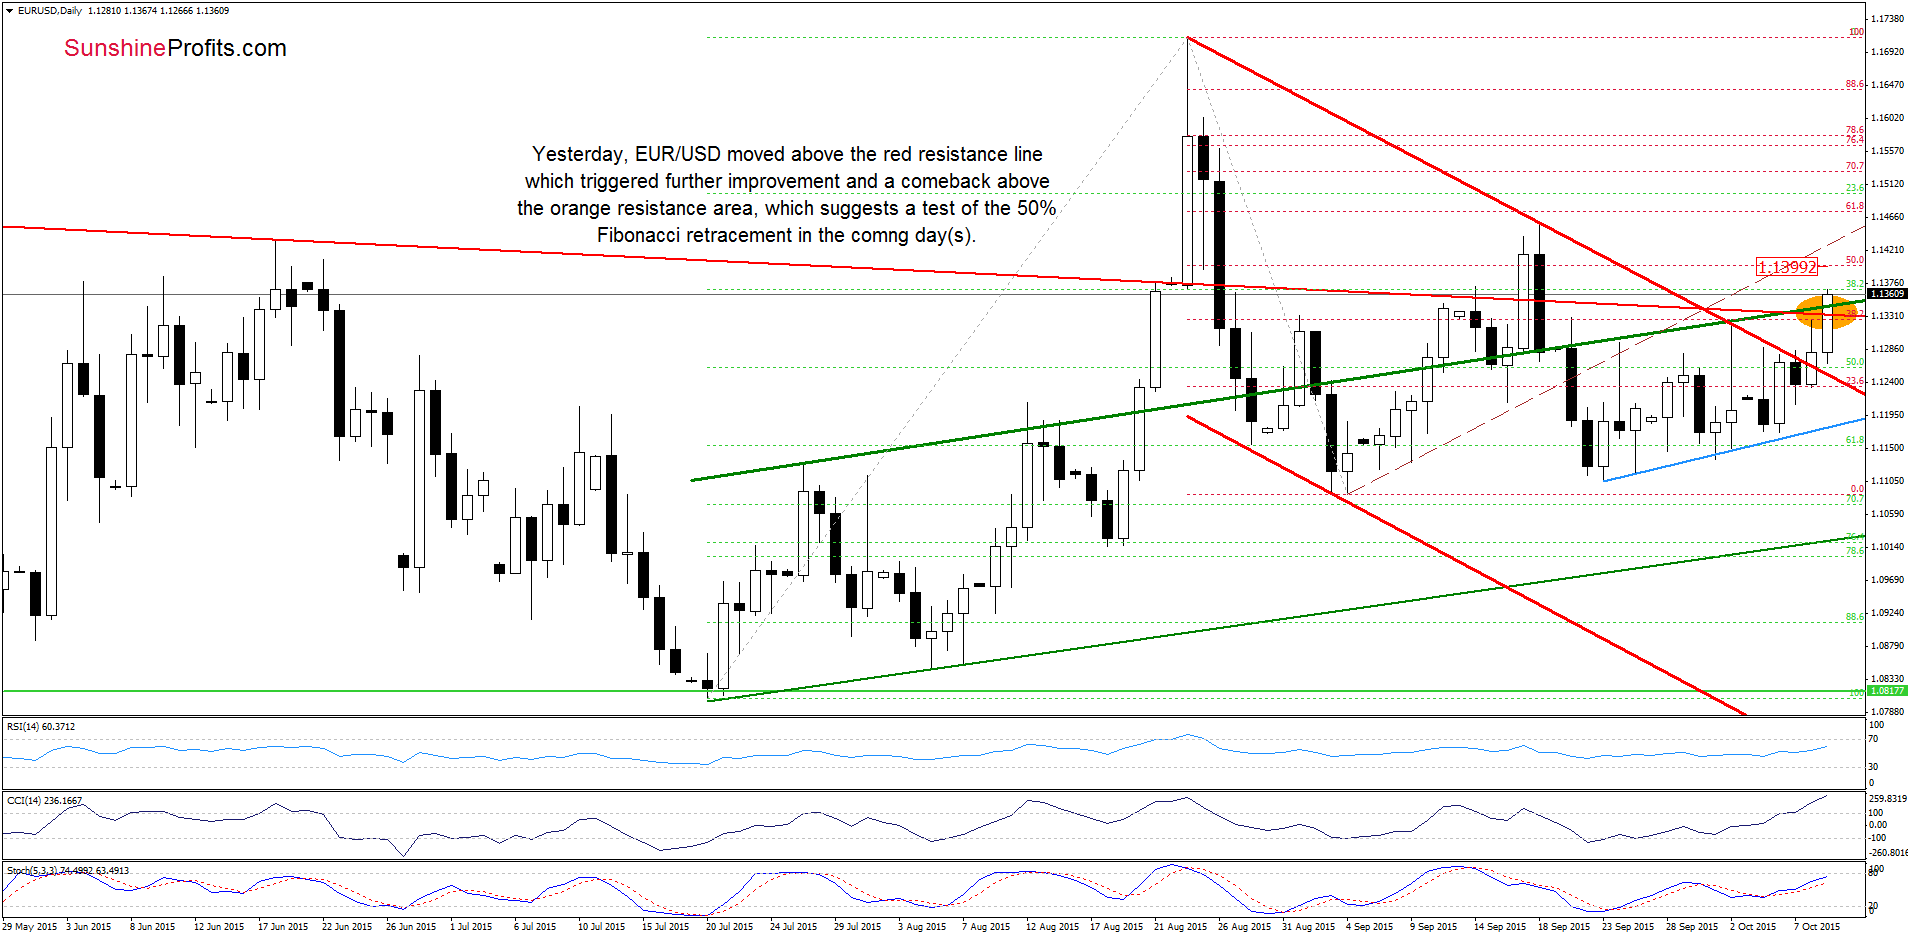
Yesterday, EUR/USD moved above the upper border of the red declining trend channel, which triggered further improvement and a comeback above the orange resistance zone (an unconfirmed breakut), which suggests a test of the barrier of 1.400, where the 50% Fibonacci retracement is. Nevertheless, the current position of the indicators in combination with the medium-term picture suggests that the space for further gains is limited.
Very short-term outlook: bearish
Short-term outlook: bearish
MT outlook: mixed with bearish bias
LT outlook: mixed
Trading position (short-term; our opinion): Short positions with a stop-loss order at 1.1887 are justified from the risk/reward perspective. We will keep you informed should anything change, or should we see a confirmation/invalidation of the above.
GBP/USD
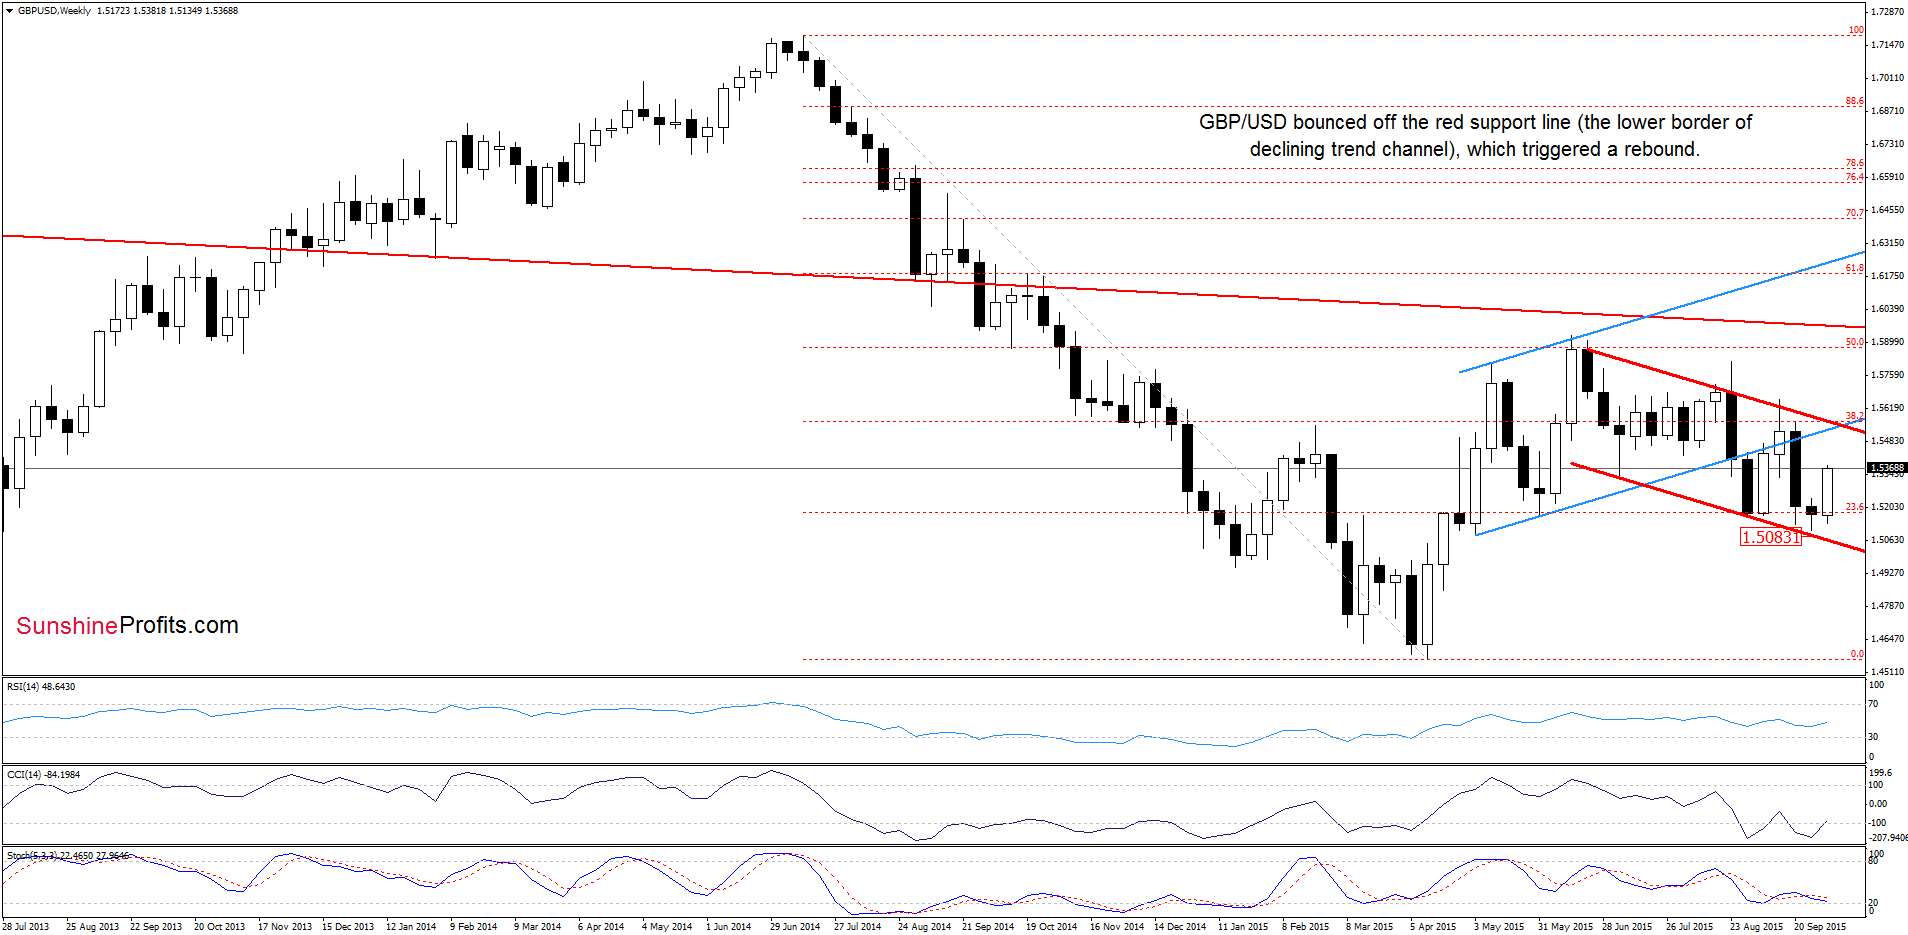
Quoting our last commentaryon this currency pair:
(…) the pair invalidated earlier breakdown, which was a positive signal that triggered further improvement earlier today. With this upswing, GBP/USD approached the orange resistance zone and the 38.2% Fibonacci retracement level (…) Nevertheless, as long as there are no sell signals, an attempt to move higher is likely. Therefore, if we see a breakout above this resistance area, the initial upside target for currency bulls would be around 1.5381, where the 50% Fibonacci retracement is.
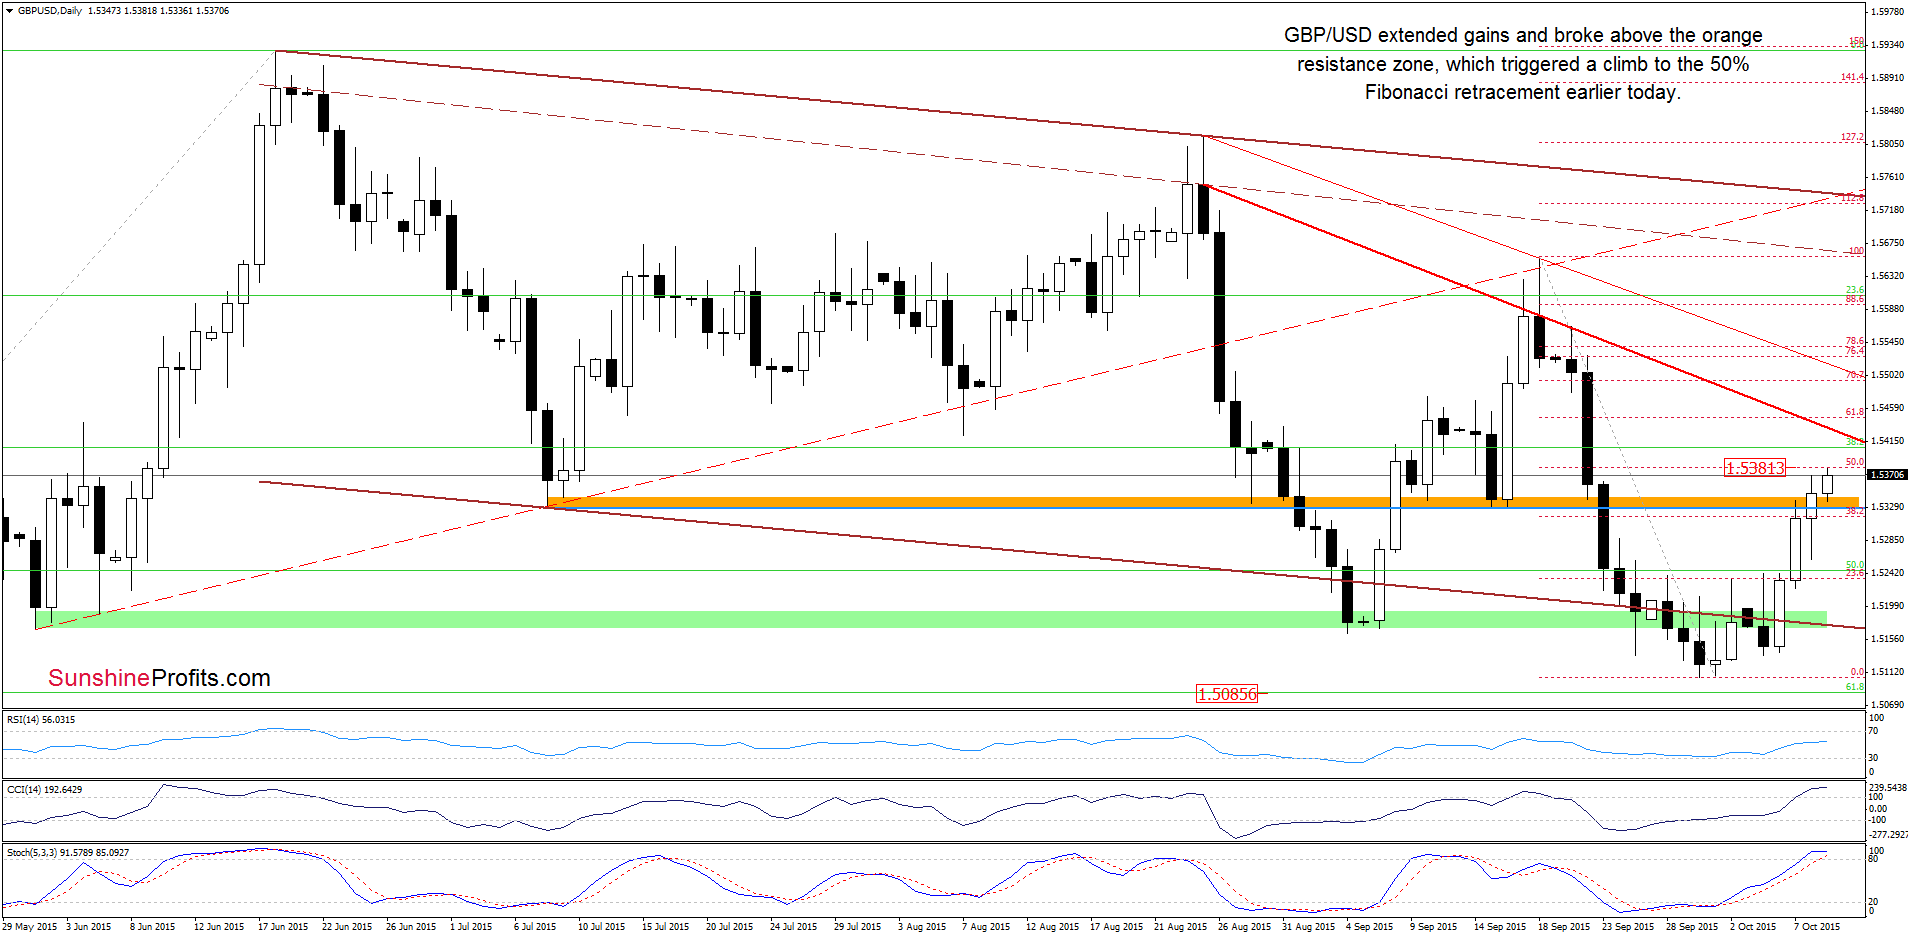
As you see on the daily chart, the situation developed in line with the above scenario and GBP/USD reached our upside target. Taking this resistance level into account and the current position of the indicators (they are very lose to generating sell signals), we think that reversal is just around the corner. Nevertheless, a pullback from here will be more likely if we see an invalidation of the breakout above the orange zone.
Very short-term outlook: mixed
Short-term outlook: mixed
MT outlook: mixed
LT outlook: mixed
Trading position (short-term; our opinion): No positions are justified from the risk/reward perspective at the moment. We will keep you informed should anything change, or should we see a confirmation/invalidation of the above.
USD/JPY
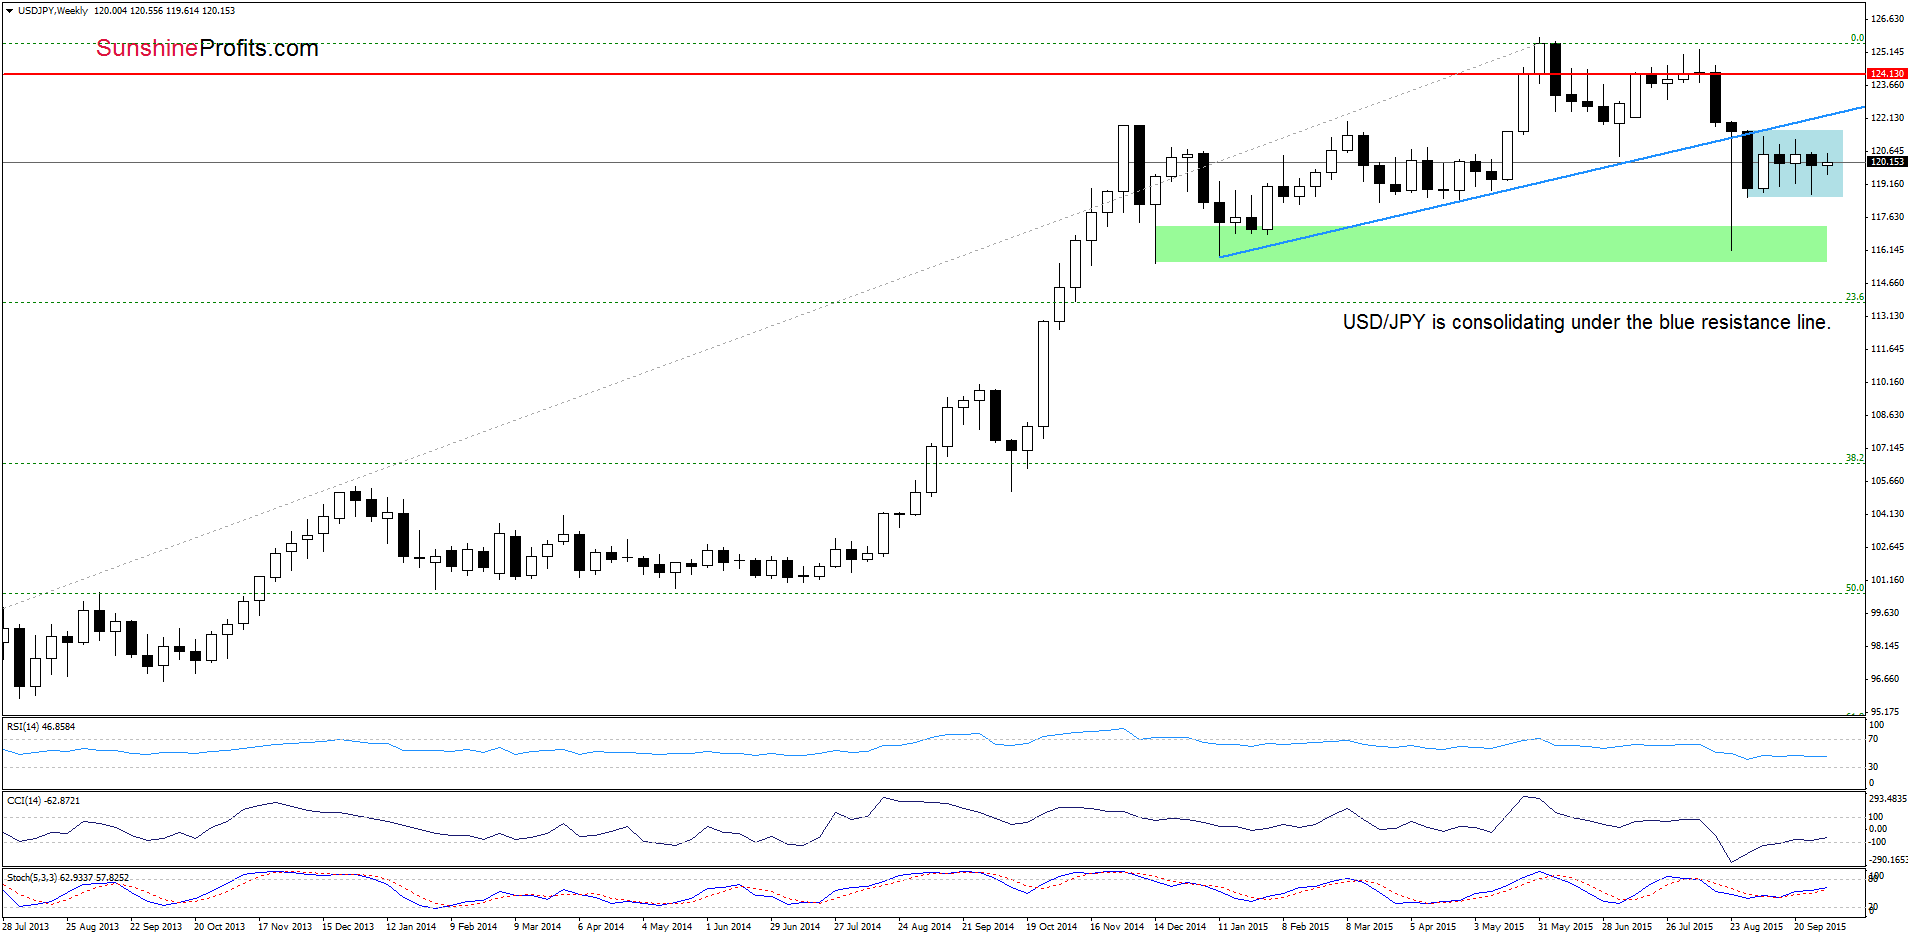
The medium-term picture hasn’t changed much as the exchange rate is still trading in the consolidation under the blue resistance line. Will the daily chart give us more clues about future moves? Let’s check.
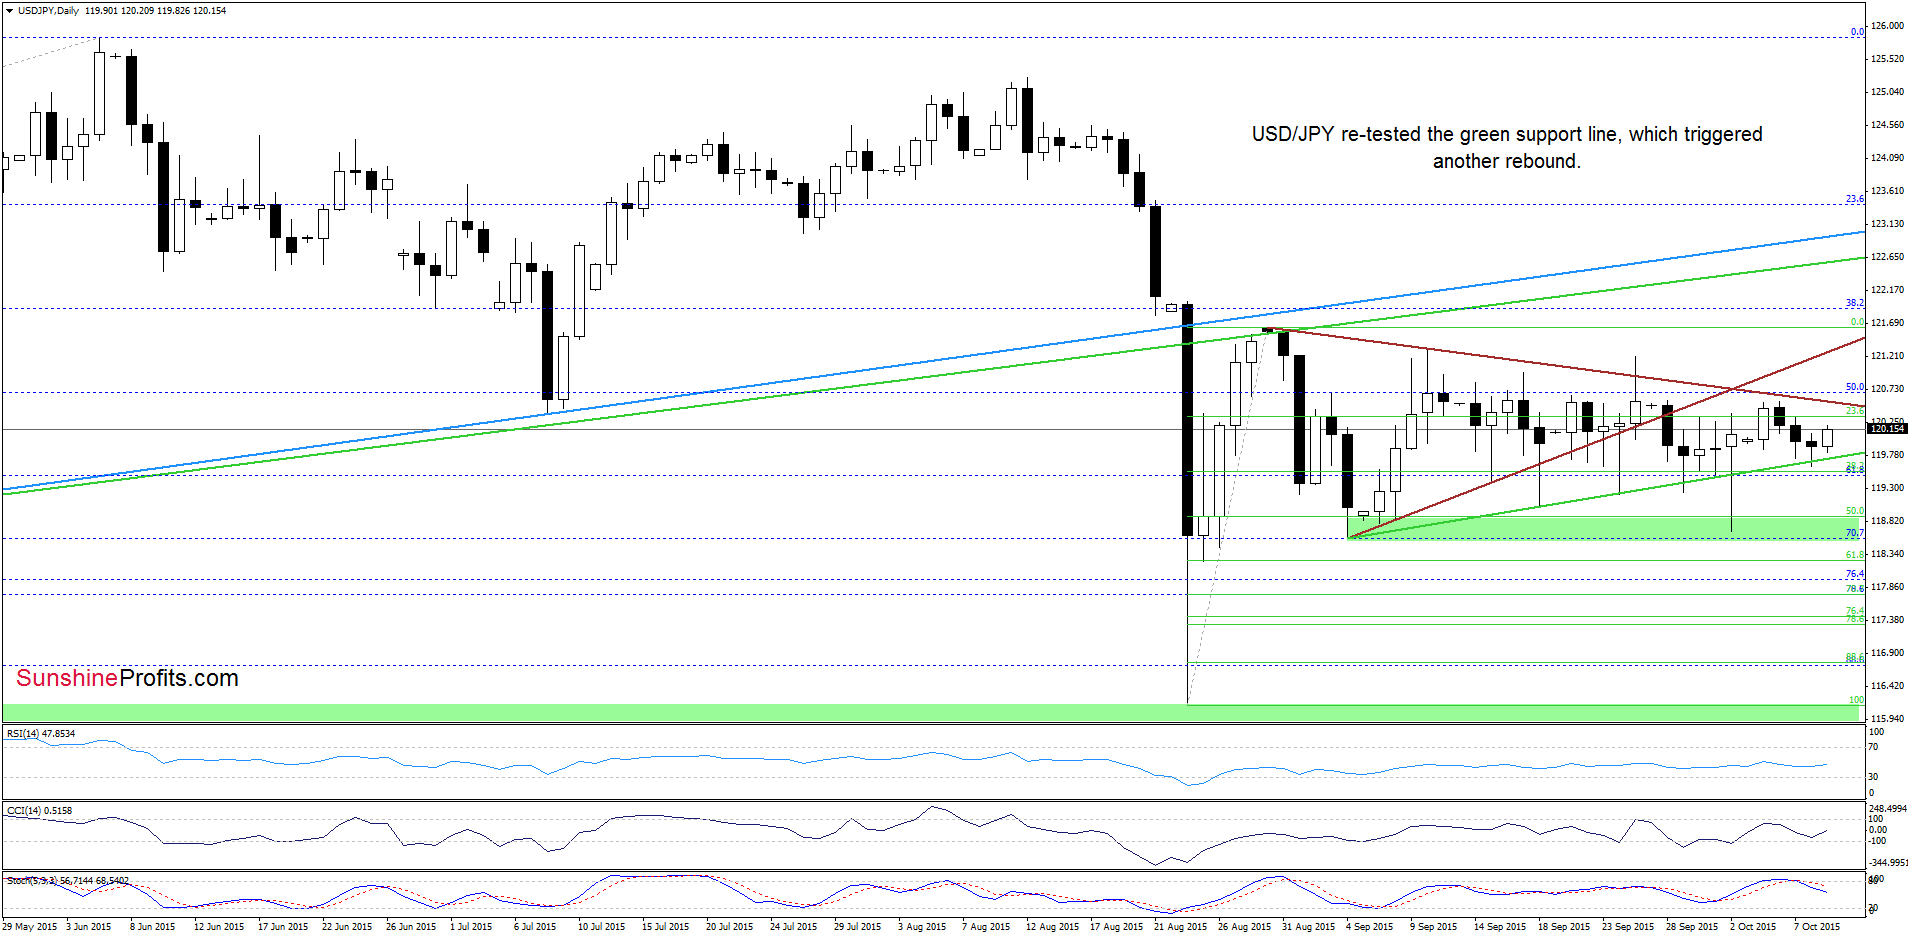
Looking at the daily chart from today’s point of view, we see that currency bulls bounced off the green support line once again, which means that our last commentary on this currency pair is up-to-date:
(…) we think that as long as there is no successful breakout above brown resistance lines or a breakdown below the green line, another sizable move is not likely to be seen and short-lived moves in both directions should not surprise us.
Very short-term outlook: mixed
Short-term outlook: mixed
MT outlook: mixed
LT outlook: mixed
Trading position (short-term; our opinion): No positions are justified from the risk/reward perspective at the moment. We will keep you informed should anything change, or should we see a confirmation/invalidation of the above.
USD/CAD
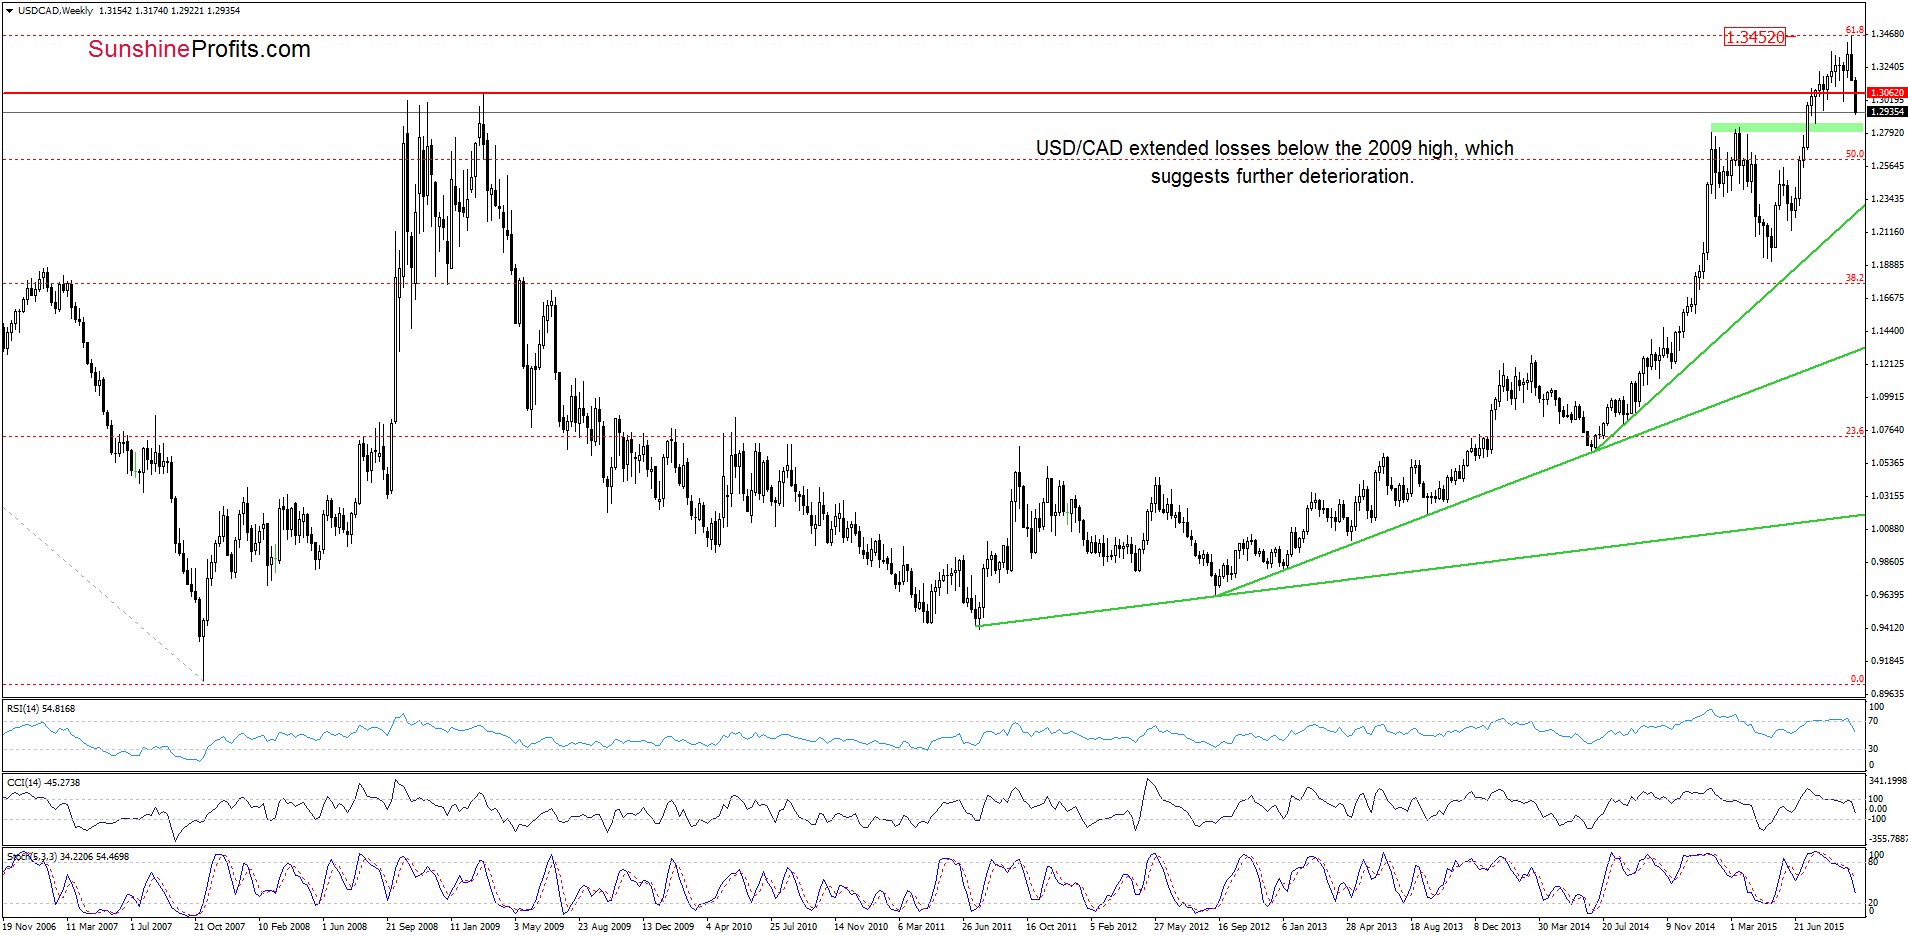
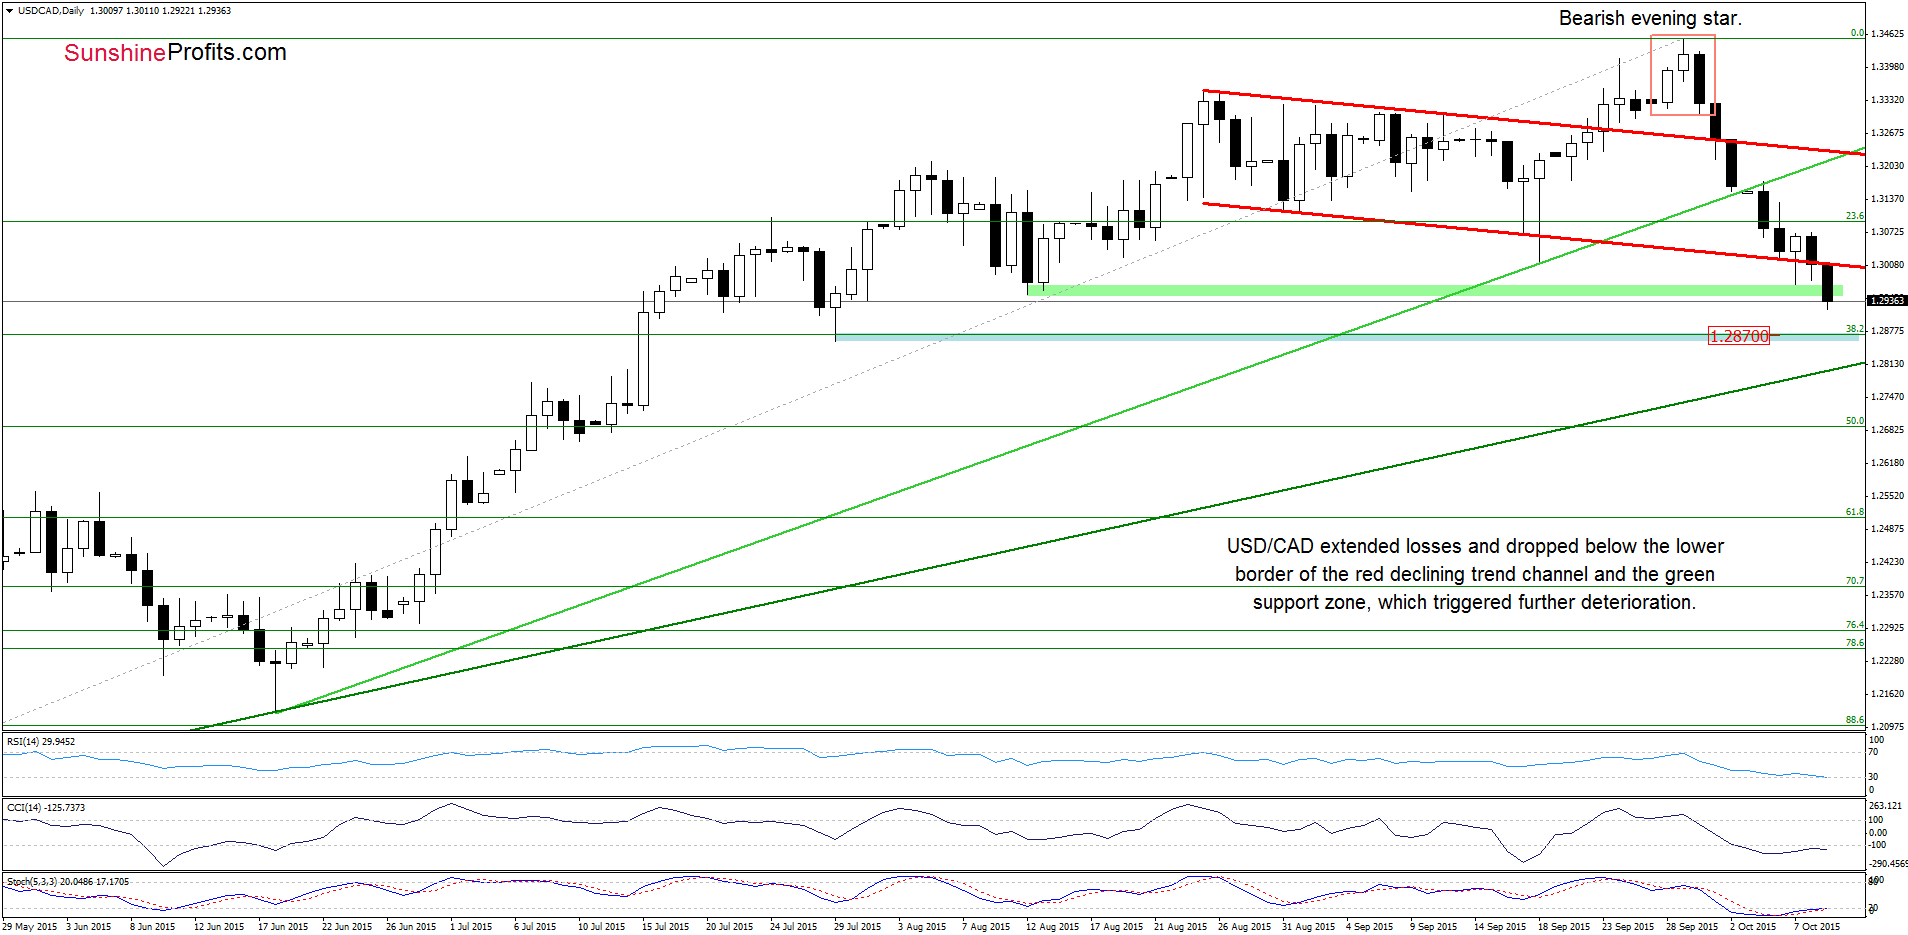
As you see on the charts, the overall situation has deteriorated as USD/CAD extended losses and dropped below the lower border of the red declining trend channel and the green support zone. With this downswing, the exchange rate also invalidated the breakout above the 2009 high, which together suggests further deterioration. How low could the pair go in the coming days? In our opinion, the initial downside target for currency bears would be around 1.2870, where the 38.2% Fibonacci retracement is. If this support is broken, we’ll see a drop to around 1.2800-1.2833, where the Jan and Mar highs are (a green zone marked on the weekly chart).
Very short-term outlook: mixed with bearish bias
Short-term outlook: mixed
MT outlook: mixed
LT outlook: mixed
Trading position (short-term; our opinion): No positions are justified from the risk/reward perspective at the moment. We will keep you informed should anything change, or should we see a confirmation/invalidation of the above.
USD/CHF
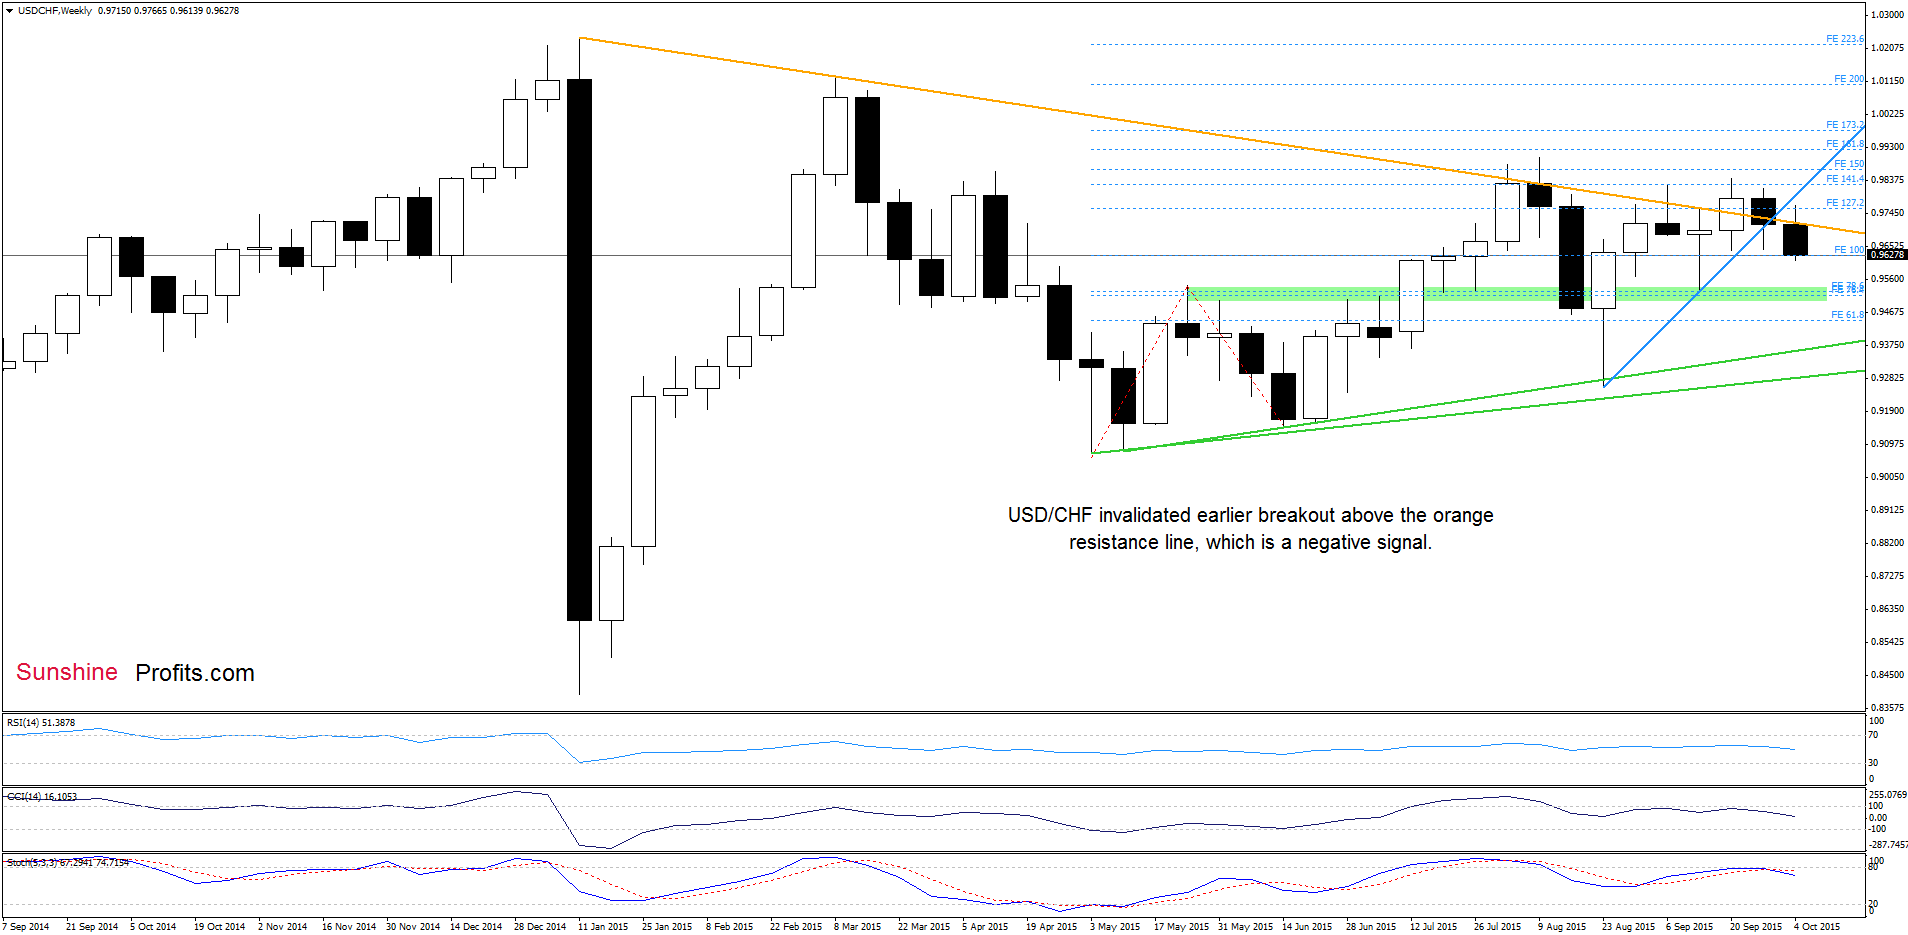
The first thing that catches the eye on the weekly chart is an invalidation of the breakout above the orange support/resistance line. This is a negative signal, which will turn into bearish if we see a weekly close under this line.
Are there any short-term factors that could encourage currency bulls to act? Let’s check.
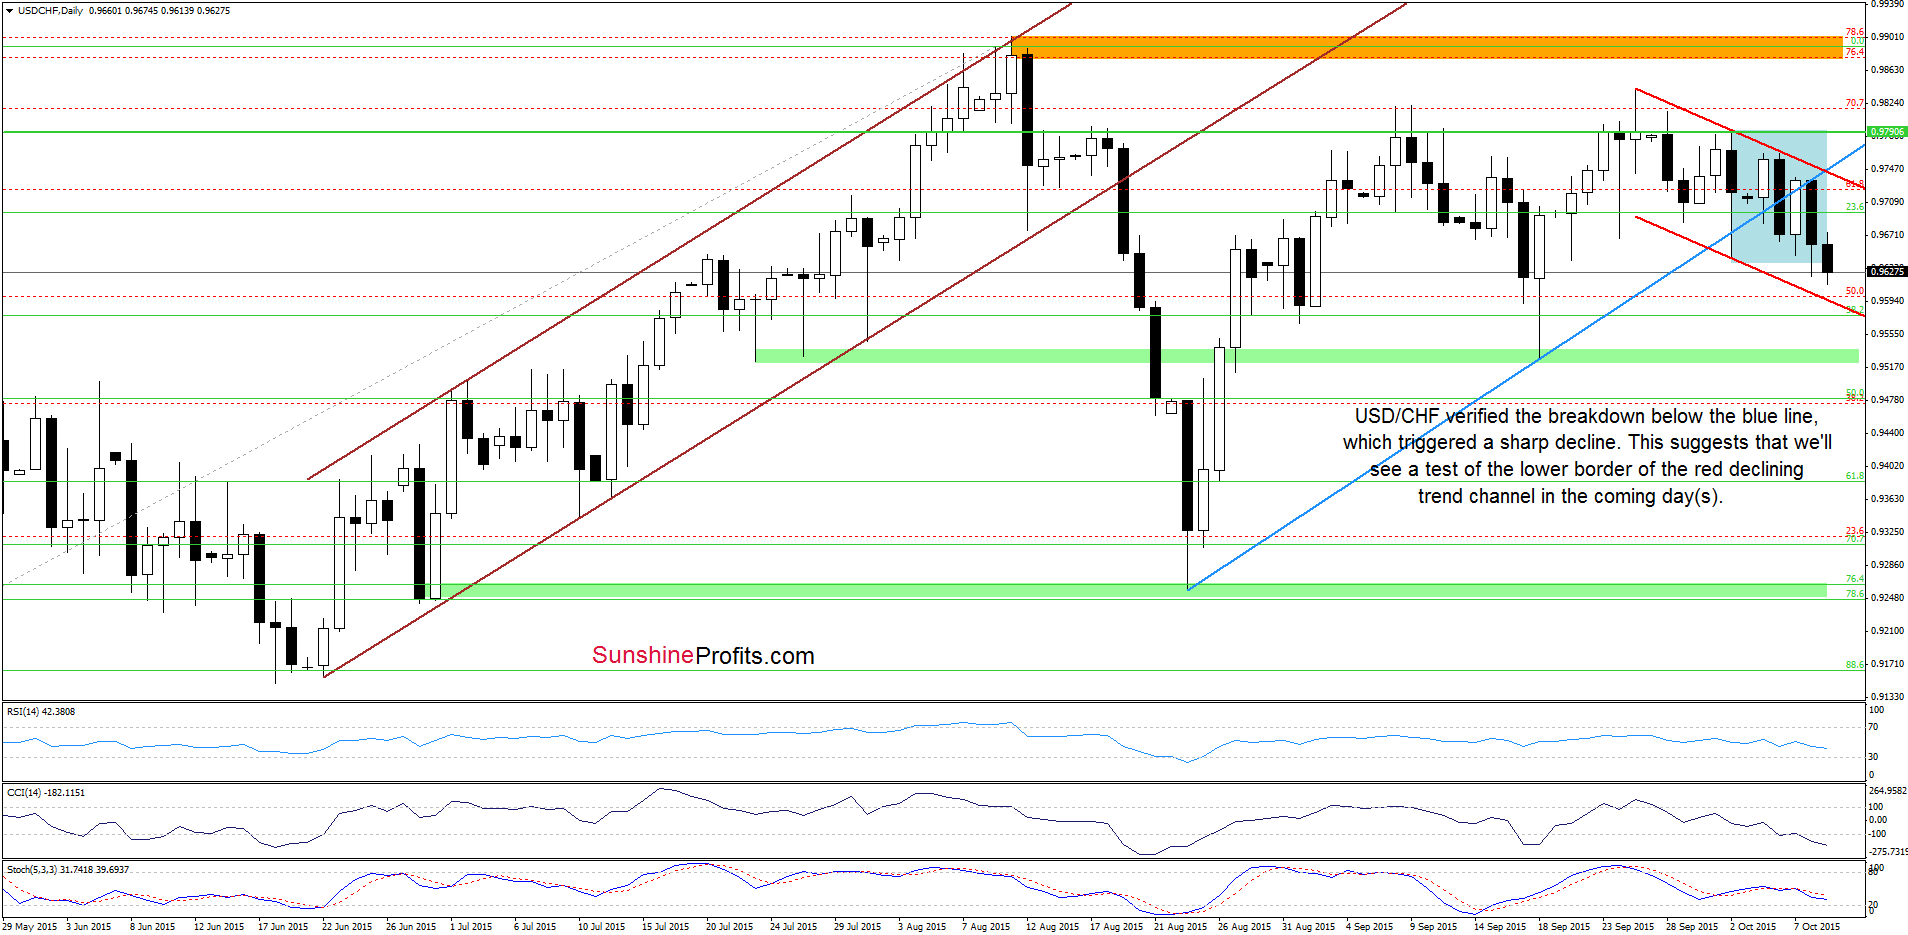
Looking at the daily chart, we see that USD/CHF verified the breakdown below the blue line, which resulted in a sharp decline yesterday. This negative sign triggered further deterioration earlier today which suggests a test of the lower border of the red declining trend channel. If this support withstands the selling pressure we’ll likely see a rebound to the upper line of the formation in the coming week. However if it is broken, the next downside target for currency bears would be around the Sept lows.
Very short-term outlook: mixed with bearish bias
Short-term outlook: mixed
MT outlook: mixed
LT outlook: mixed
Trading position (short-term; our opinion): No positions are justified from the risk/reward perspective at the moment. We will keep you informed should anything change, or should we see a confirmation/invalidation of the above.
AUD/USD
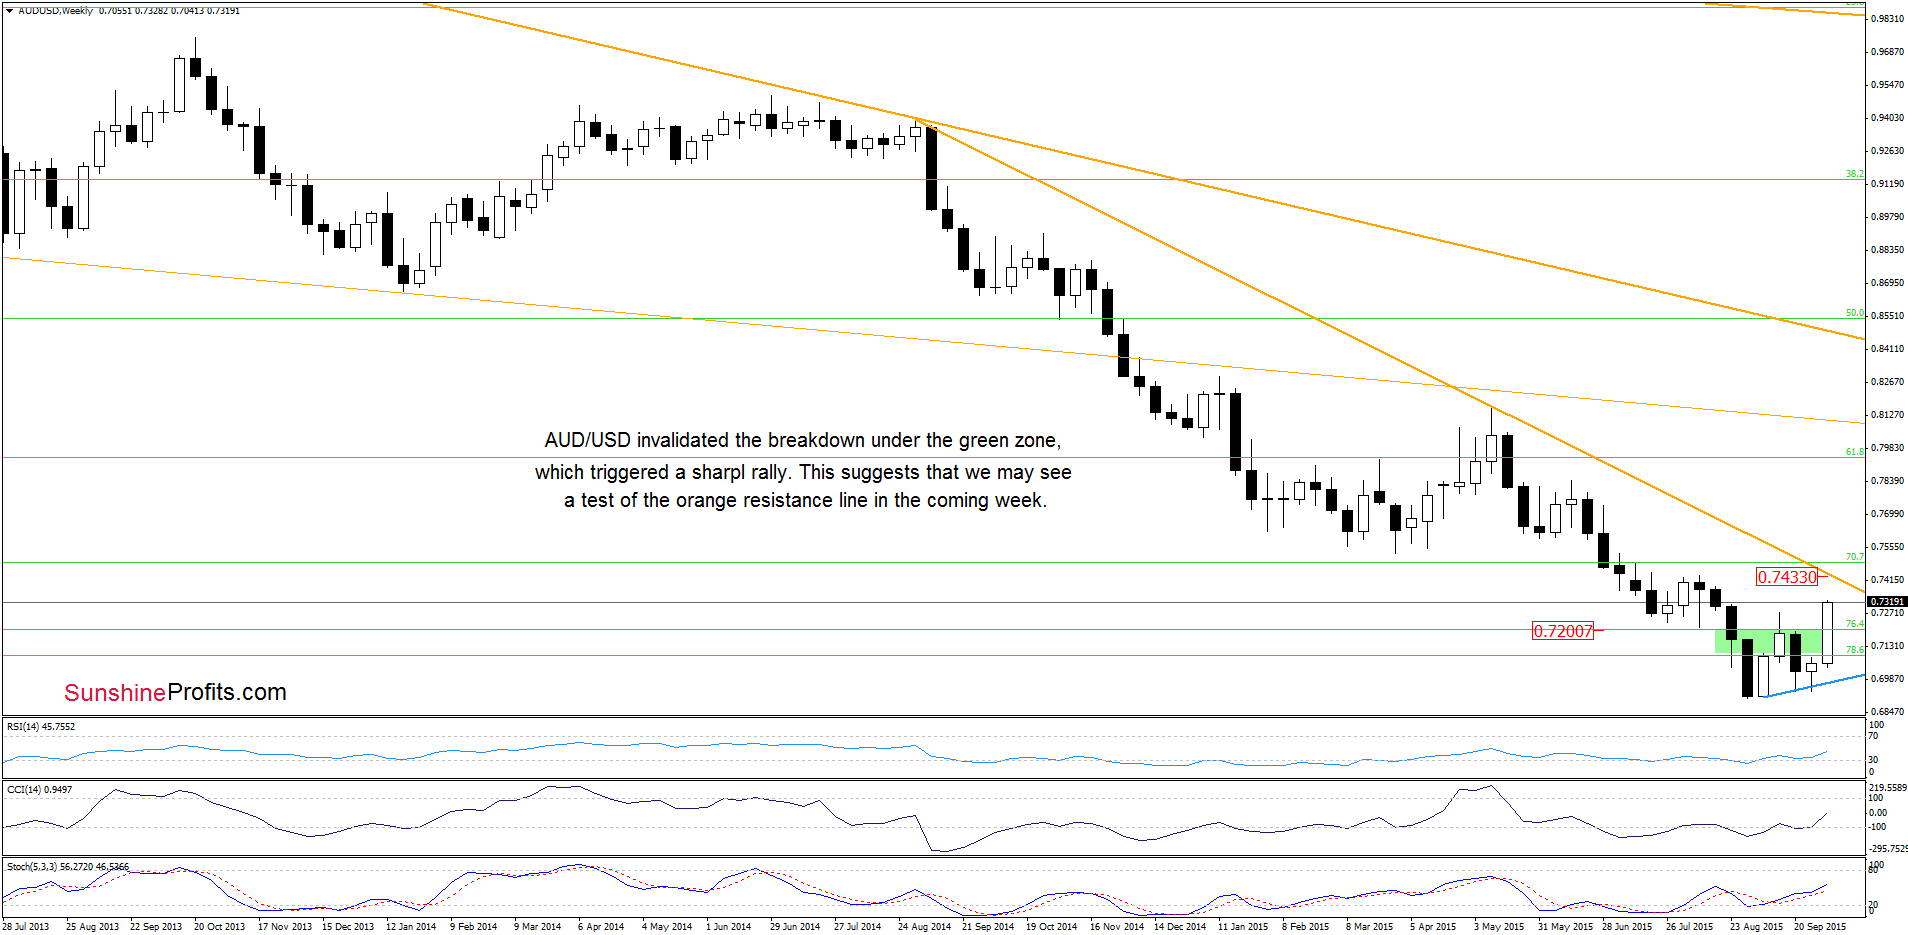
The situation in the medium-term has improved significantly as AUD/USD extended gains and climbed above the upper border of the previously-broken green zone, invalidating earlier breakdown. This is a positive signal that suggests further improvement and a test of the medium-term orange declining resistance line (currently around 0.7433) in the coming week.
What impact did this improvement have on the daily chart? Let’s take a closer look at the chart below and find out.
In our previous commentary on this currency pair, we wrote the following:
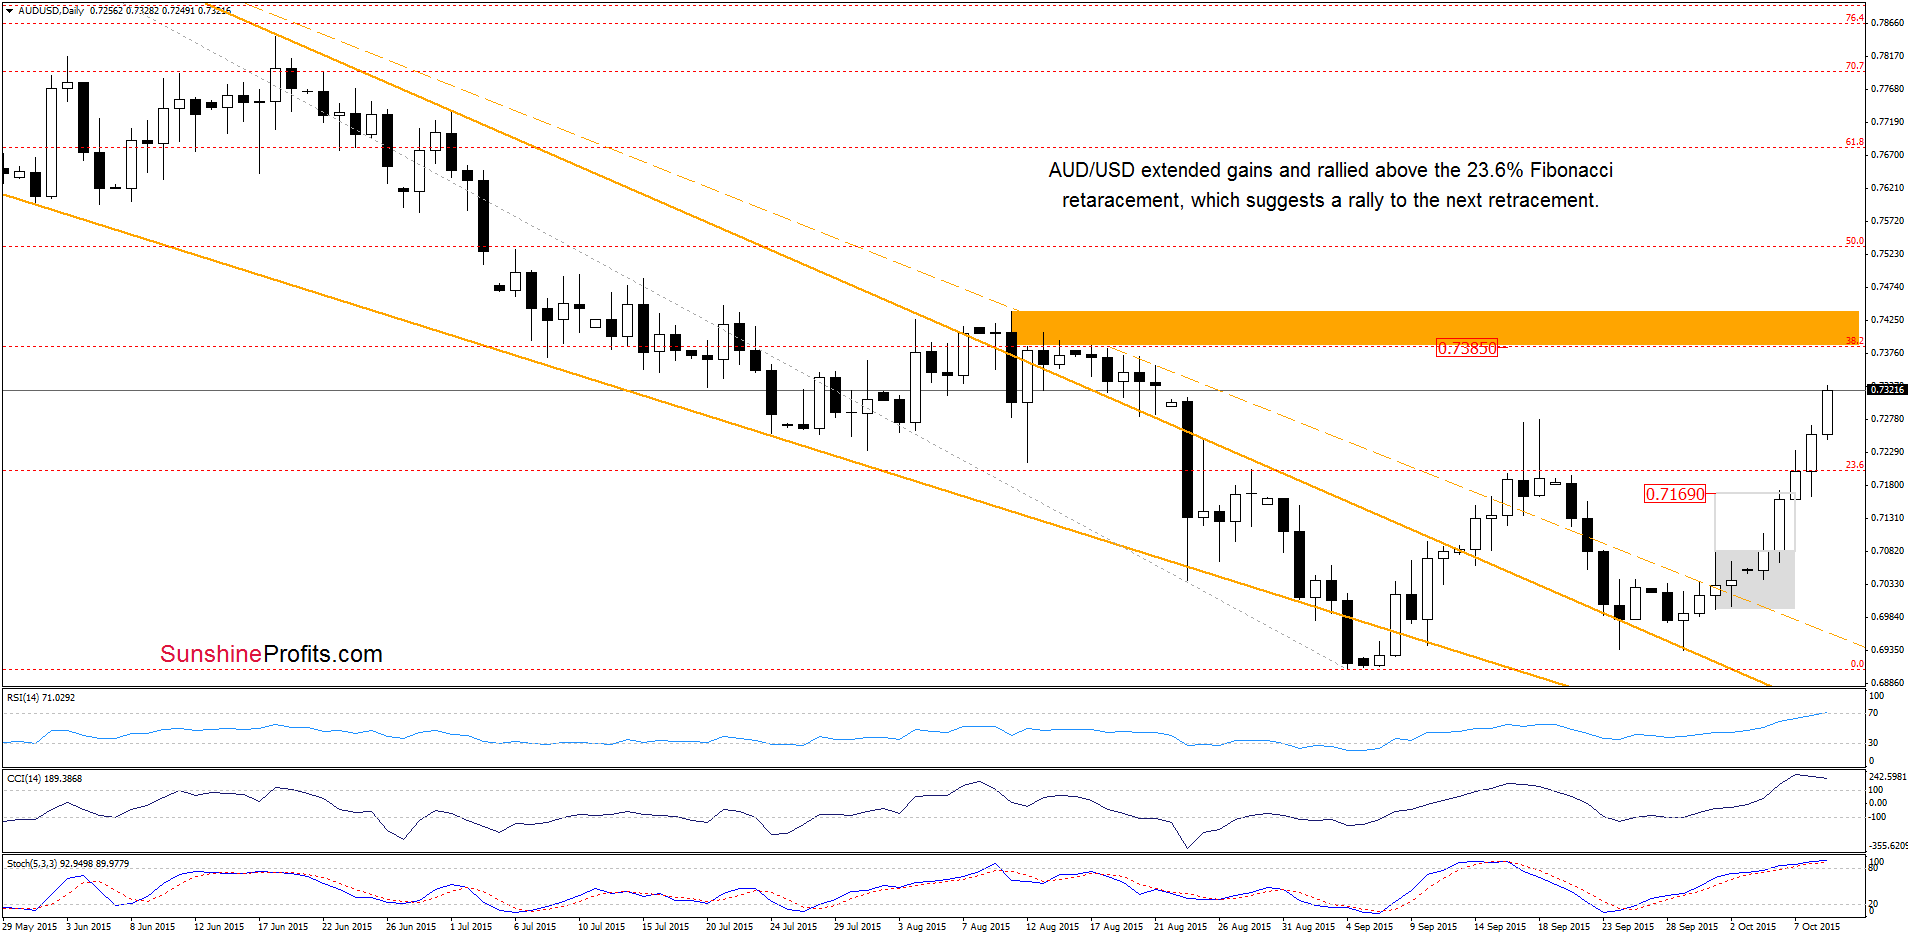
(…) currency bulls took the exchange rate (…) to the 23.6% Fibonacci retracement. This is a positive signal, which suggests that if we see a daily closure above this resistance, the pair may test the Sep highs in the near future.
From today’s point of view we see that the situation developed in line with the above scenario and AUD/USD not only climbed to the Sep high, but also broke above it earlier today. This is a bullish signal, which suggests an increase to around 0.7385-0.7438, where the orange resistance zone (created by the 38.2% Fibonacci retracement and the Aug highs) is.
Very short-term outlook: bullish
Short-term outlook: mixed with bullish bias
MT outlook: mixed
LT outlook: mixed
Trading position (short-term; our opinion): No positions are justified from the risk/reward perspective at the moment. We will keep you informed should anything change, or should we see a confirmation/invalidation of the above.
Thank you.
Nadia Simmons
Forex & Oil Trading Strategist
Przemyslaw Radomski, CFA
Founder, Editor-in-chief
Gold & Silver Trading Alerts
Forex Trading Alerts
Oil Investment Updates
Oil Trading Alerts

