

Yesterday, European Central Bank President Mario Draghi said that it was too early decide whether or not to add stimulus measures, which supported the euro and pushed EUR/USD above 1.1200. Did this increase change anything in the medium-term picture of the exchange rate?
In our opinion the following forex trading positions are justified - summary:
- EUR/USD: short (a stop-loss order at 1.1887; the downside target around 1.0938)
- GBP/USD: none
- USD/JPY: none
- USD/CAD: none
- USD/CHF: none
- AUD/USD: none
EUR/USD
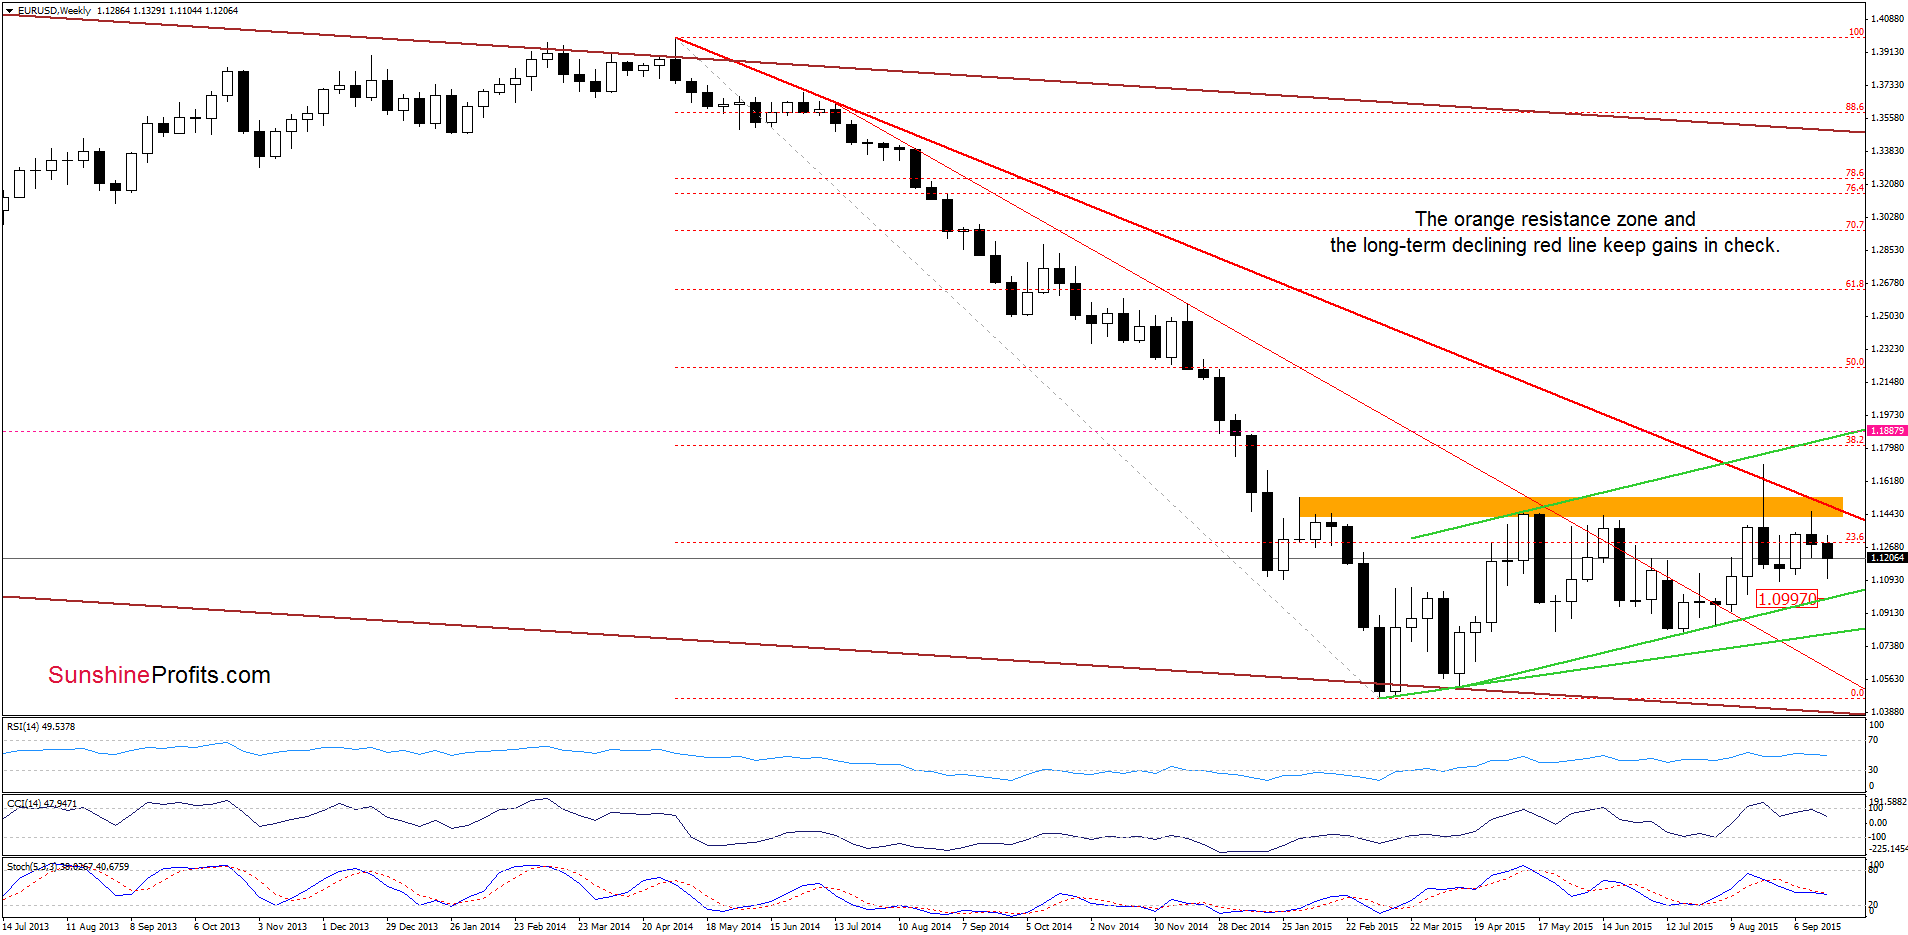
Although EUR/USD bounced off this week’s low of 1.1104, the exchange rate is still trading well below the long-term red resistance line and the orange resistance zone, which in combination with sell signals generated by the indicators suggests further deterioration.
Having said that, let’s examine the daily chart and find out what can we infer from it.
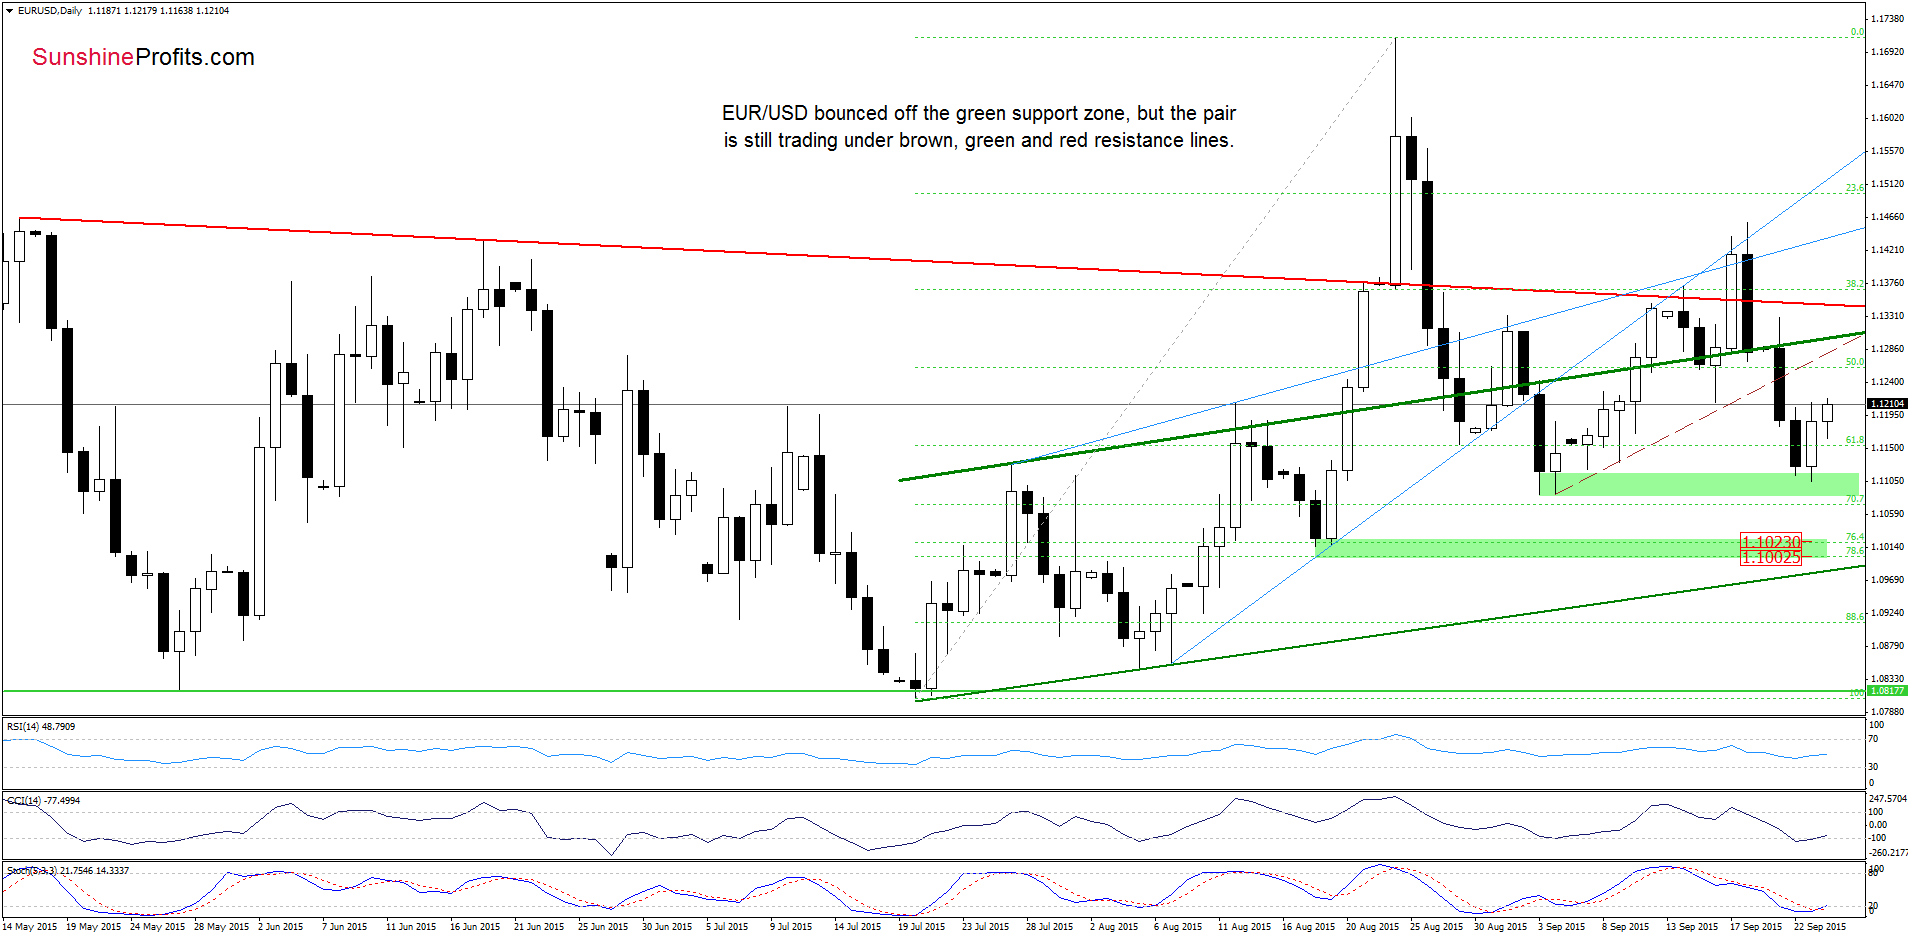
Quoting our Tuesday’s alert:
(…) currency bears pushed EUR/USD under the brown dashed support line, which is another strong negative signal, which suggests a test of the Sep lows in the coming day(s).
Looking at the daily chart, we see that currency bears took EUR/USD to our downside target as we had expected. As you see on the above chart the green support area triggered a rebound, which resulted in a climb above 1.1200. Earlier today, the pair extended yesterday’s increase, but despite this move, EUR/USD is still trading under the previously-broken brown dashed line, the upper border of the rising trend channel and well below the red declining resistance line, which in combination with the medium-term picture suggests that even if the exchange rate moves little higher from here, a sizable rally is questionable – especially when we factor in what we wrote yesterday about the current situation in the USD Index.
Very short-term outlook: bearish
Short-term outlook: bearish
MT outlook: mixed with bearish bias
LT outlook: mixed
Trading position (short-term; our opinion): Short positions with a stop-loss order at 1.1887 are justified from the risk/reward perspective. We will keep you informed should anything change, or should we see a confirmation/invalidation of the above.
USD/JPY
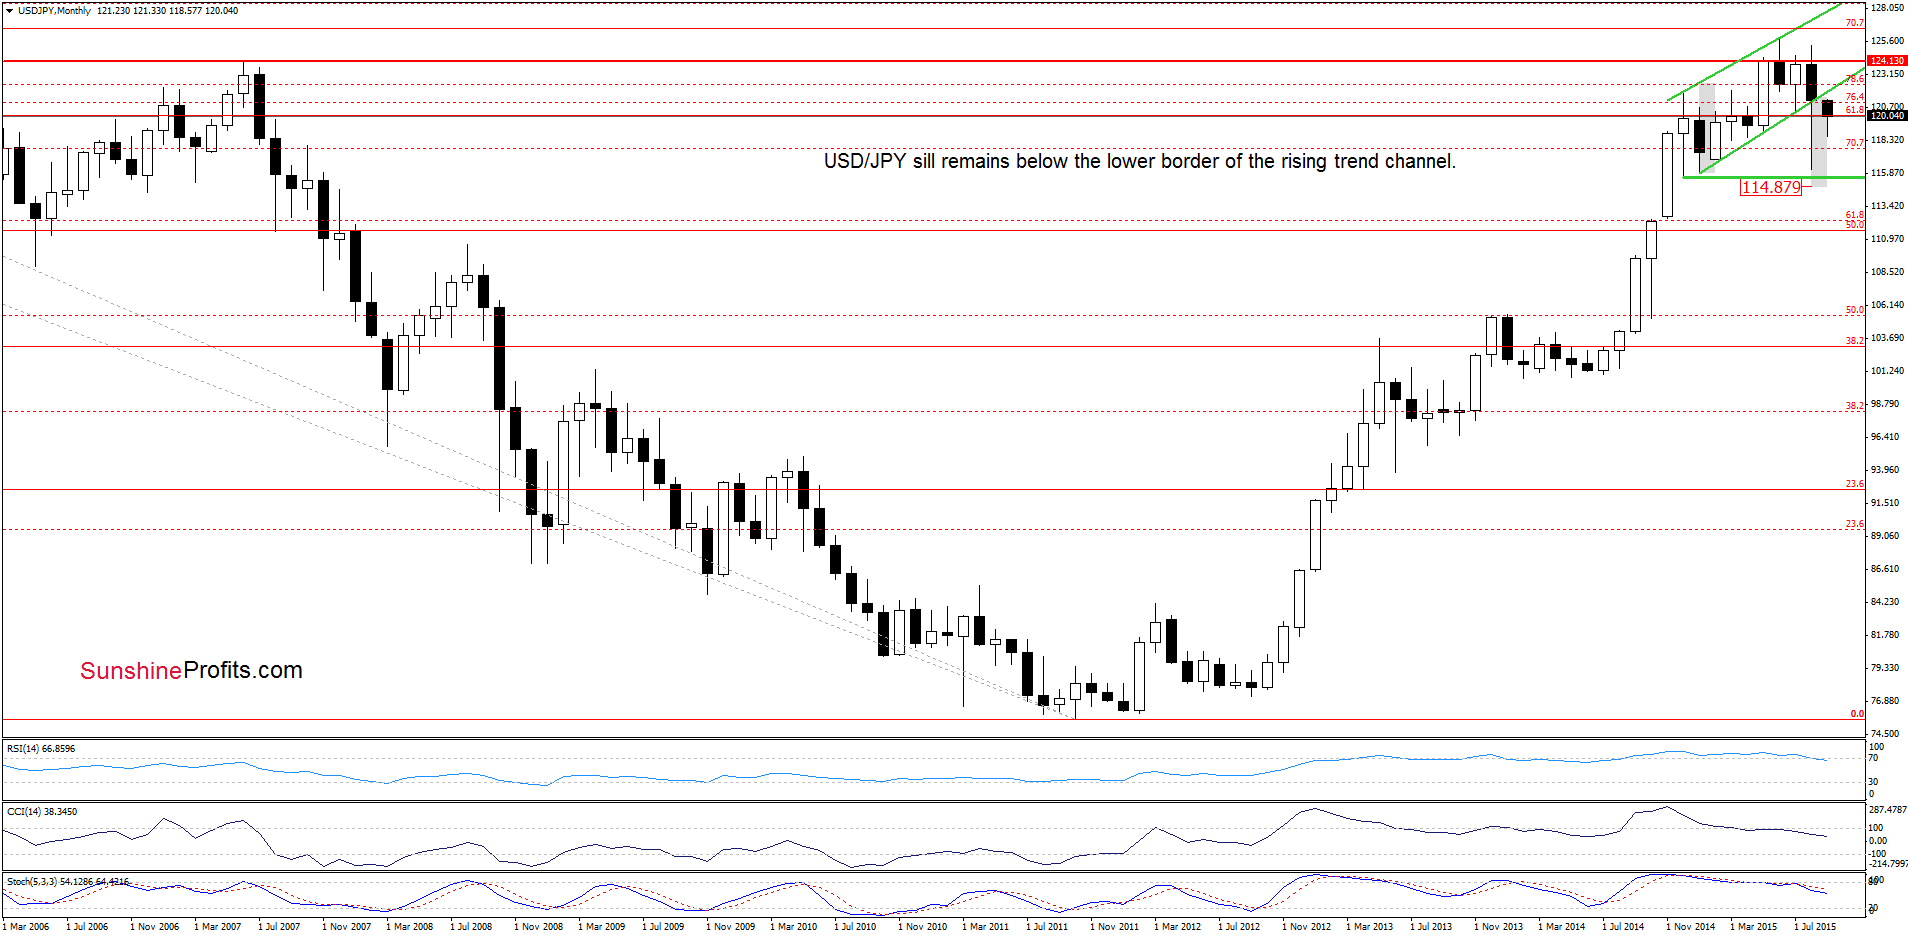
The situation in the medium-term hasn’t changed much as USD/JPY is still trading under the lower border of the rising trend channel, which suggests further deterioration.
Will the daily chart confirm this bearish scenario? Let’s check.
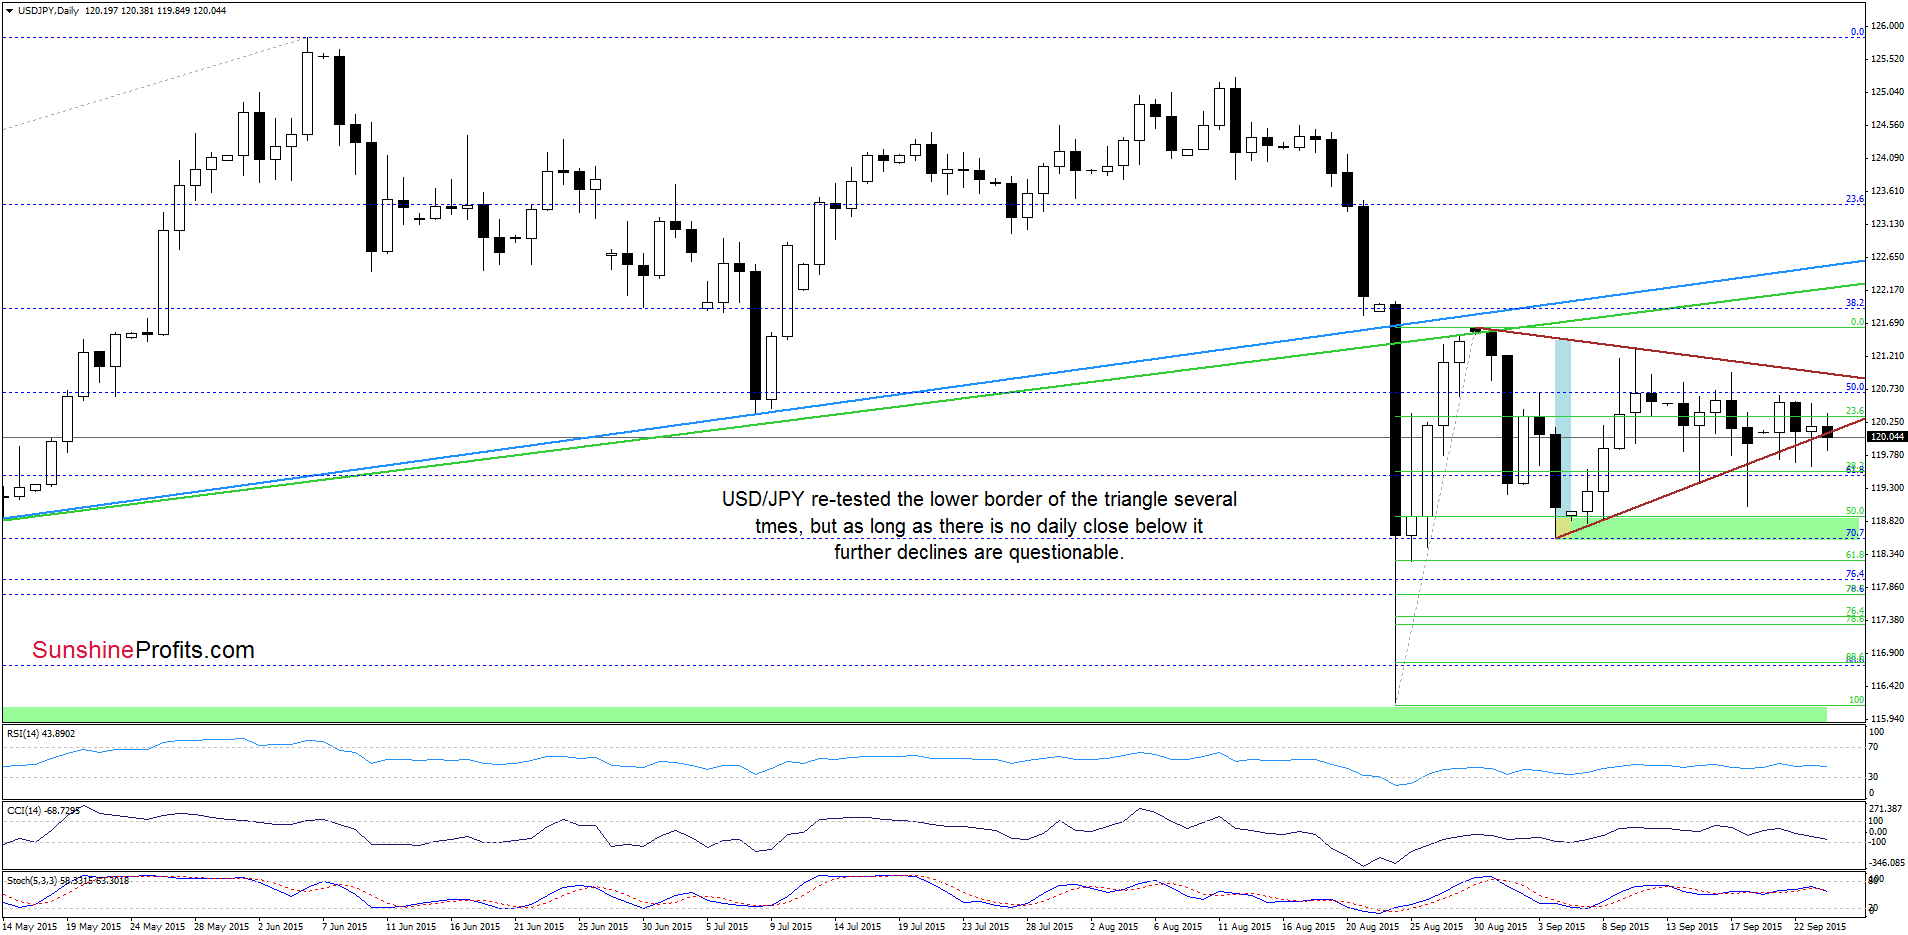
As you see on the daily chart, the situation hasn’t changed much since our previous commentary on this currency pair was posted because USD/JPY is still trading in the triangle. Although the pair re-tested the lower border of the formation several times in recent days, all attempts to move lower failed, which can be considered a positive signal. Nevertheless, the current position of the daily indicators (sell signal are still in play) in combination with the medium-term picture suggests that currency bears will likely try to push the pair lower once again. If they succeed and we see a daily close under the brown support line, it would be a bearish signal, which will translate to a test of the last week’s low of 119.04.
Very short-term outlook: mixed with bearish bias
Short-term outlook: mixed
MT outlook: mixed with bearish bias
LT outlook: mixed
Trading position (short-term; our opinion): No positions are justified from the risk/reward perspective at the moment. We will keep you informed should anything change, or should we see a confirmation/invalidation of the above.
USD/CAD
In our previous commentary on this currency pair, we wrote the following:
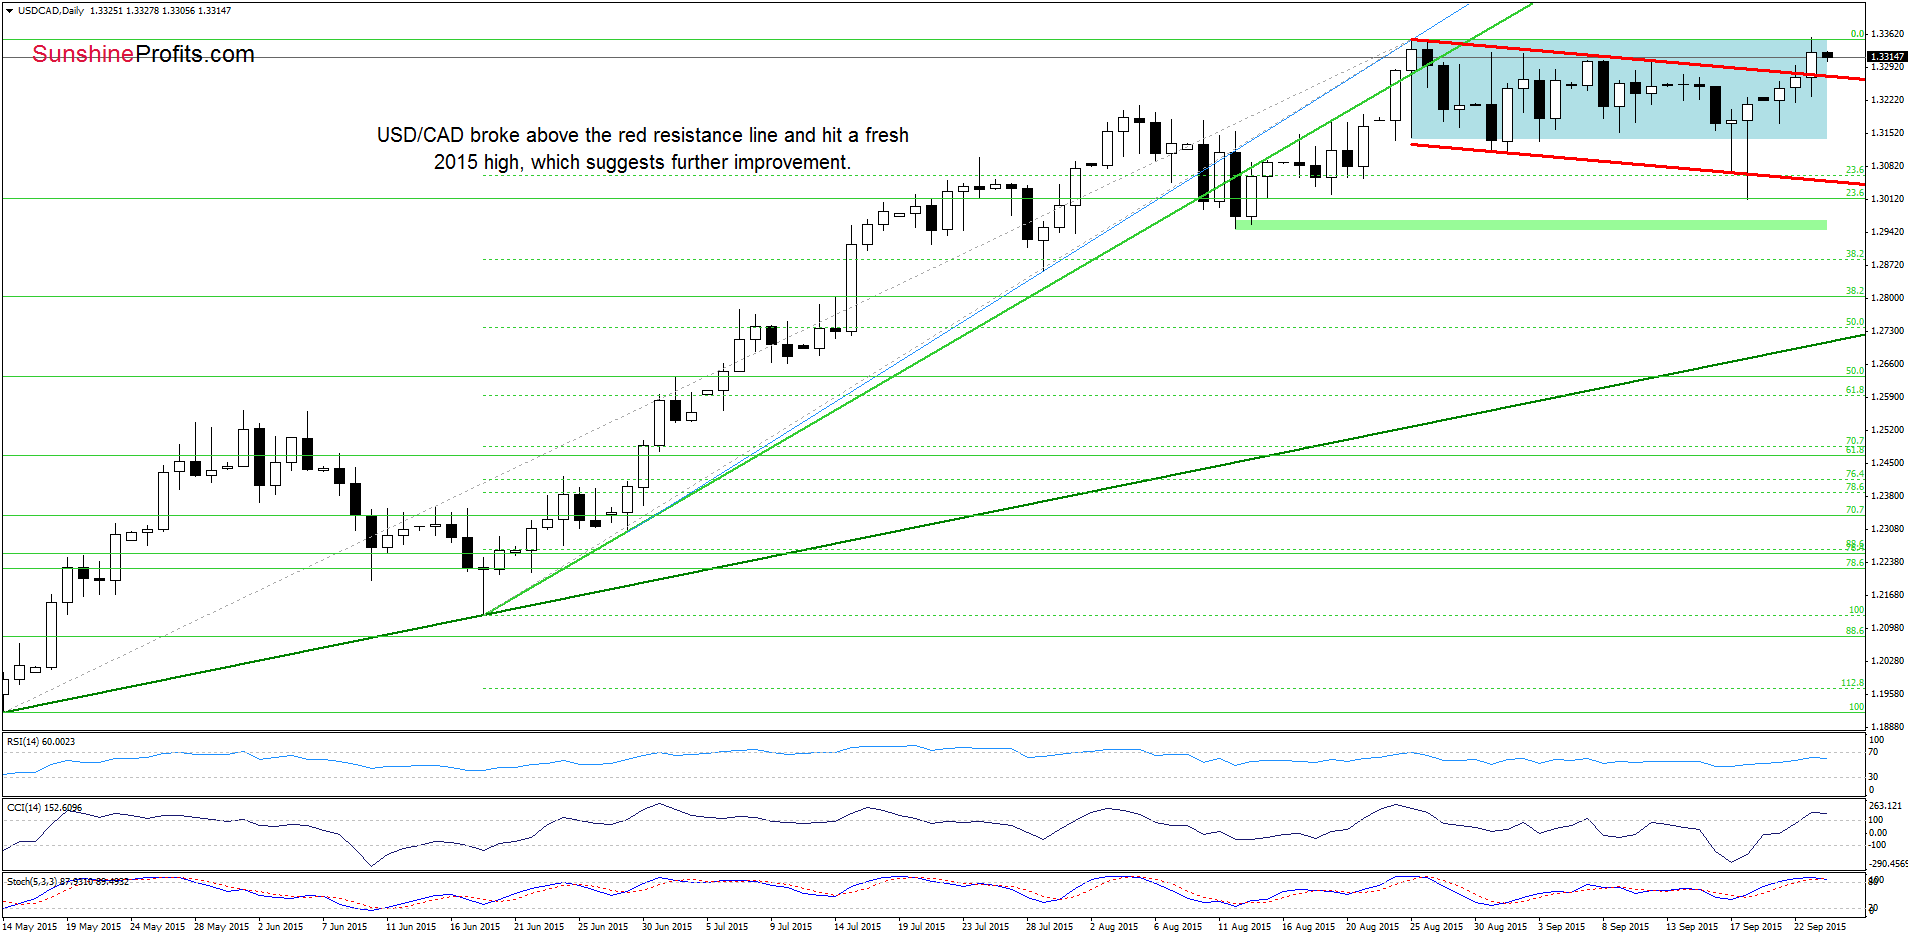
(…) the exchange rate came back to the blue consolidation, which makes the very short-term picture a bit unclear. Nevertheless, taking into account buy signals generated by the indicators and the medium-term picture, we think that currency bulls will try to push USD/CAD higher in the coming days. If they succeed, and we see a breakout above the red declining resistance line, the next upside target would be the upper border of the consolidation.
Looking at the daily chart, we see that the situation developed in line with the above scenario and USD/CAD reached our upside target. Additionally, yesterday’s increase resulted in a fresh 2015 high, which suggests further improvement.
How high could the exchange rate go in the coming days? Let’s take a closer look at the weekly chart and find out.
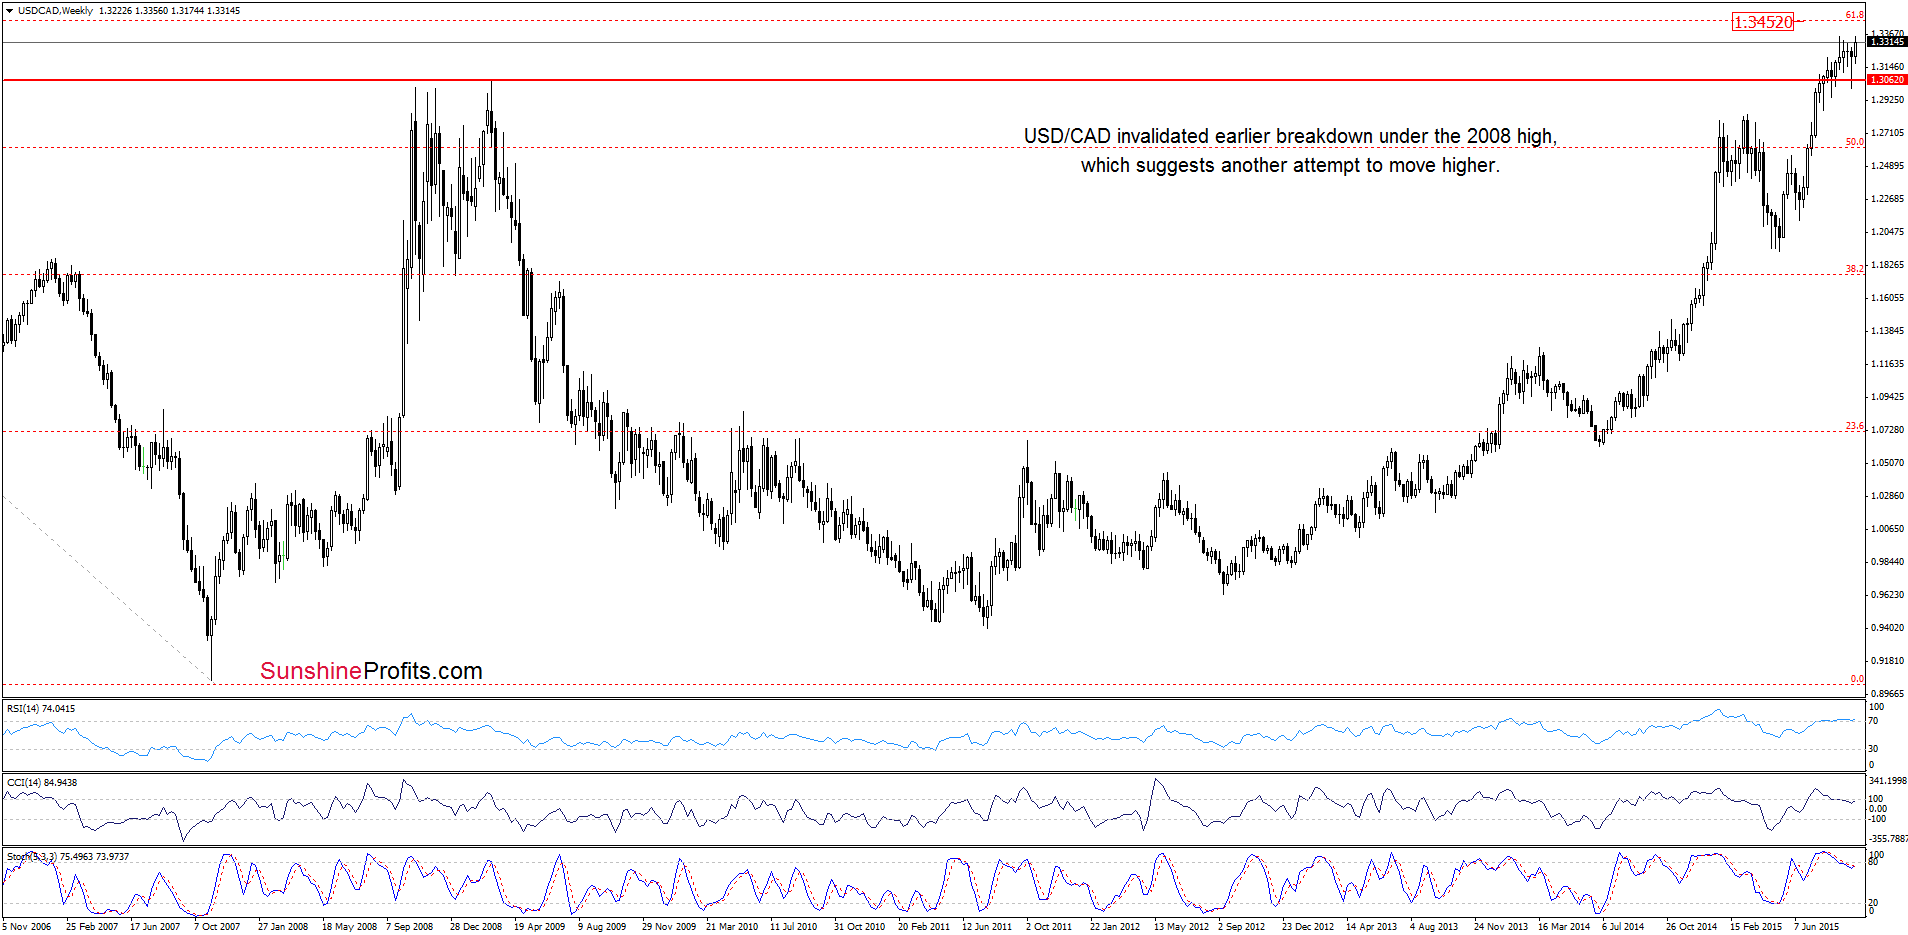
From this perspective, we see that the initial upside target for currency bulls would be around 1.3452, where the 61.8% Fibonacci retracement is (at 1.3444 is also the 127.2% Fibonacci extension based on the Aug-Sep decline). Nevertheless, we should keep in mind that the daily and weekly CCI and Stochastic Oscillator are overbought, while the weekly RSI climbed above the level of 70, which suggests that reversal is just around the corner.
Very short-term outlook: mixed with bullish bias
Short-term outlook: mixed
MT outlook: mixed
LT outlook: mixed
Trading position (short-term; our opinion): No positions are justified from the risk/reward perspective at the moment. We will keep you informed should anything change, or should we see a confirmation/invalidation of the above.
Thank you.
Nadia Simmons
Forex & Oil Trading Strategist
Przemyslaw Radomski, CFA
Founder, Editor-in-chief
Gold & Silver Trading Alerts
Forex Trading Alerts
Oil Investment Updates
Oil Trading Alerts

