

In our opinion the following forex trading positions are justified - summary:
- EUR/USD: short (a stop-loss order at 1.1887; the downside target around 1.0938)
- GBP/USD: none
- USD/JPY: none
- USD/CAD: none
- USD/CHF: none
- AUD/USD: none
While in most Forex Trading Alerts we focus on individual currency pairs, today we once again decided to focus on the USD Index that covers most of them in order to look at the broader picture and make sure that we “don’t miss the forest for the trees”.
We have commented on the USD Index in the Sep 14 Alert and the long-term outlook for the USD Index hasn’t changed since that time. Let’s start the analysis with quoting what we wrote back then. (charts courtesy of http://stockcharts.com).
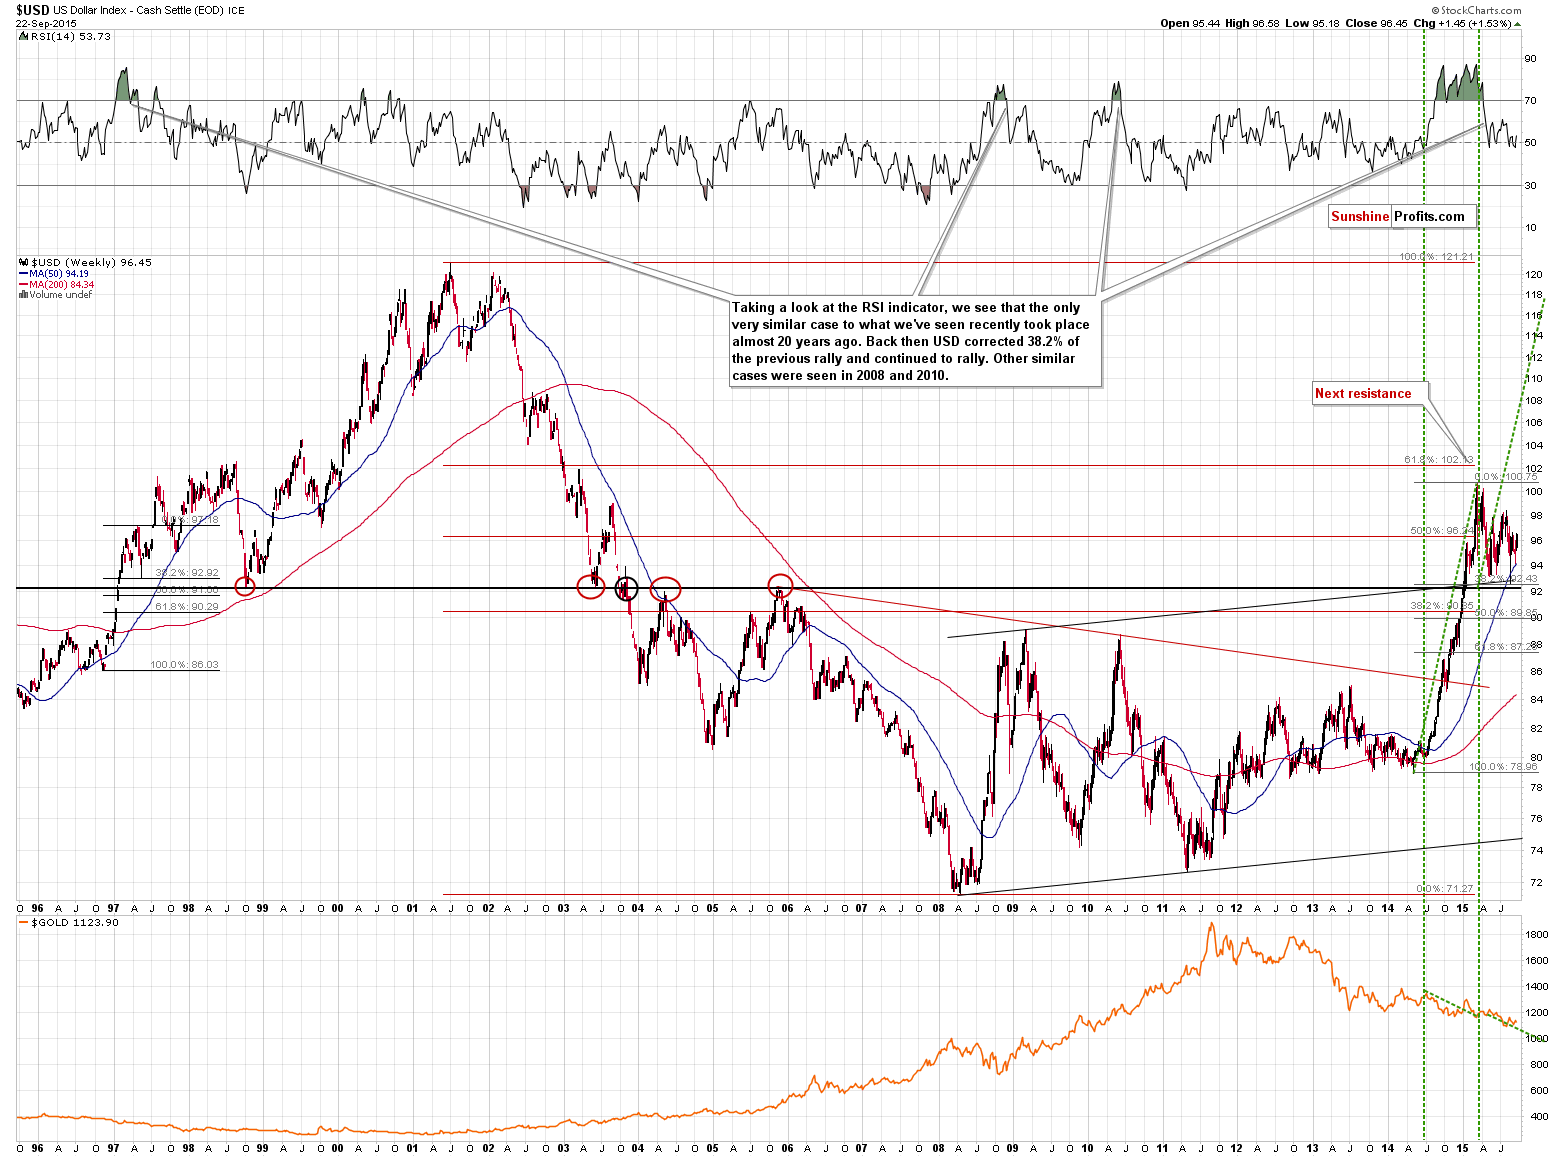
The long-term picture for the USD Index is very bullish. USD broke above the critical long-term resistance (at about 92) several months ago and it spent these months consolidating. The USD Index even moved back to the previously broken resistance levels and verified them as strong support. The first move to these levels was seen earlier this year, but while the move was significant enough to correct the previous rally in terms of price, it wasn’t significant enough in terms of time. Consequently, it’s no wonder that the USD Index continued to trade sideways and even moved temporarily to its 50-week moving average.
The important thing is that the key support levels held. Since the move that we saw before the consolidation is likely to be similar to the one that will follow, the next long-term price target is… about 118. Yes, 118. We realize that it seems unlikely, but… So was the USD Index at 100 in April 2014 – and yet it happened.
The above is up-to-date – the potential size of the next medium-term move is huge and the impact on key currency pairs is likely to be huge as well.
What about the short-term picture?
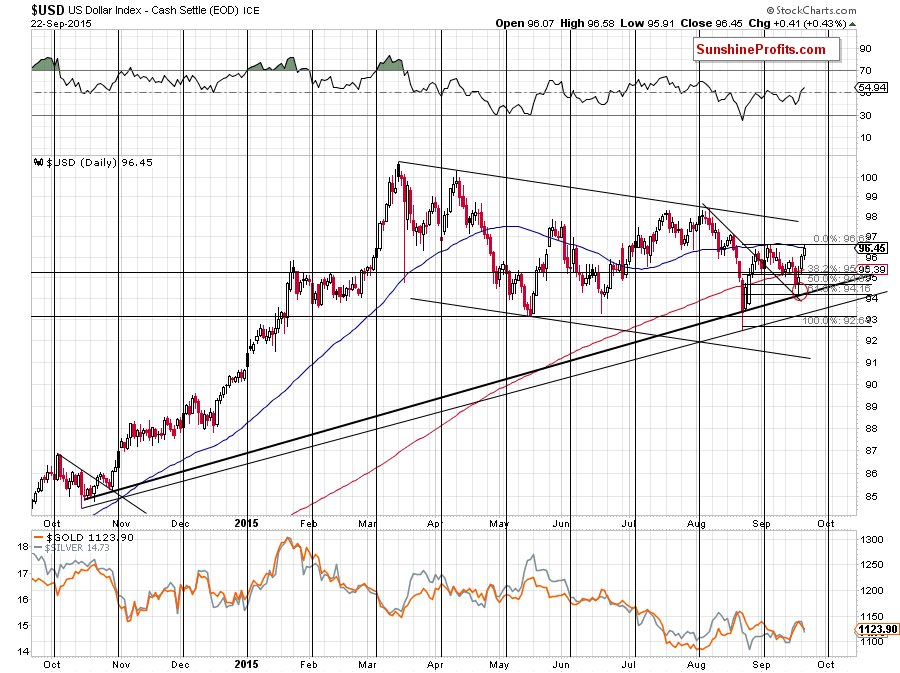
In the previous alert we wrote that we saw the decline in the USD as a normal breather that took place after a breakout and the cyclical turning point and that it didn’t make the picture bearish. The USD Index has indeed rallied shortly thereafter and is now more than one index point higher.
The USD Index is once again at its 50-day moving average (marked with blue), however since the index has already consolidated after the first attempt to move above it, it seems that it might be able to rally above it shortly – without an additional corrective downswing.
The next resistance is at the declining medium-term resistance line (currently at about 97.6), and it might (but doesn’t have to) trigger another corrective downswing. Once this level is taken out, the start of the next huge medium-term rally will likely be very close.
Since the largest component of the USD Index is the EUR/USD exchange rate, it seems that the profit potential for our short position in the latter is quite significant and it seems that we won’t have to wait to see USD’s rally’s continuation and we can say the same about EUR/USD’s decline.
Summing up, USD Index moved lower in the first part of September, but the declines were erased in the last few days. The medium-term outlook for the USD Index remains bullish.
Thank you.
Nadia Simmons
Forex & Oil Trading Strategist
Forex Trading Alerts
Oil Investment Updates
Oil Trading Alerts

