

Earlier today, the euro extended losses, hitting a fresh two-week low against the greenback after St. Louis and Atlanta Fed Presidents indicated that the U.S. central bank is still likely to raise short-term interest rates later this year. Where will the exchange rate head next?
In our opinion the following forex trading positions are justified - summary:
- EUR/USD: short (a stop-loss order at 1.1887; the downside target around 1.0938)
- GBP/USD: none
- USD/JPY: none
- USD/CAD: none
- USD/CHF: none
- AUD/USD: none
EUR/USD
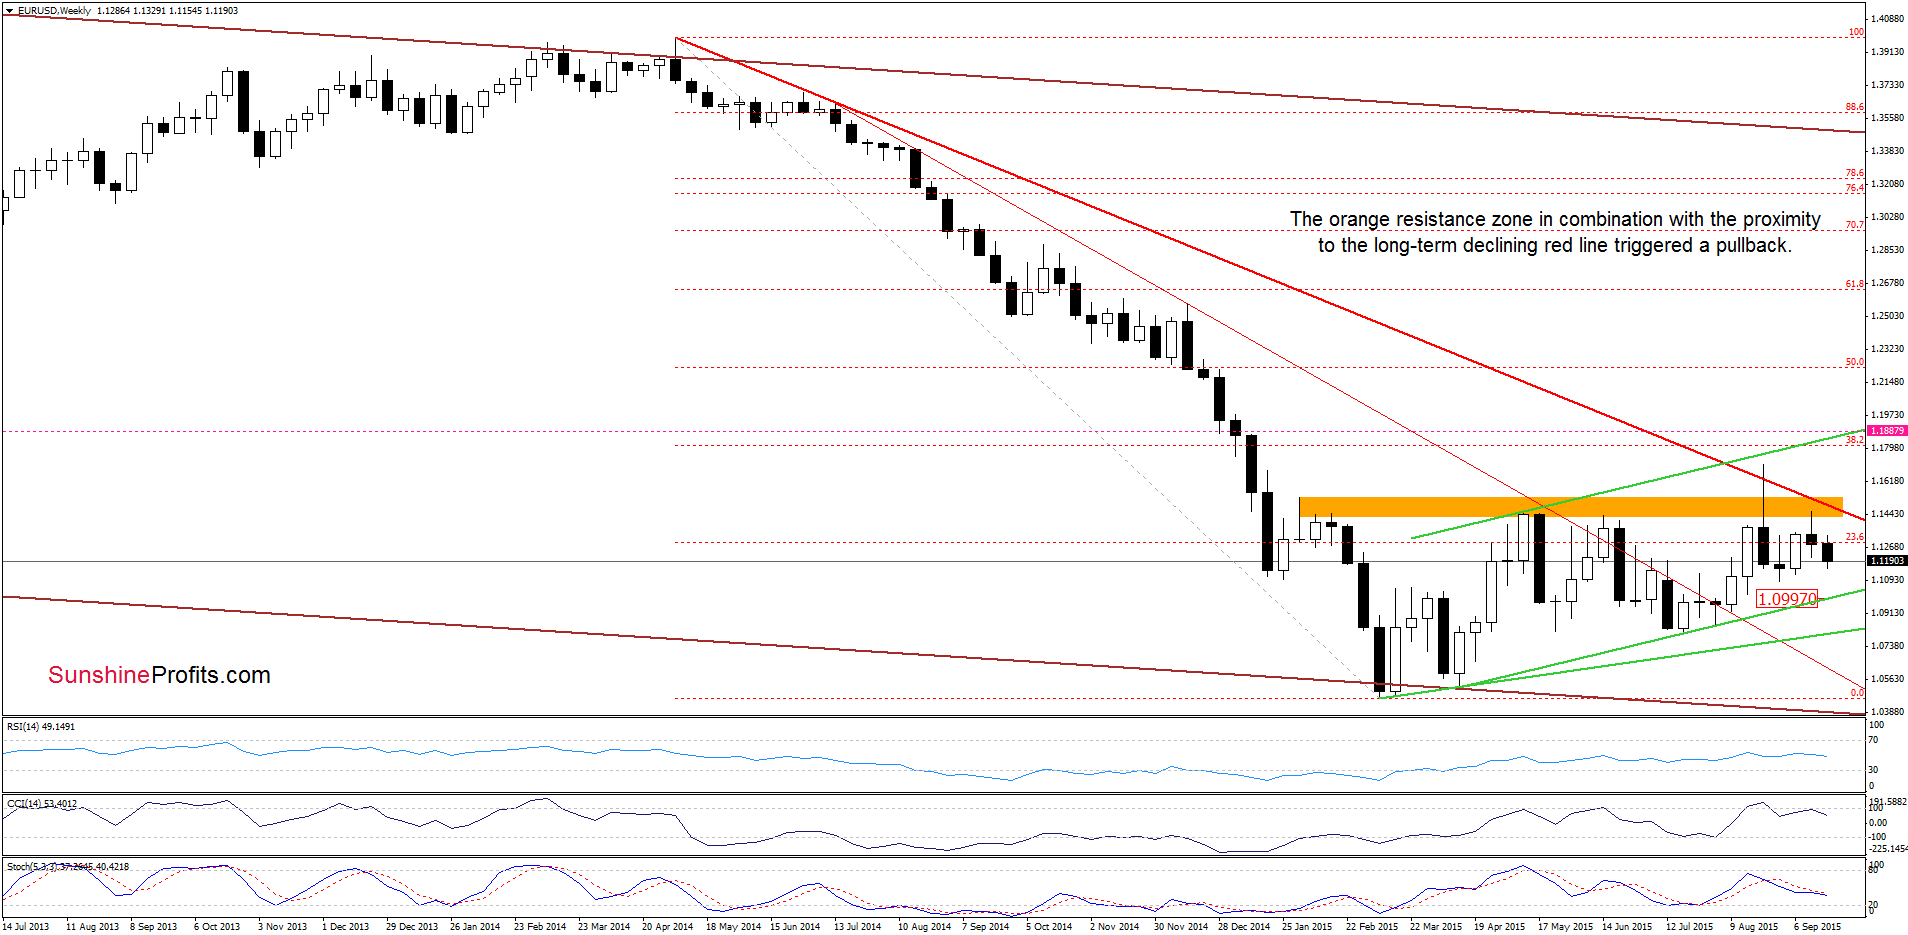
EUR/USD extended decline below the long-term red resistance line and the orange resistance zone, which in combination with sell signals generated by the indicators suggests further deterioration and a drop to around 1.1000, where the upper green support line is.
Are there any short-term support levels that could hinder the realization of the above scenario? Let’s examine the daily chart and find out.
Yesterday, we wrote the following:
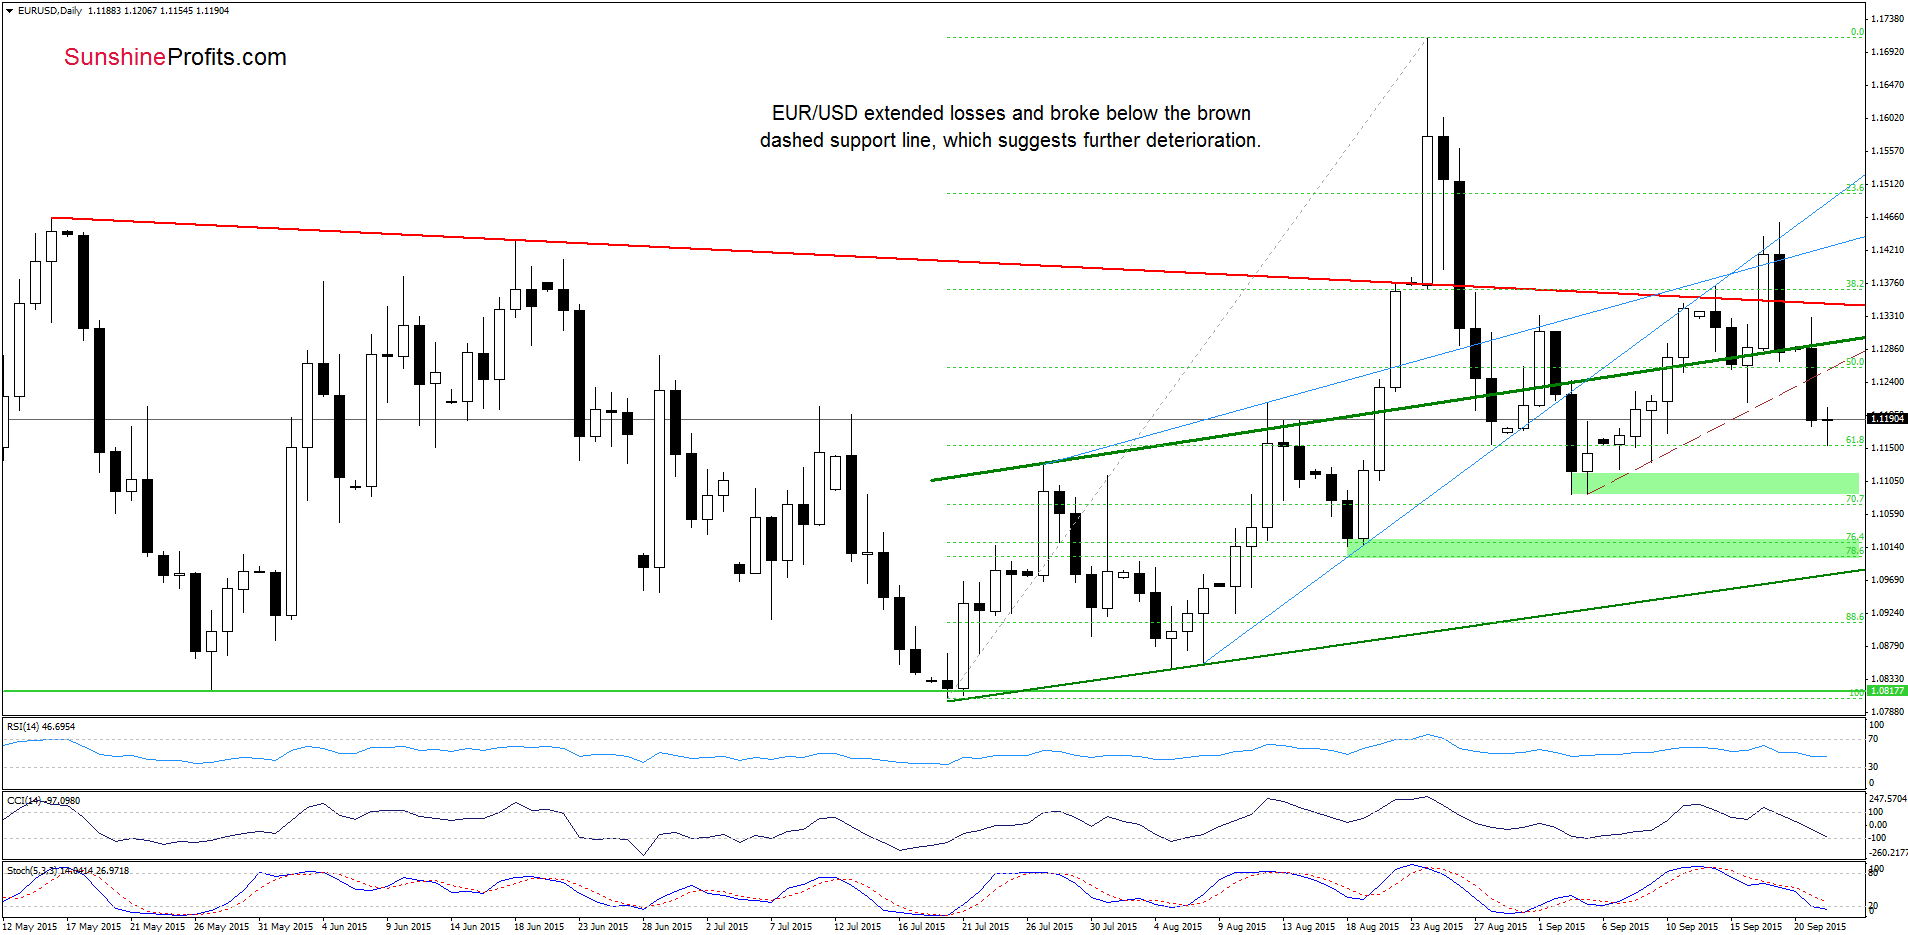
(…) the exchange rate closed Friday’s session not only below the upper line of the blue rising wedge, but also under the lower border of the formation and the previously-broken red declining line. In this way, the pair invalidates earlier breakouts, which is a strong negative signal. Therefore, if EUR/USD closes today’s session under the green support line, we’ll likely see an acceleration of decline and a drop to (at least) brown dashed support line. Finishing today’s commentary, please note that the CCI and Stochastic Oscillator generated sell signals, supporting currency bears and further deterioration.
From today’s point of view we see that the situation developed in line with the above scenario and currency bears pushed EUR/USD under the brown dashed support line, which is another strong negative signal, which suggests a test of the Sep lows in the doming day(s). However, taking into account sell signals generated by the indicators, we think that currency bears will try to push the pair even lower. In this case, the next downside target would be around 1.1000, where the green support zone created by the 76.4% and 78.6% Fibonacci retracement levels is.
Very short-term outlook: bearish
Short-term outlook: bearish
MT outlook: mixed with bearish bias
LT outlook: mixed
Trading position (short-term; our opinion): Short positions with a stop-loss order at 1.1887 are justified from the risk/reward perspective. We will keep you informed should anything change, or should we see a confirmation/invalidation of the above.
USD/CAD
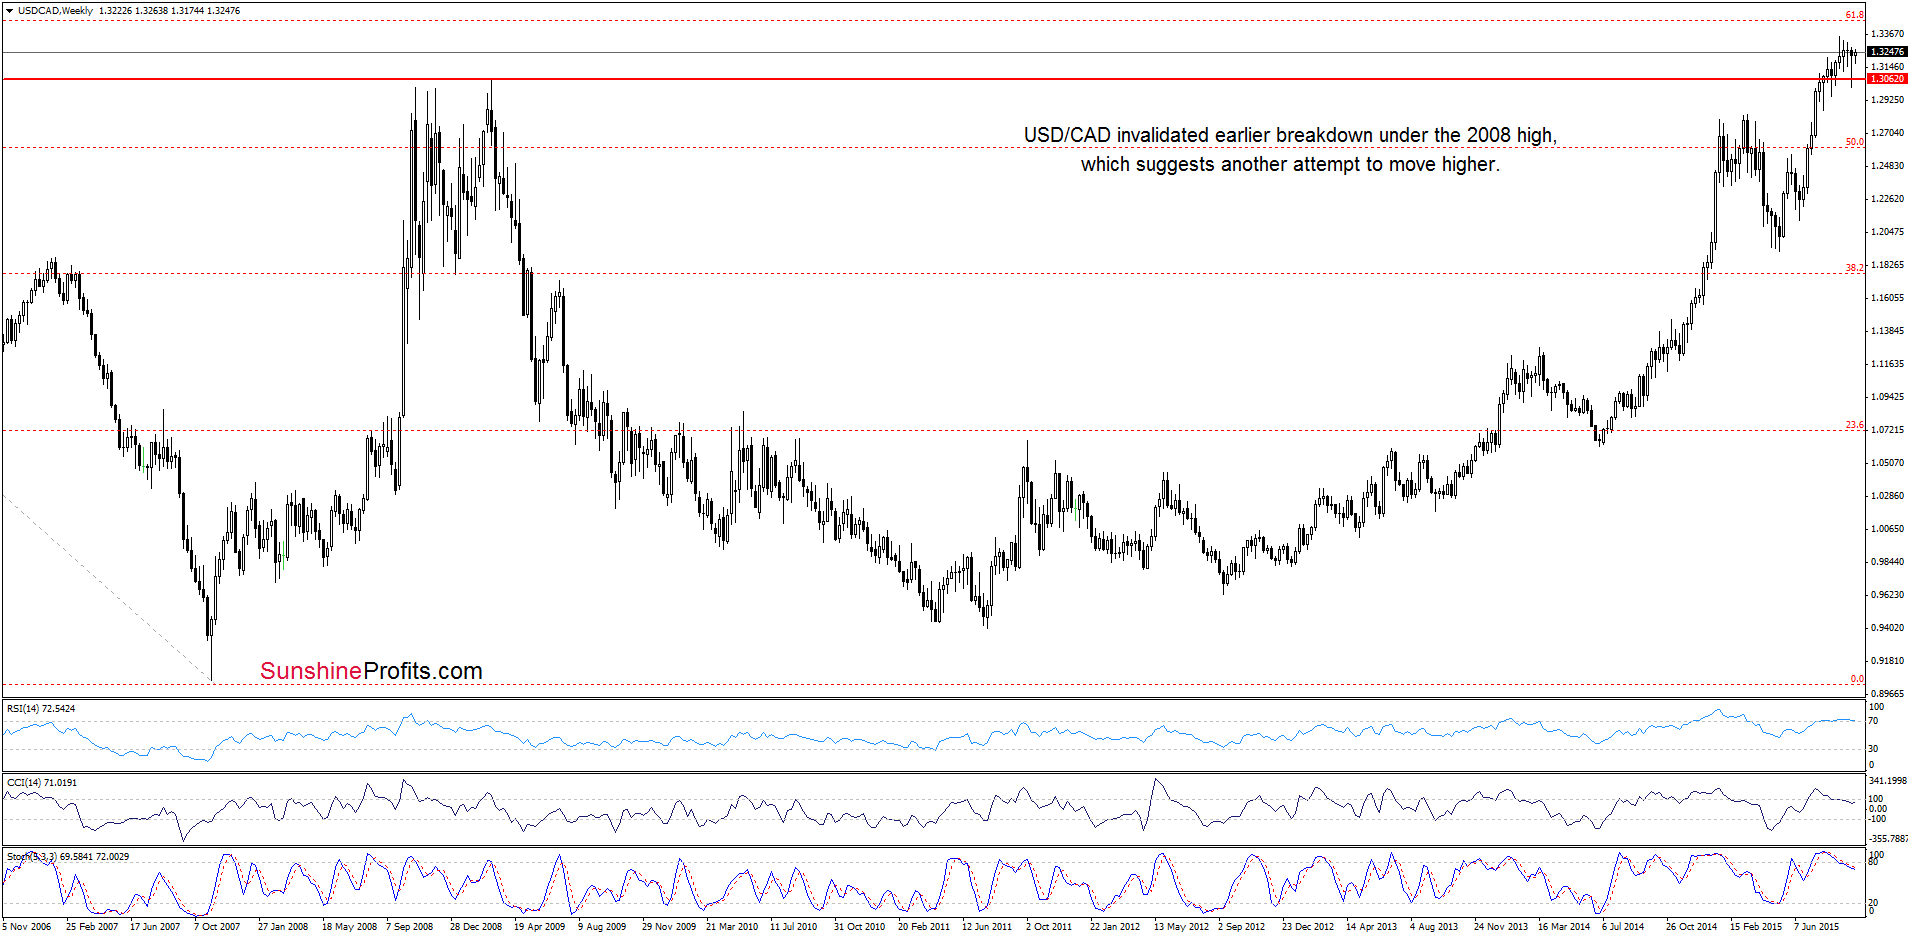
The situation in the medium-term picture has improved as USD/CAD moved higher and invalidated earlier breakdown under the 2008 high, which is a positive signal that suggests further increases.
What impact did this move have on the short-term picture? Let’s check.
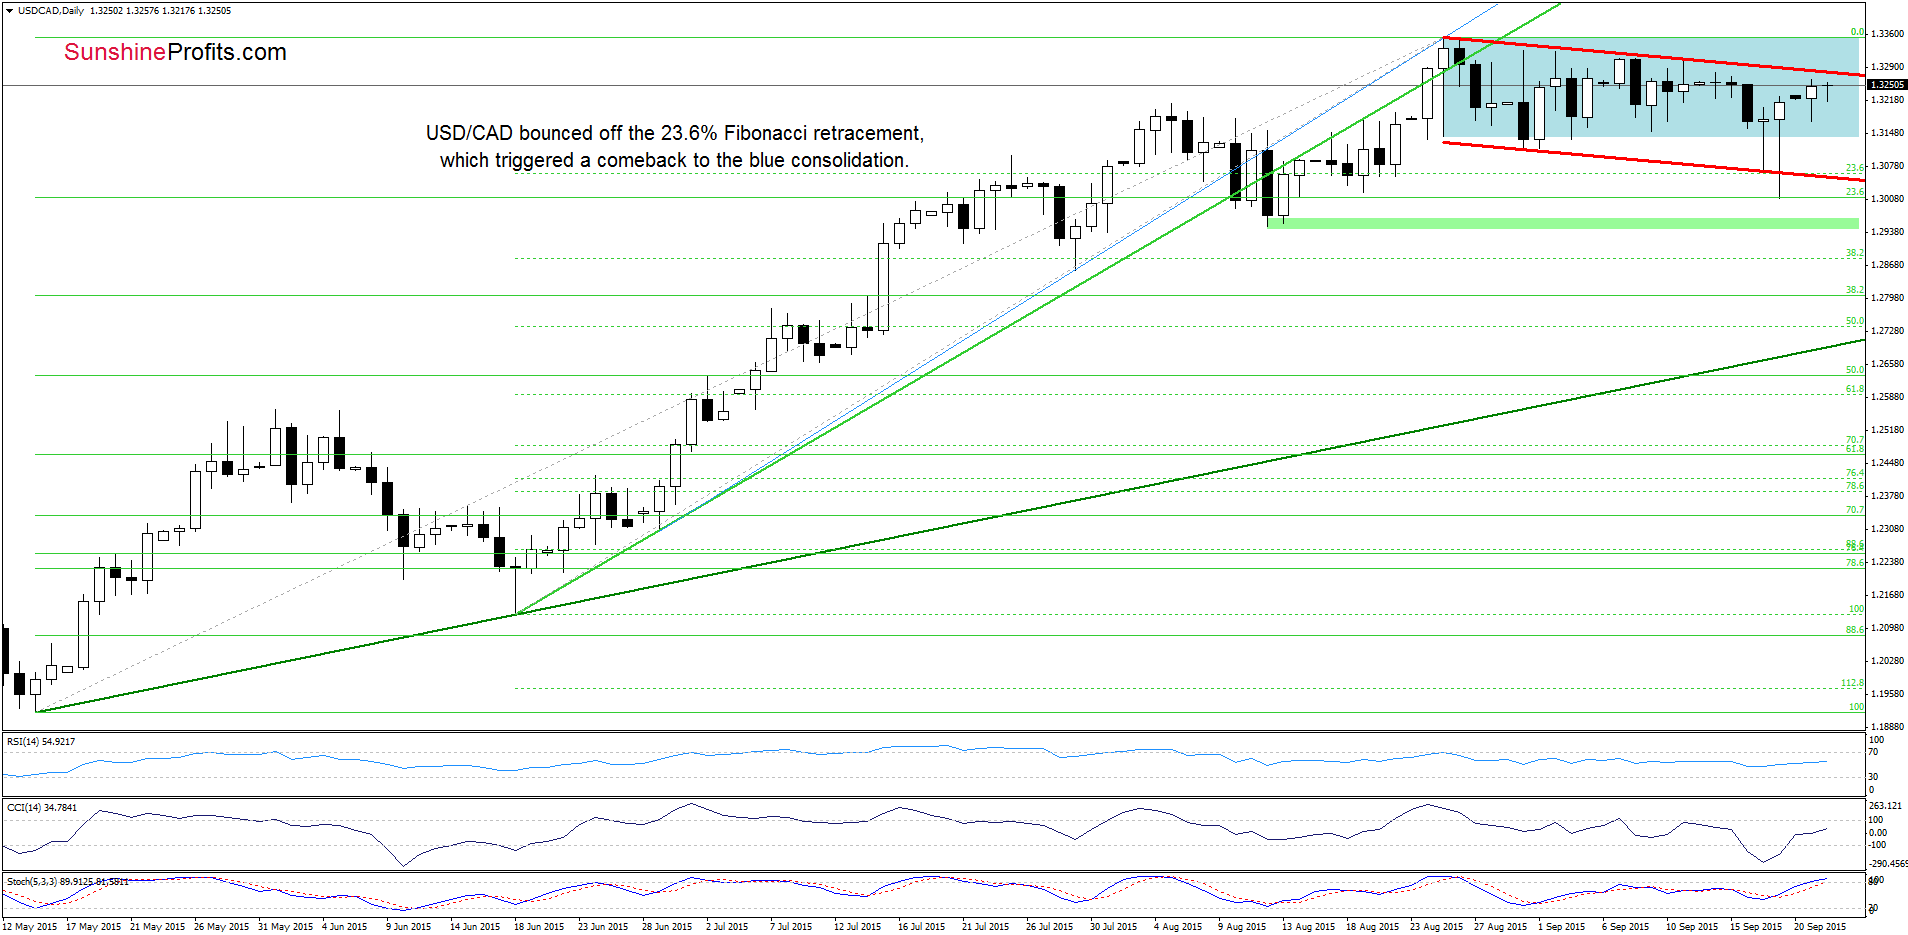
Looking at the daily chart, we see that the 23.6% Fibonacci retracement based on the entire May-Aug rally encouraged currency bulls to act, which translated to a sharp rebound on Friday. Thanks to this move, the exchange rate came back to the blue consolidation, which makes the very short-term picture a bit unclear. Nevertheless, taking into account buy signals generated by the indicators and the medium-term picture, we think that currency bulls will try to push USD/CAD higher in the coming days. If they succeed, and we see a breakout above the red declining resistance line, the next upside target would be the upper border of the consolidation.
Very short-term outlook: mixed with bullish bias
Short-term outlook: mixed
MT outlook: mixed
LT outlook: mixed
Trading position (short-term; our opinion): No positions are justified from the risk/reward perspective at the moment. We will keep you informed should anything change, or should we see a confirmation/invalidation of the above.
USD/CHF
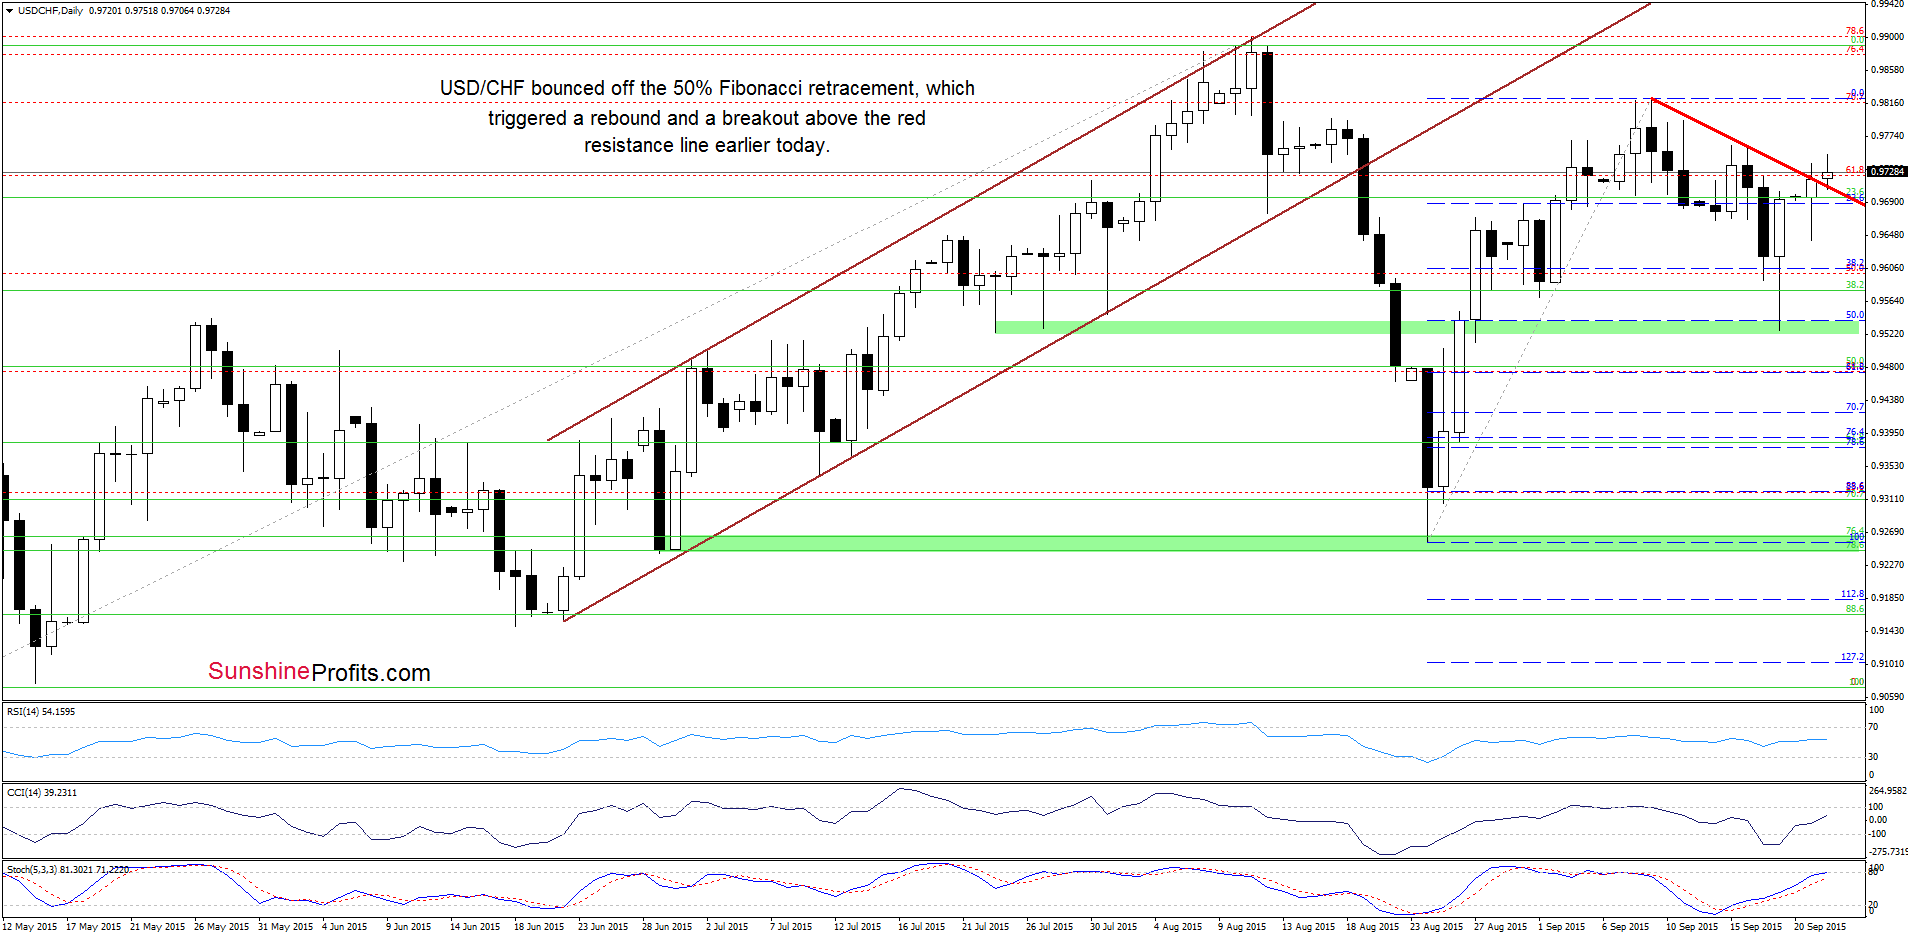
On Friday, we wrote the following:
(…) USD/CHF not only reached our downside target, but also slipped to the 50% Fibonacci retracement and the green support zone, which could trigger a rebound from here in the coming day(s).
As you see on the daily chart USD/CHF bounced off the green support zone as we had expected. With this upswing, the pair climbed above the red declining resistance line (based on the recent highs), which is a positive signal that suggests further improvement – especially when we factor in buy signals generated by the indicators. In our opinion, if the exchange rate closes today’s session above this line, we’ll see a test of the Sep highs in the coming days.
Nevertheless, we should keep in mind that before we see such price action currency bulls will have to push the pair above the key medium-term resistance marked on the chart below.
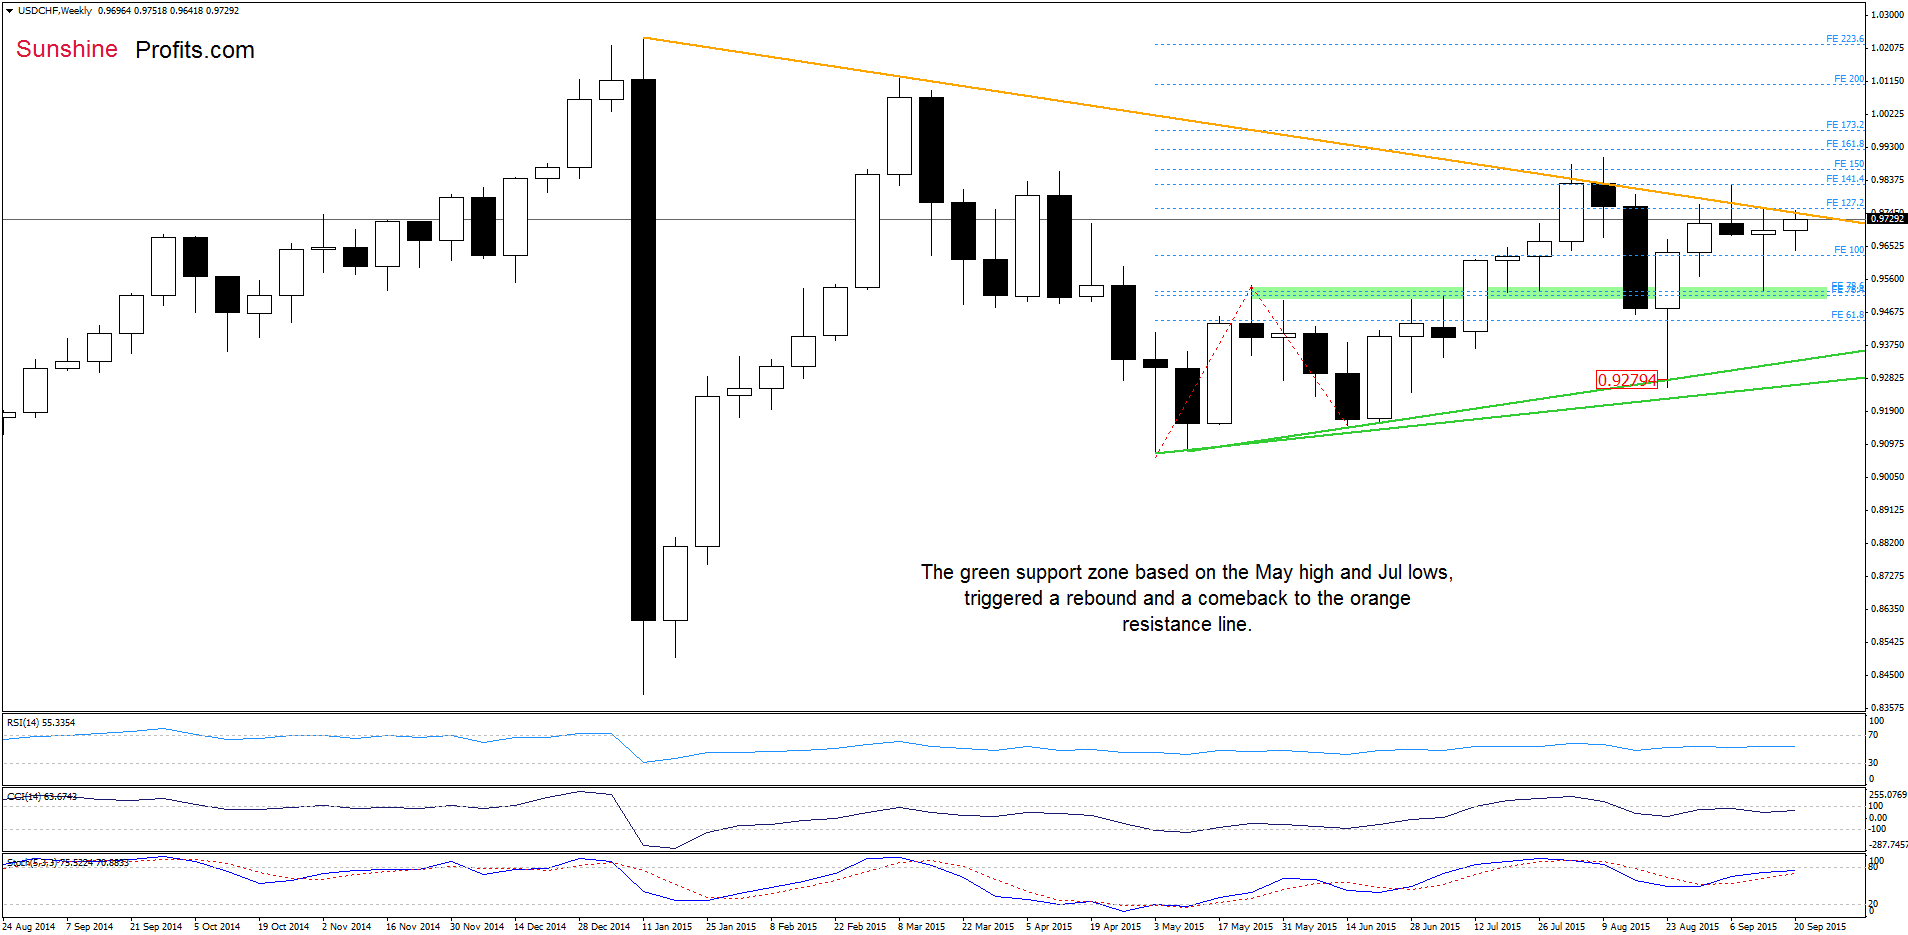
On the above chart, we see that USD/CHF reached the orange resistance line once again, which could pause or even stop currency bulls – similarly to what we saw in previous weeks. However, if they manage to break and close this week above this resistance, it would be a strong bullish signal, which will trigger further rally.
Very short-term outlook: mixed with bullish bias
Short-term outlook: mixed
MT outlook: mixed
LT outlook: mixed
Trading position (short-term; our opinion): No positions are justified from the risk/reward perspective at the moment. We will keep you informed should anything change, or should we see a confirmation/invalidation of the above.
Thank you.
Nadia Simmons
Forex & Oil Trading Strategist
Przemyslaw Radomski, CFA
Founder, Editor-in-chief
Gold & Silver Trading Alerts
Forex Trading Alerts
Oil Investment Updates
Oil Trading Alerts

