

Yesterday, the Federal Reserve left its benchmark interest rate unchanged between zero and 0.25%, which pushed the USD sharply lower. Thanks to these circumstances, the greenback slipped to its lowest level since the beginning of the month, hitting an intraday low of 94.48. What impact did this drop have on the short-term picture of our six currency pairs?
In our opinion the following forex trading positions are justified - summary:
- EUR/USD: short (a stop-loss order at 1.1887; the downside target around 1.0938)
- GBP/USD: none
- USD/JPY: none
- USD/CAD: none
- USD/CHF: none
- AUD/USD: none
EUR/USD
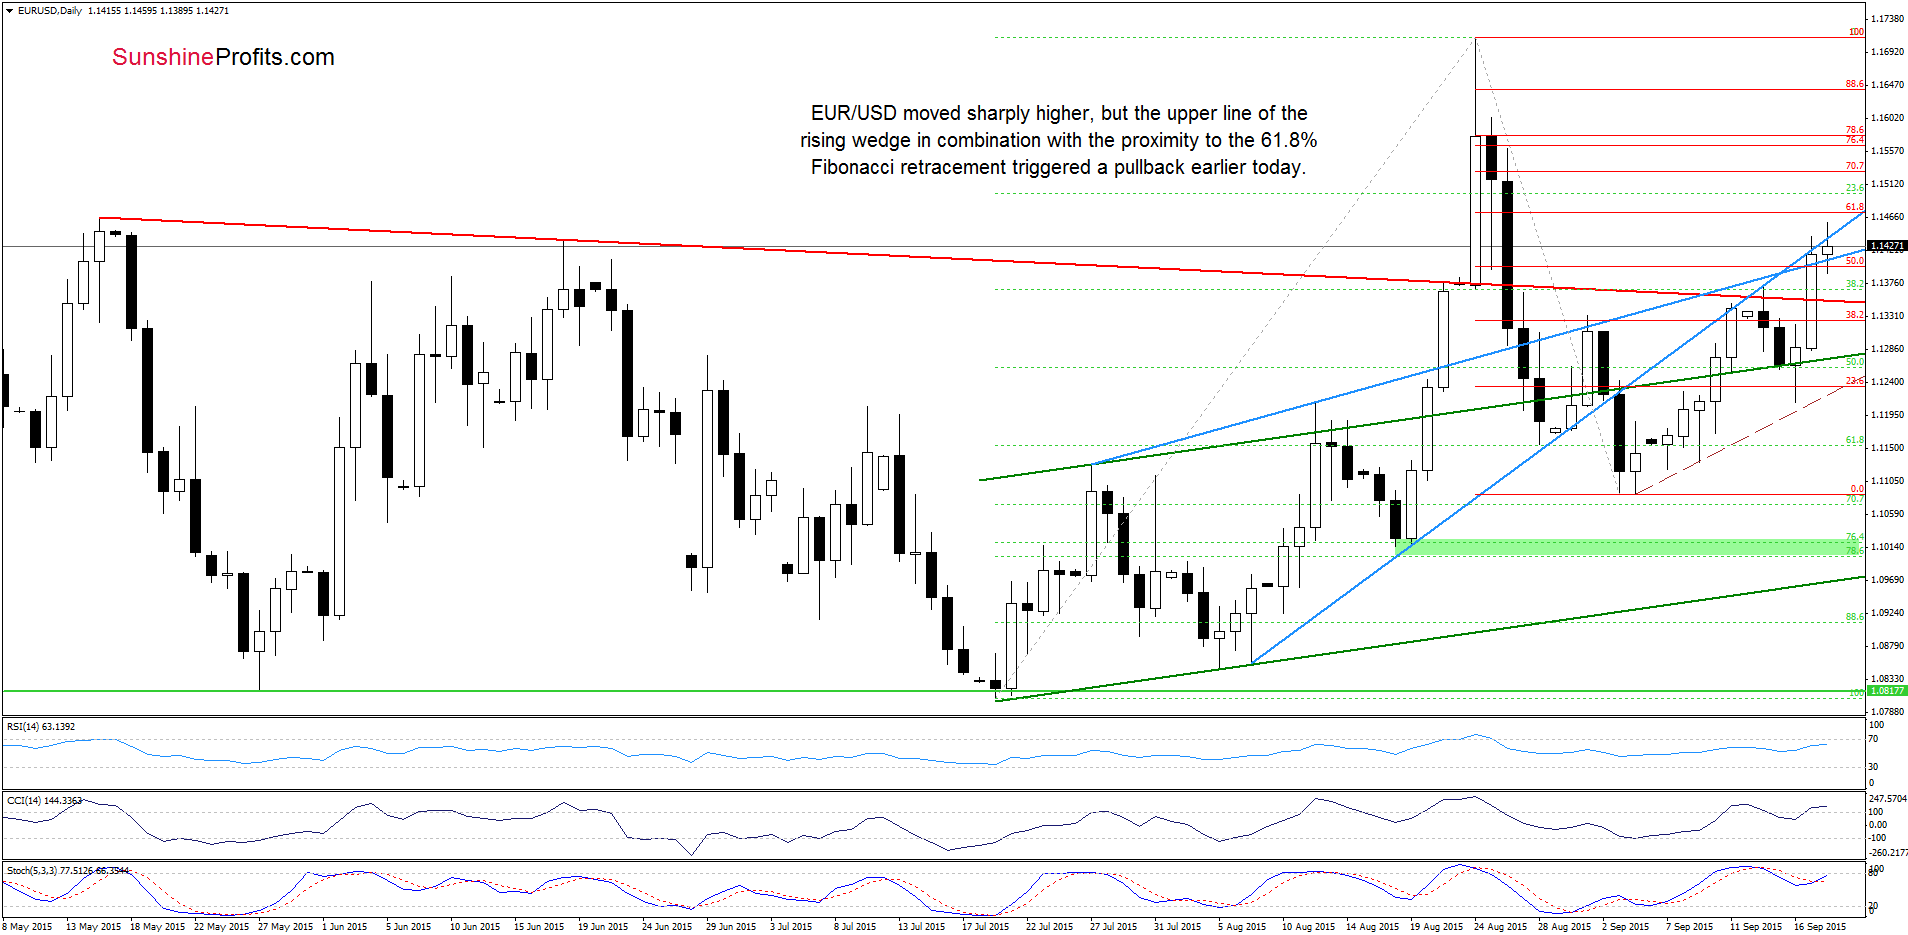
Yesterday, EUR/USD moved higher and broke above the red declining line which triggered a sharp increase above the 50% Fibnacci retracement. Although the exchange rate extended rally earlier today, the upper border of the blue rising wedge n combination wih the proximity to the 61.8% Fibonacci retracement encouraged currency bears to act. As a result, the pair pulled back and invalidated earlier breakout above the upper line of the formation, which is a negative signal (which will turn to berish if we see a daily close below this line). Additionally, there are negative divergences between the CCI, the Stochastic Oscillator and the exchange rate, which suggests that reversal is jst around the corner.
Are there any other technical factors that could trigger declines in the coming week? Let’s examine the medium-term picture and find out.
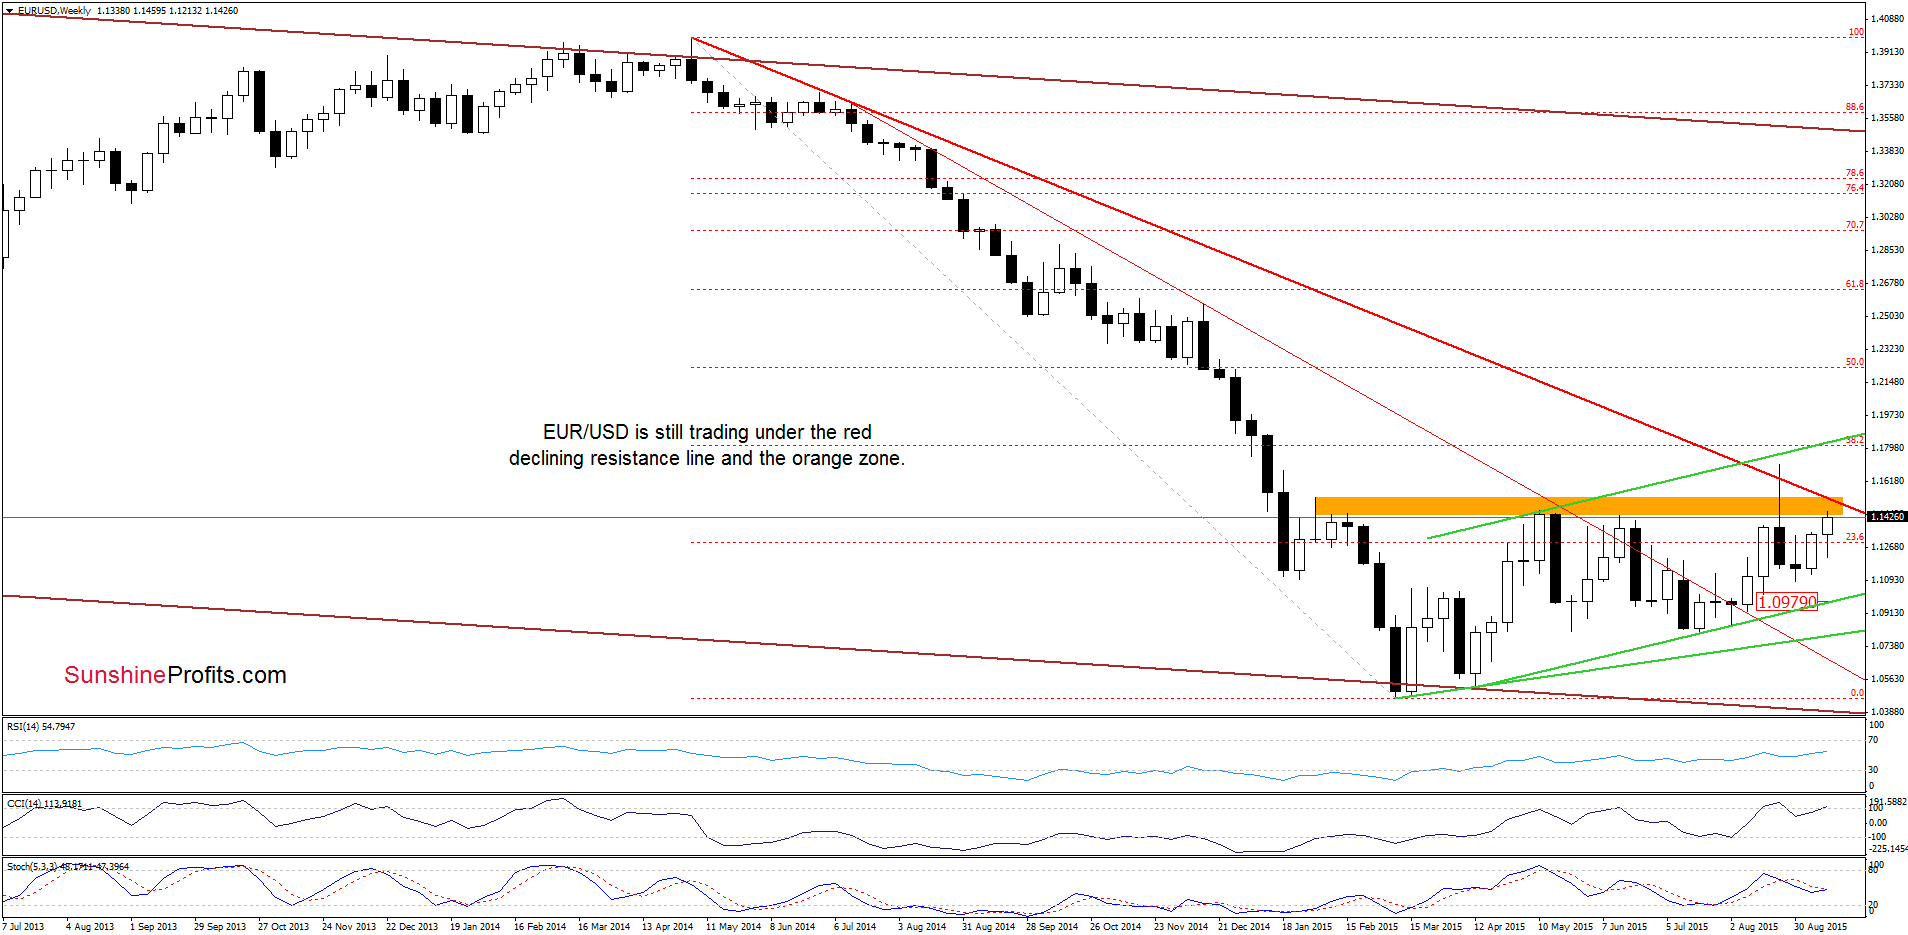
From this perspective, we see that although EUR/USD increased, the exchange rate remains under the long-term red resistance line and the orange resistance zone, which were strong enough to stop currency bulls in previous weeks. Therefore, we believe that as long as this area is in play, a sizable rally is not likely to be seen.
Very short-term outlook: bearish
Short-term outlook: bearish
MT outlook: mixed with bearish bias
LT outlook: mixed
Trading position (short-term; our opinion): The previous stop-loss level was temporarily reached today - if the position was automatically close, in our opinion it’s justified from the risk/reward perspective to re-enter this position with a higher stop-loss level. If it wasn’t closed, we still think that adjusting the stop-loss level to 1.1887 is justified from the risk/reward perspective. We think that focusing on the medium-term move here is much more important than the very short-term one, as that’s where we think the risk is relatively low compared to the size of the potential gain. We will keep you informed should anything change, or should we see a confirmation/invalidation of the above.
GBP/USD
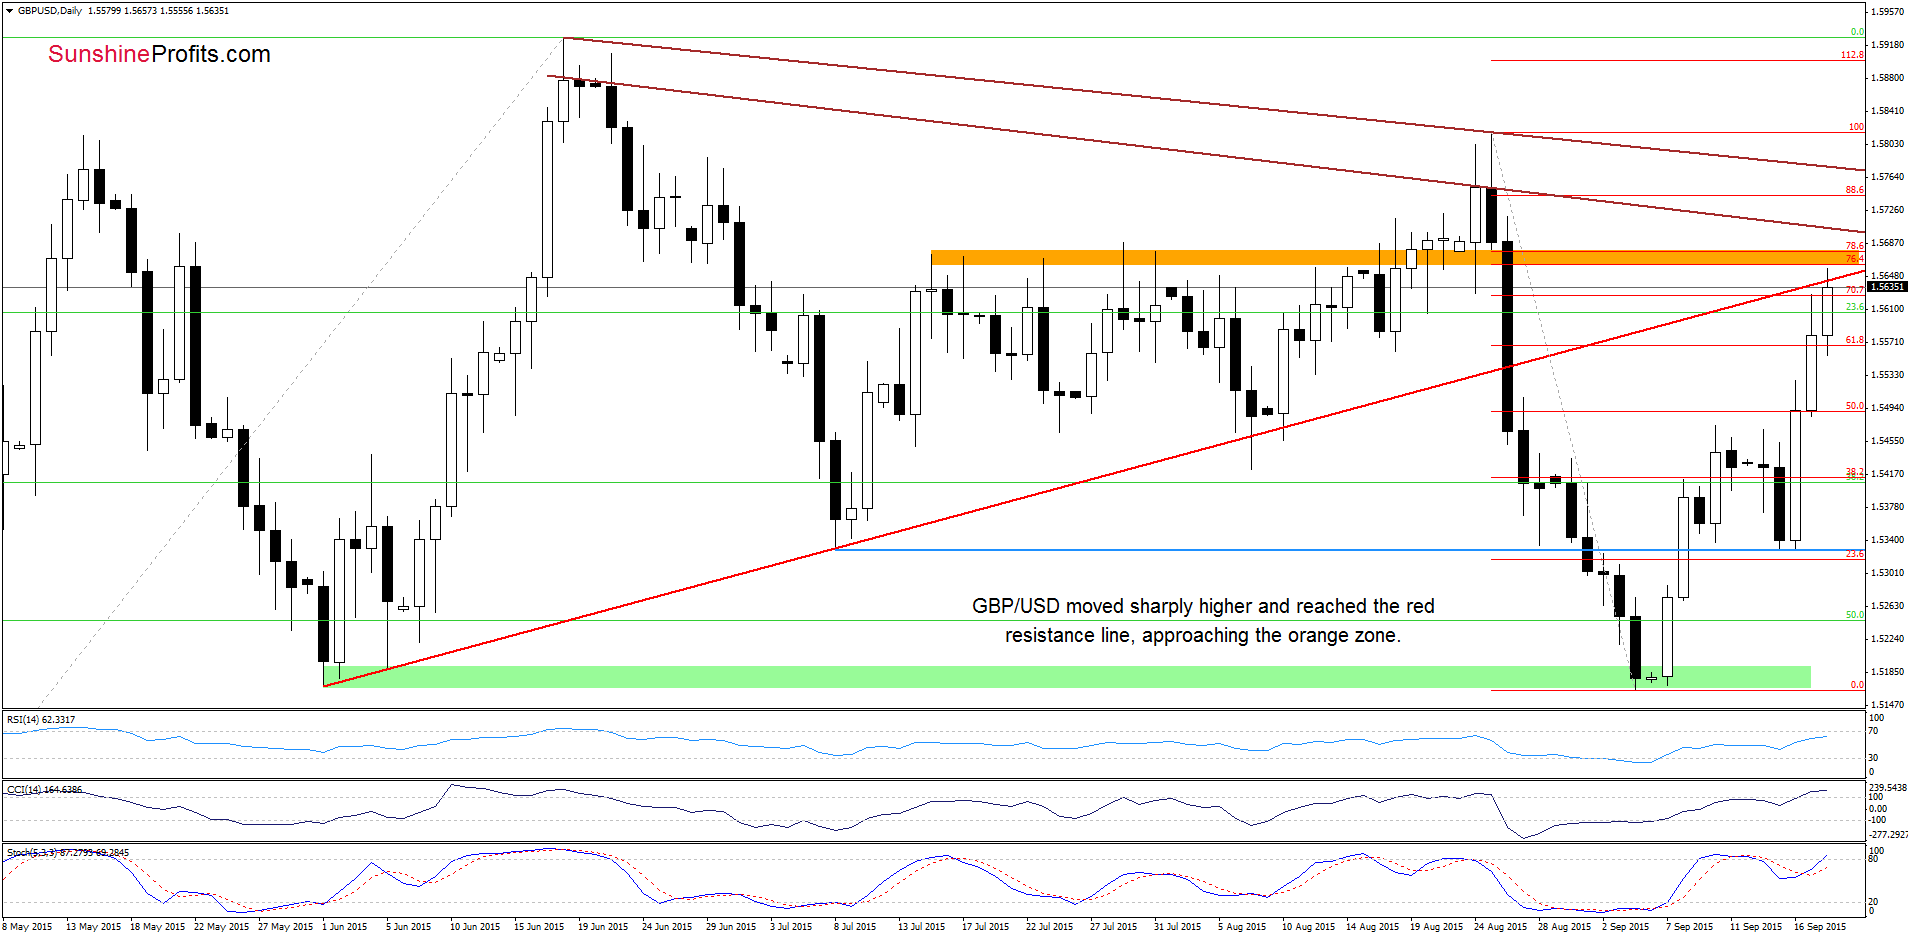
From today’s point of view we see that GBP/USD bounced off the Jul 8 low, which triggered a sharp rally. With this upward move, the pair reached the red rising resistance line and approached the orange resistance zone created by the 76.4% and 78.6% Fibonacci retracement levels. Taking this fact into account, it seems to us that the space for further rally may be limited. In our opinion, even if the pair moves little higher from here, the brown declining resistance line (based on the Jun 19 and Aug 25 opening prices) will likely stop currency bulls.
Nevertheless, to have a more complete picture of GBP/USD, let’s examine the weekly chart.
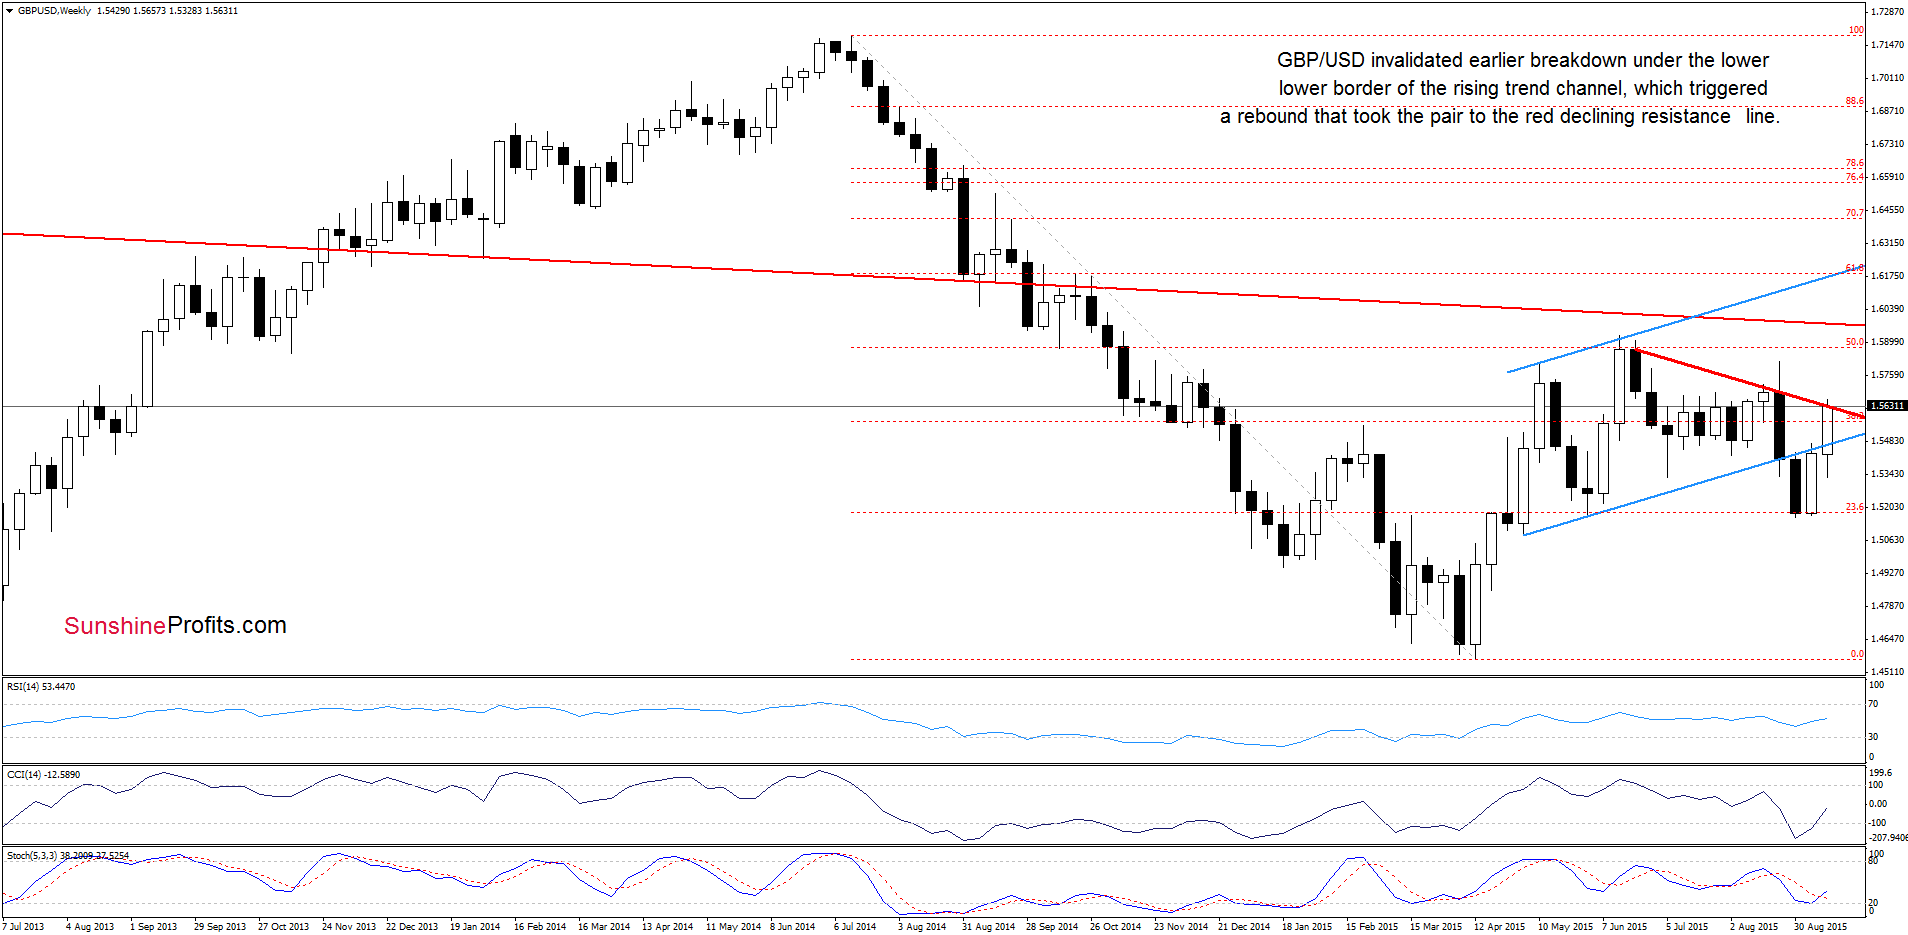
Looking at the above chart, we see that the exchange rate reached the medium-term red declining resistance line, which could encourage currency bears to act and trigger a reversal in the coming week.
Very short-term outlook: mixed with bearish bias
Short-term outlook: mixed with bearish bias
MT outlook: mixed with bearish bias
LT outlook: mixed
Trading position (short-term; our opinion): No positions are justified from the risk/reward perspective at the moment. We will keep you informed should anything change, or should we see a confirmation/invalidation of the above.
USD/JPY
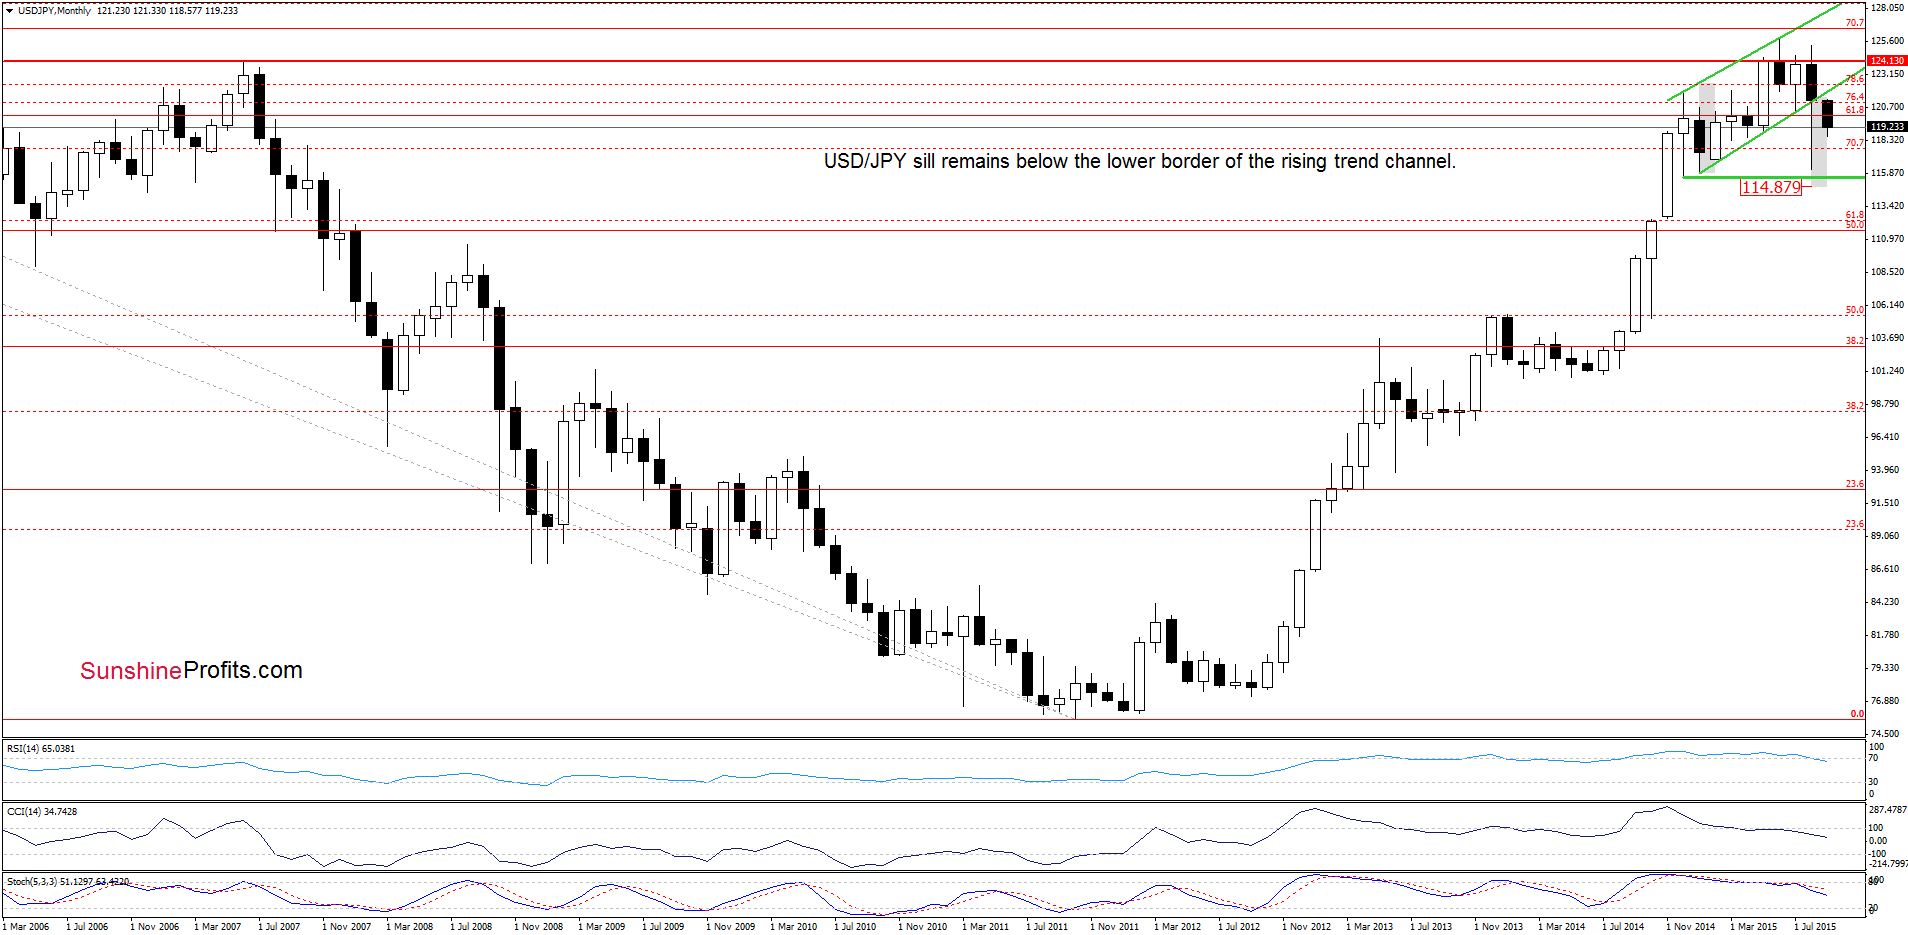
The situation in the medium-term hasn’t changed much as USD/JPY is still trading under the lower border of the rising trend channel, which suggests further deterioration.
Were are the nearest support levels? Let’s examine the daily chart and find out.
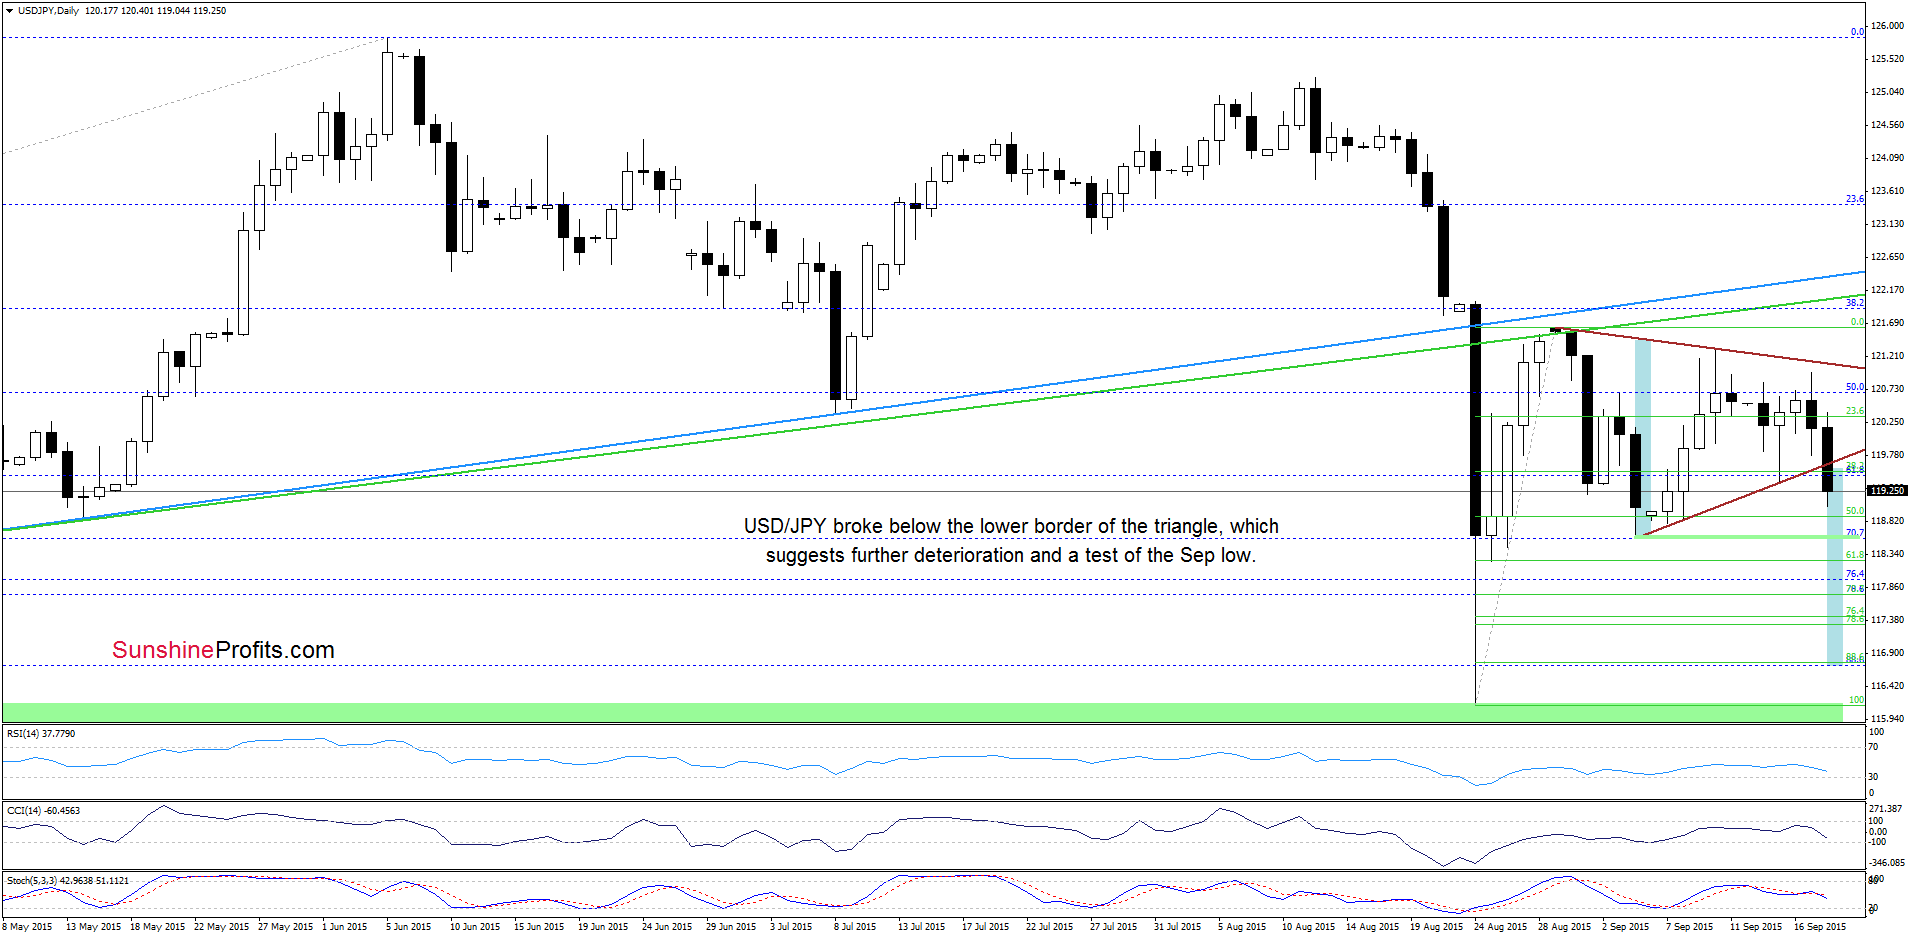
In our previous commentary on this currency pair, we wrote the following:
(…) the pair is trading in the brown triangle, which means that a breakout/breakdown (and a daily close) will indicate the direction of future moves (…) a drop below the lower line of the formation will likely trigger a test of the Sep low of 118.57.
As you see on the daily chart, the situation developed in line with the above scenario and USD/JPY declined below the lower border of the triangle, which means that our downside target would be in play in the coming days. Nevertheless, taking into account the size of the formation, we could see a decline even to around 116.71, where the size of the downward move will correspond to the height of the formation and where the 88.6% Fibonacci retracement (based on the Aug rally) is.
Very short-term outlook: bearish
Short-term outlook: bearish
MT outlook: mixed with bearish bias
LT outlook: mixed
Trading position (short-term; our opinion): No positions are justified from the risk/reward perspective at the moment. We will keep you informed should anything change, or should we see a confirmation/invalidation of the above.
USD/CAD
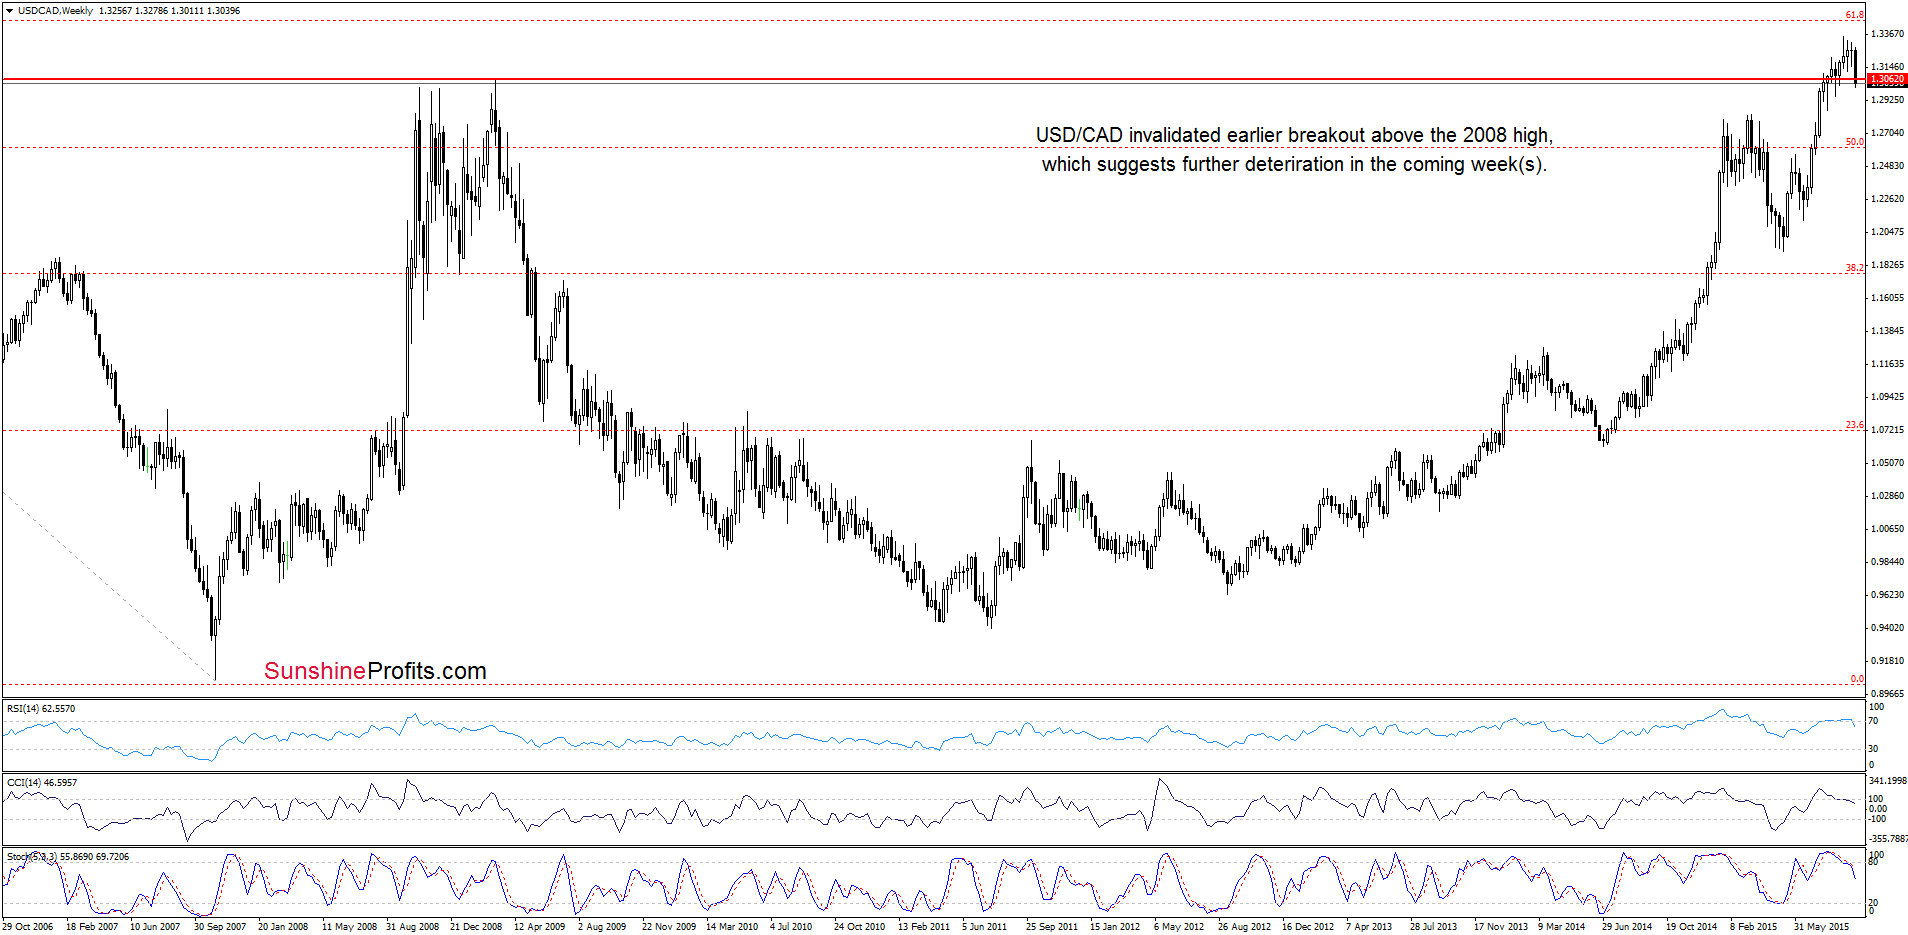
The situation in the medium-term picture has deteriorated as USD/CAD moved lower and invalidated earlier breakout above the 2008 high, which is a bearish signal that suggests further declines.
What impact did ths move have on the short-term picture? Lets check.
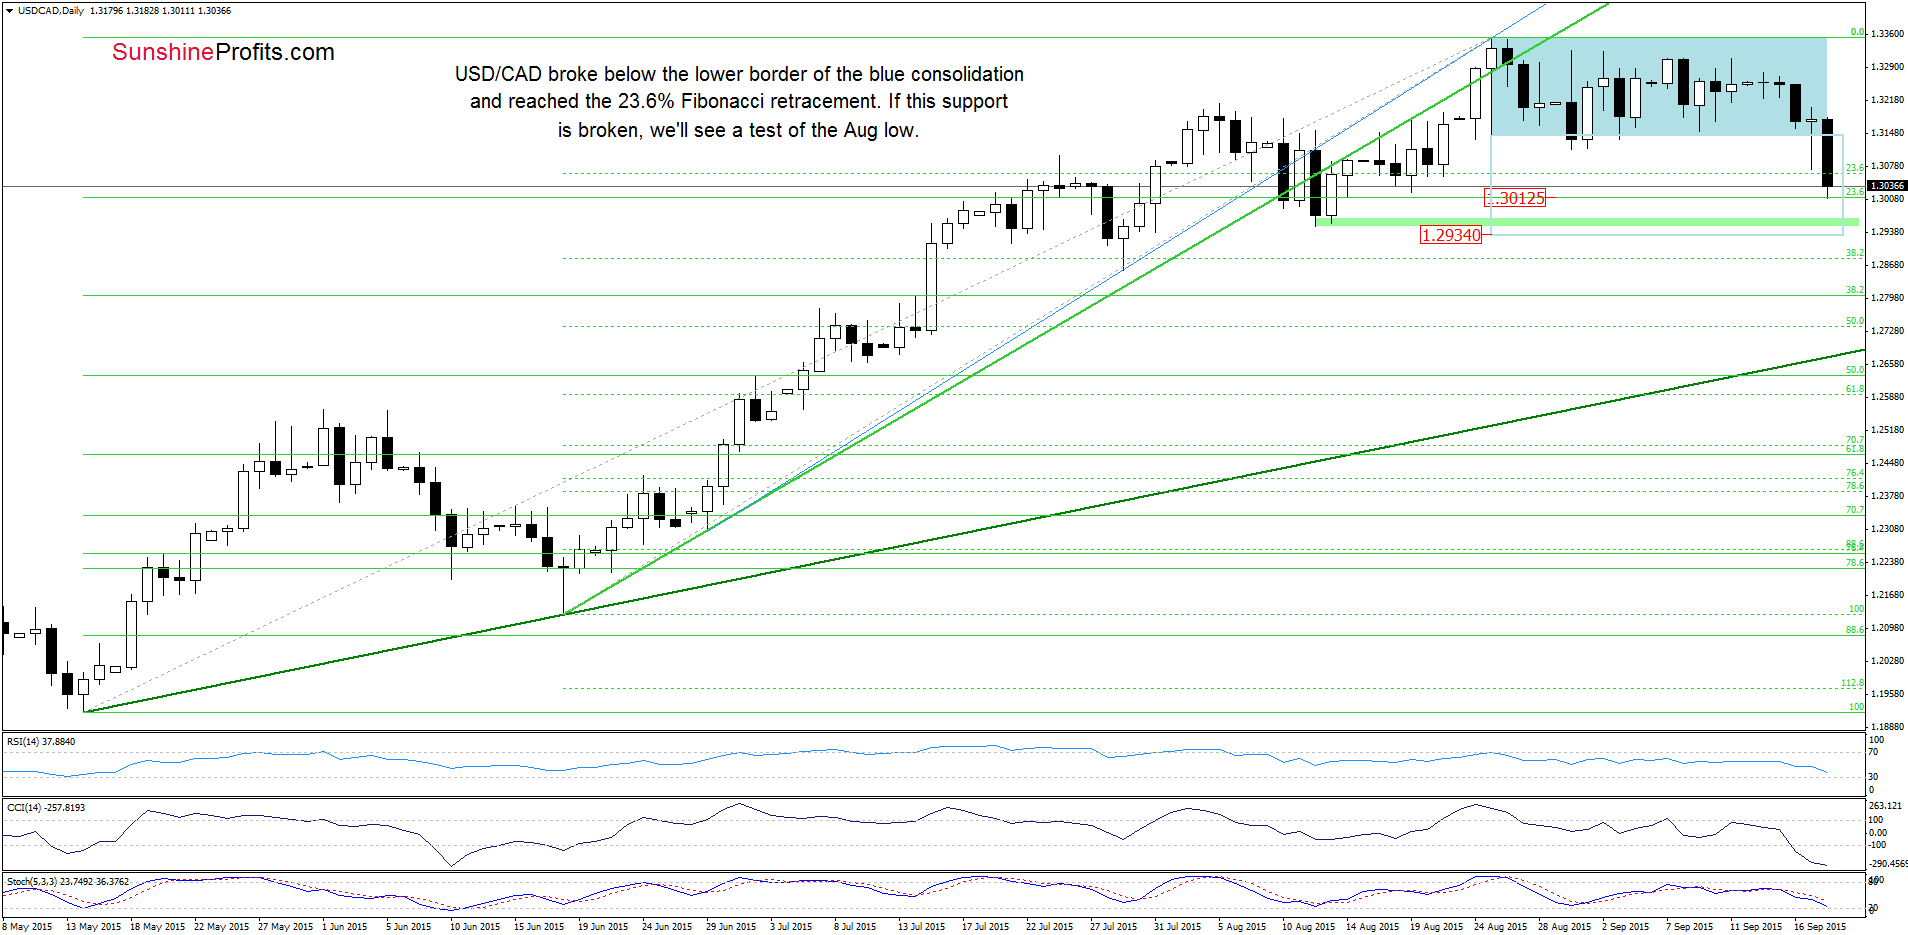
Quoting our alert posted on Sep 4:
(…) a sizable downward move is also questionable unless we see a daily closure below the lower border of the consolidation (in this case, the initial downside target would be around 1.2950-1.3015, where the bottom of the previous pullback and the 23.6% Fibonacci retracement based on the entire May-Aug rally are).
From today’s point of view we see that the situation developed in line with the above scenario and USD/CAD reached our initial downside target earlier today. However, as you see on the daily chart, currency bears managed to push the pair even lower, which suggests that we’ll see a test of the Aug low of 1.2950 in the coming day(s).
Very short-term outlook: bearish
Short-term outlook: mixed with bearish bias
MT outlook: mixed with bearish bias
LT outlook: mixed
Trading position (short-term; our opinion): No positions are justified from the risk/reward perspective at the moment. We will keep you informed should anything change, or should we see a confirmation/invalidation of the above.
USD/CHF
Yesterday, we wrote the following:
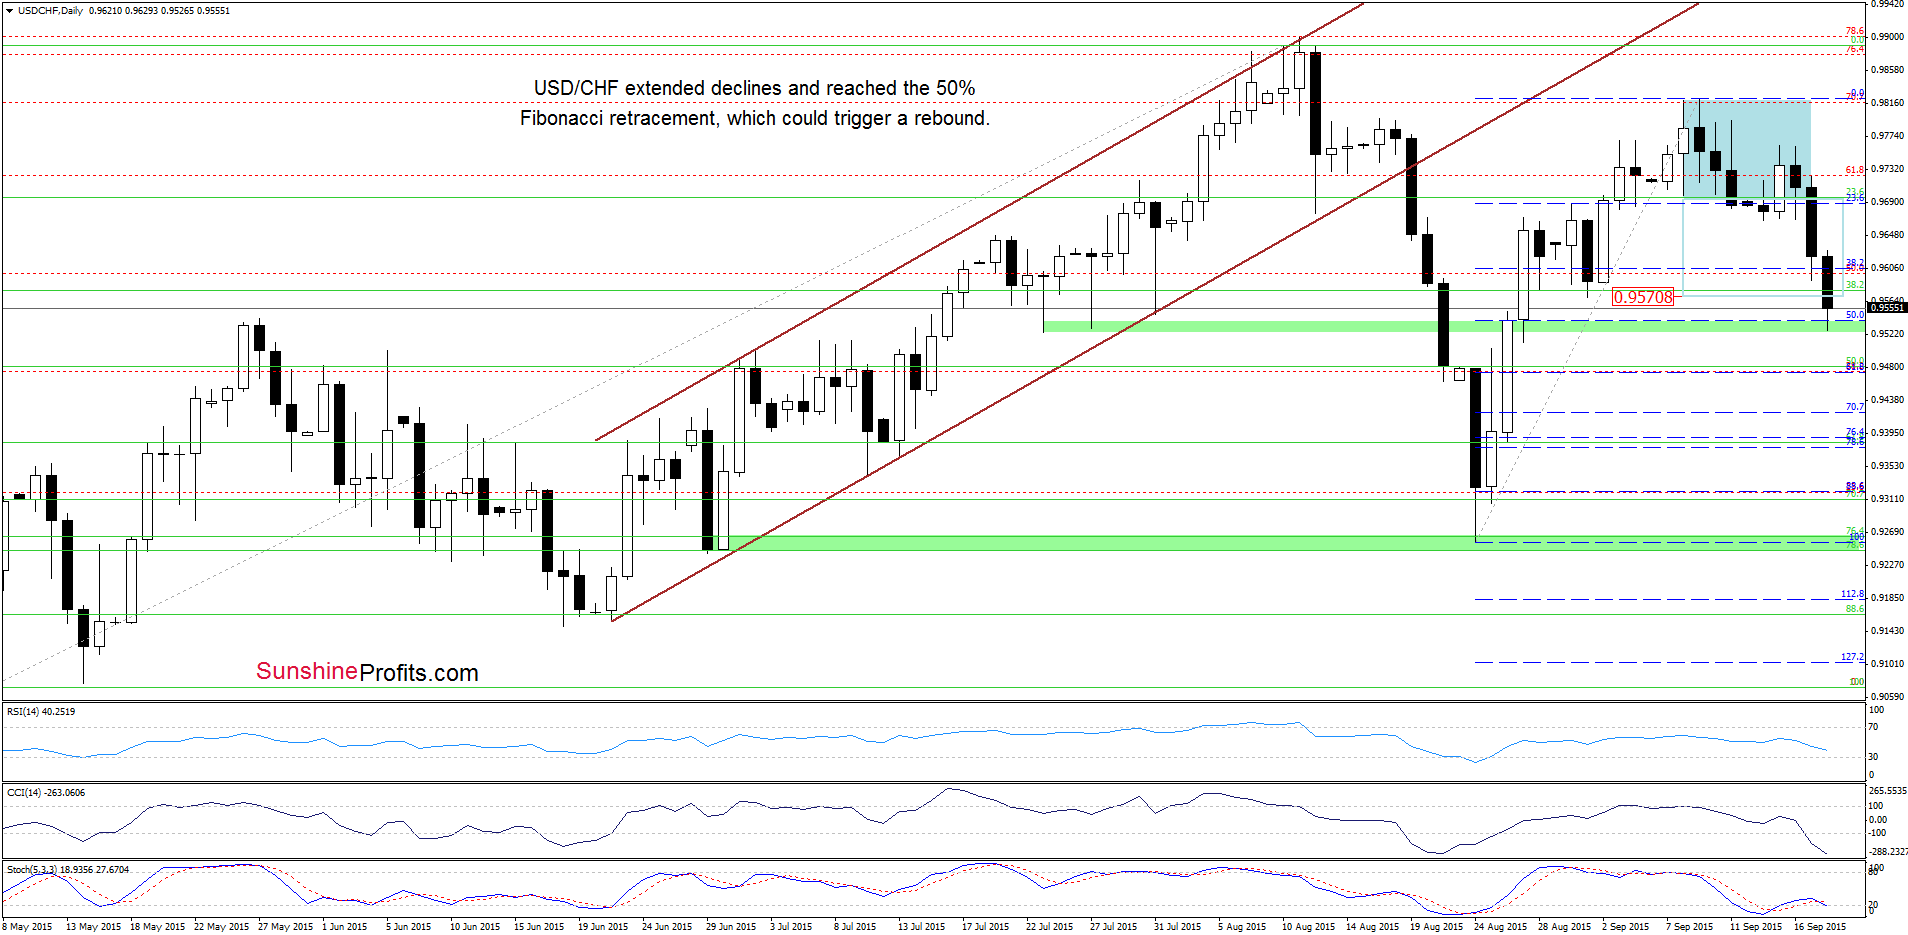
(…) USD/CHF broke below the lower border of the consolidation, which suggests further deterioration and a drop to around 0.9570, where the size of the downward move will correspond to the height of the formation and where the Sep low is. Nevertheless, this scenario will be more reliable if the pair closes the day under this week’s low of 0.9666.
As you see on the daily chart, currency bears pushed the pair lower as we had expected. With this downward move, USD/CHF not only reached our downside target, but also slipped to the 50% Fibonacci retracement and the green support zone, which could trigger a rebound from here in the coming day(s).
However, what could happen if we see a breakdown under this support? Let’s take a closer look at the weekly chart and find out.
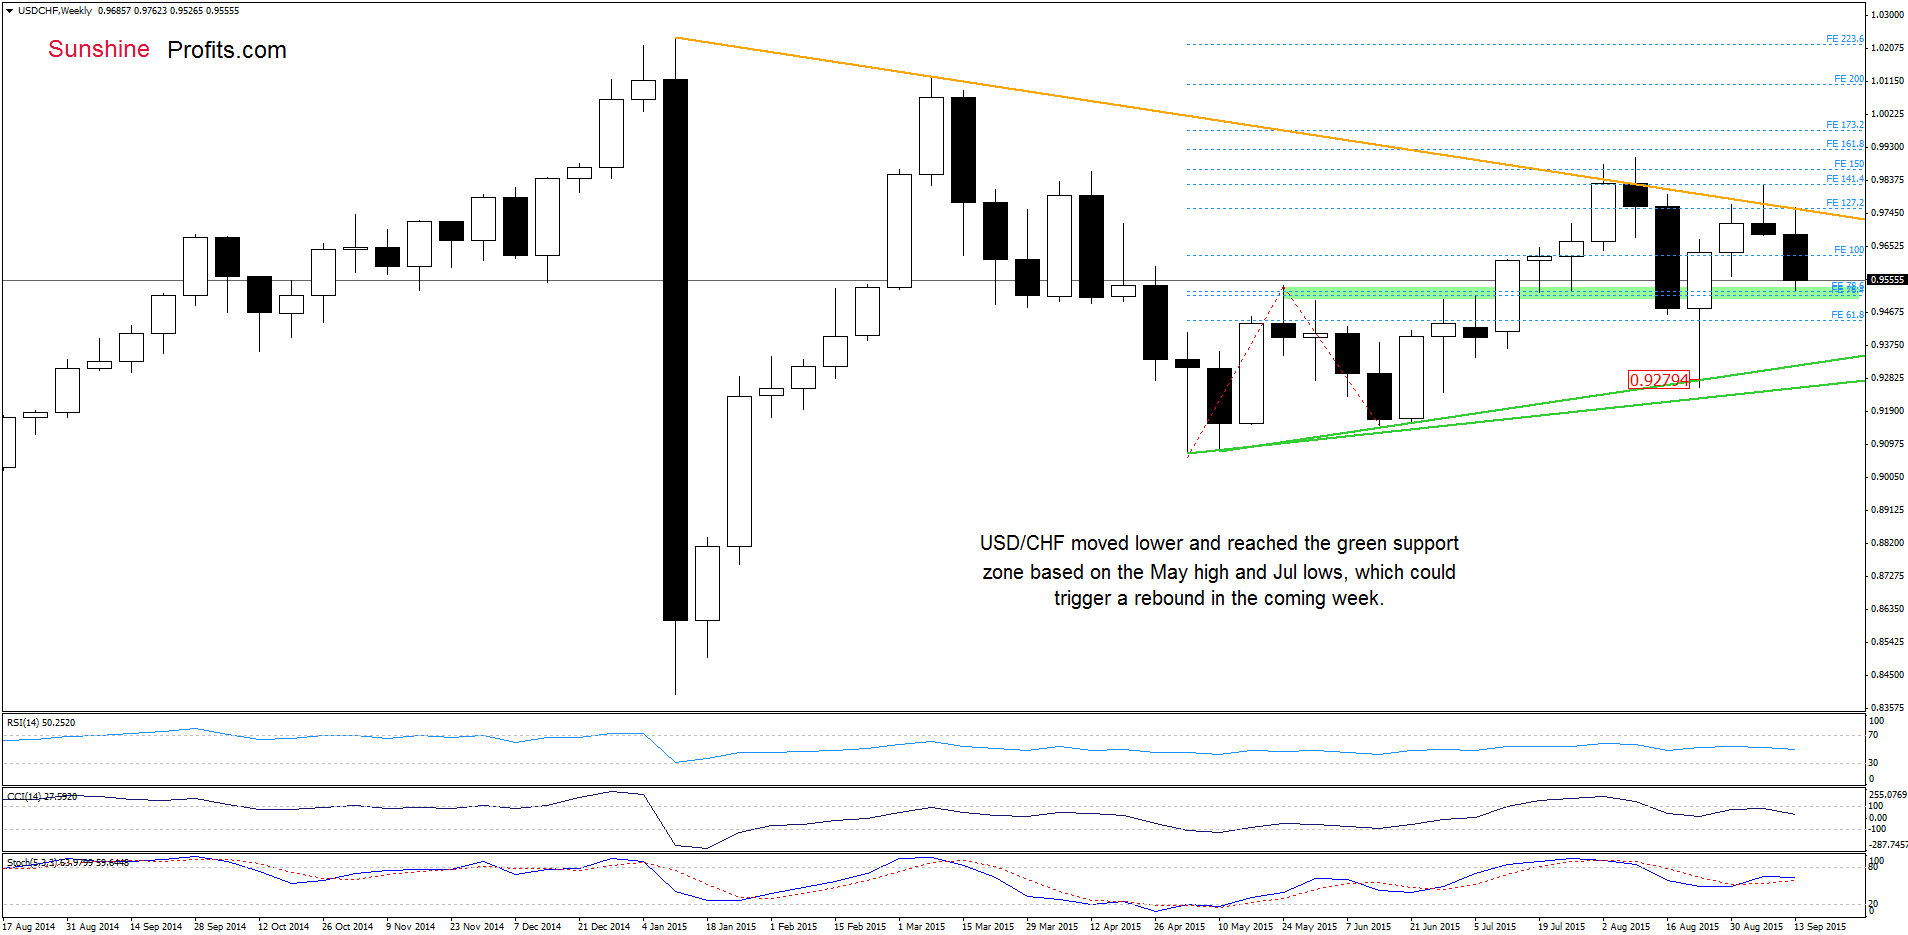
On the above chart, we see that USD/CHF reached the green support zone based on the May high and Jul lows, whch could trigger a rebound in the coming week. However if it is broken, we may see a decline even to around 0.9315, where the medium-term upper green line is.
Very short-term outlook: mixed
Short-term outlook: mixed
MT outlook: mixed
LT outlook: mixed
Trading position (short-term; our opinion): No positions are justified from the risk/reward perspective at the moment. We will keep you informed should anything change, or should we see a confirmation/invalidation of the above.
AUD/USD
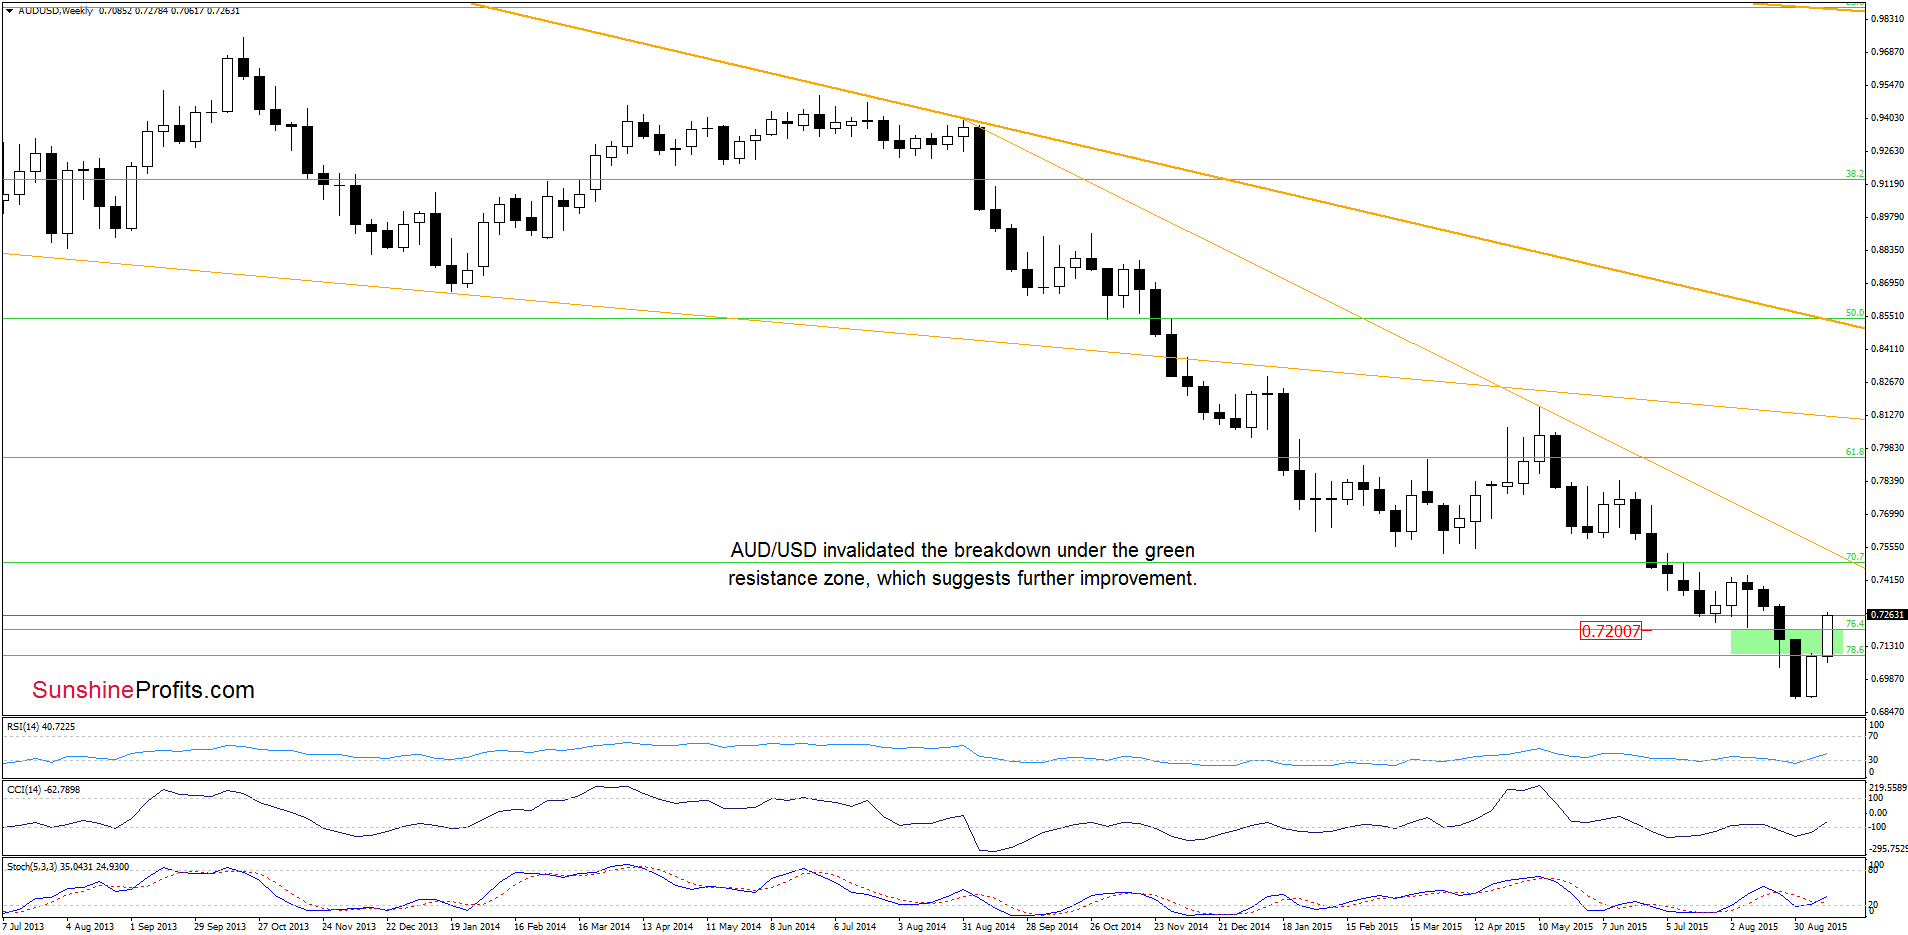
The situation in the medium term has improved as AUD/USD extended gains and invalidated earlier breakdown under the green support zone, which is a positive signal that suggests further improvement.
How high could the exchange rate go? Let’s examine the daily chart and find out.
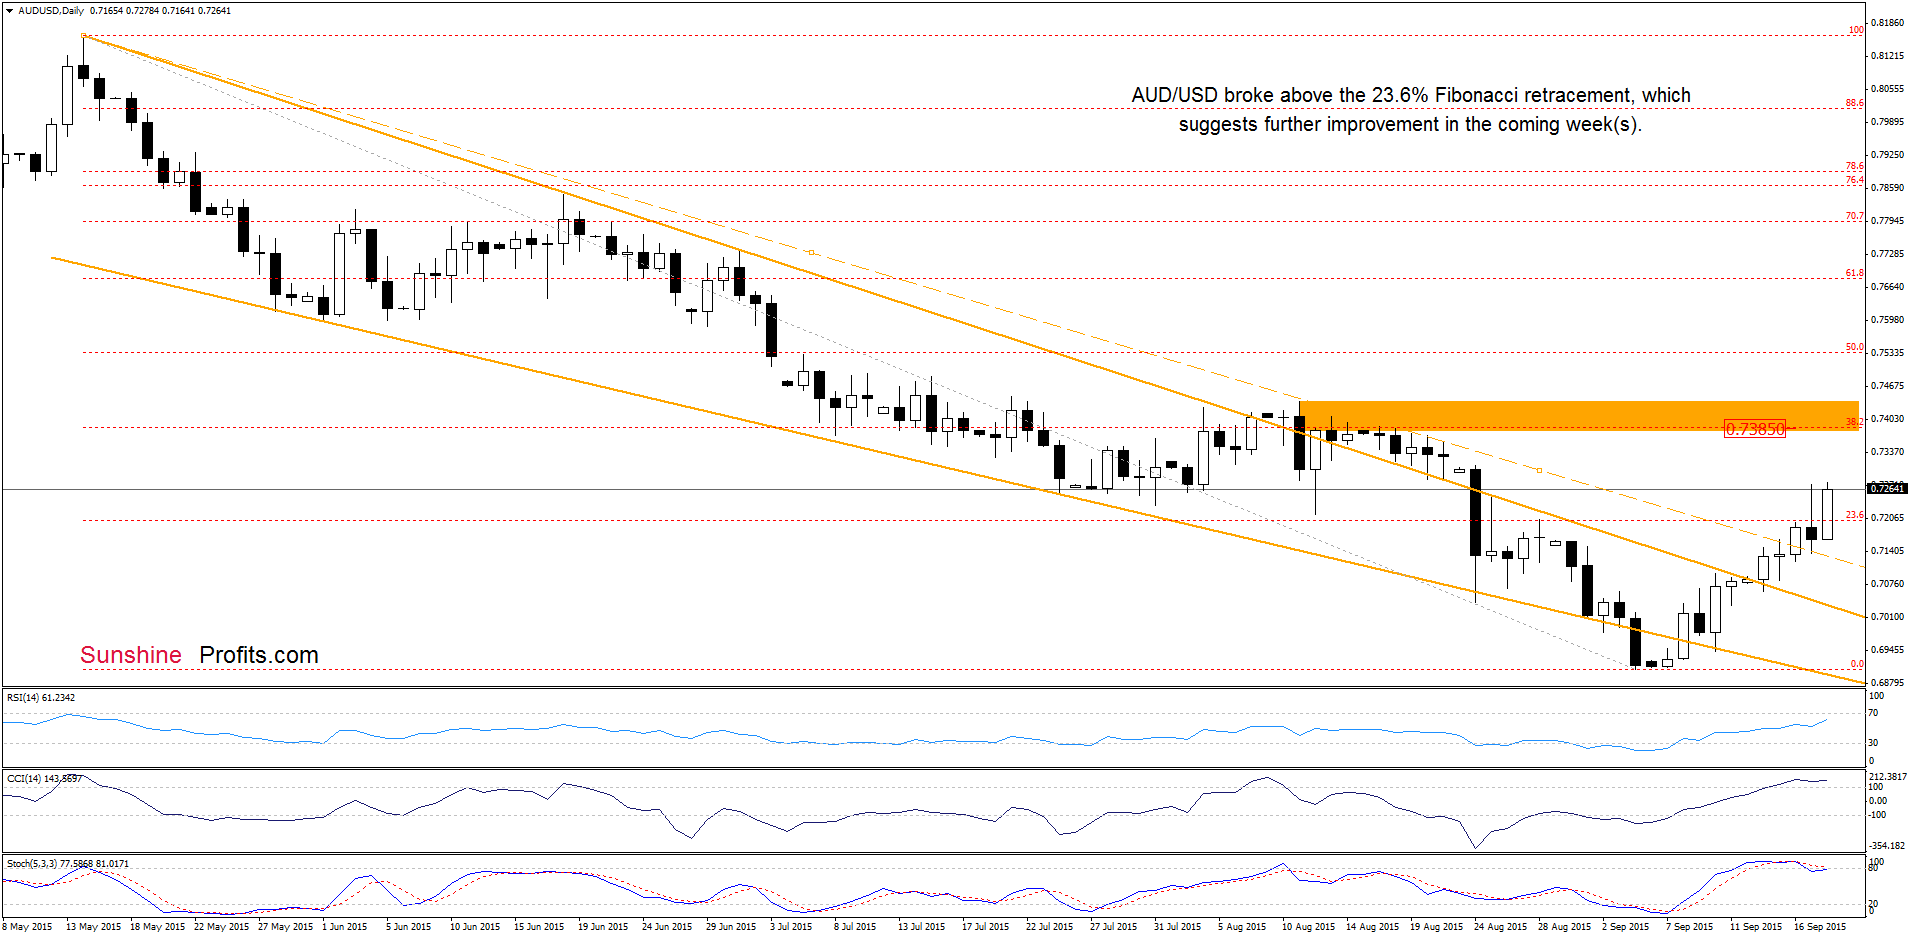
On the daily chart we see that AUD/USD closed Wednesday’s session above the orange resistance dashed line, which triggered further improvement and a breakout above the 23.6% Fibonacci retracement earlier today. Taking this positive event and the medium-term picture into account, we it seems that the pair will move higher in the coming days. If we see such price action, the initial upside target would be around 0.7385, where the orange resistance zone is. Nevertheless, please keep in mind that the current position of the indicators suggests that reversal might be just around the corner.
Very short-term outlook: mixed with bullish bias
Short-term outlook: mixed with bullish bias
MT outlook: mixed
LT outlook: mixed
Trading position (short-term; our opinion): No positions are justified from the risk/reward perspective at the moment. We will keep you informed should anything change, or should we see a confirmation/invalidation of the above.
Thank you.
Nadia Simmons
Forex & Oil Trading Strategist
Przemyslaw Radomski, CFA
Founder, Editor-in-chief
Gold & Silver Trading Alerts
Forex Trading Alerts
Oil Investment Updates
Oil Trading Alerts

