

Earlier today, data showed that the euro zone consumer price index dropped to 0.1% from an initial estimate of 0.2%, while core inflation (without volatile food and energy prices) was unchanged at 0.3%. These weak numbers fueled concerns that the ECB may expand its quantitative easing program and pushed EUR/USD lower. As a result, the pair extended yesterday’s losses and invalidated earlier breakout above the short-term resistance. What does it mean for the exchange rate?
In our opinion the following forex trading positions are justified - summary:
- EUR/USD: short (a stop-loss order at 1.1445; the downside target around 1.0938)
- GBP/USD: none
- USD/JPY: none
- USD/CAD: none
- USD/CHF: none
- AUD/USD: none
EUR/USD
Yesterday, we wrote the following:
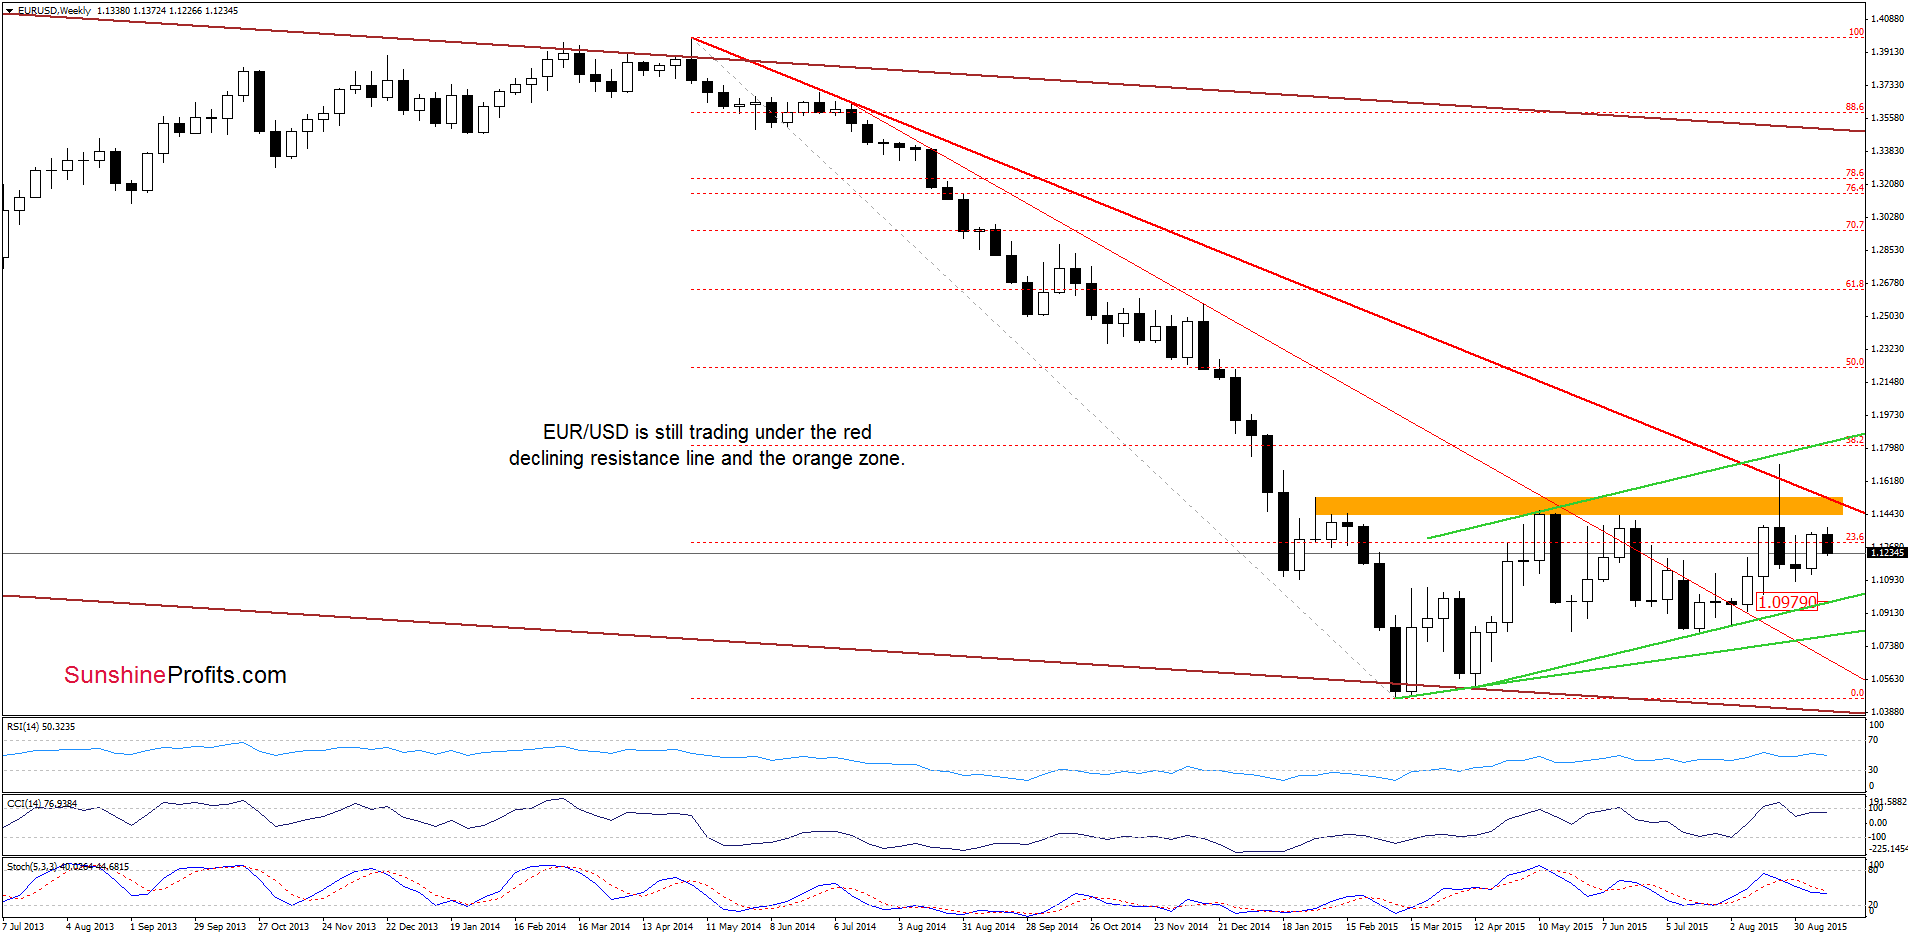
(…) EUR/USD extended gains and reached the solid orange resistance zone (…), which triggered a pullback. Taking this fact into account, and combining it with the current position of the indicators (the CCI and Stochastic Oscillator generated sell signals), it seems that currency bears will try to push the pair lower once again in the coming day(s). If this is the case, and the exchange rate declines from here, the first downside target would be around 1.1264, where the previously-broken green support line is.
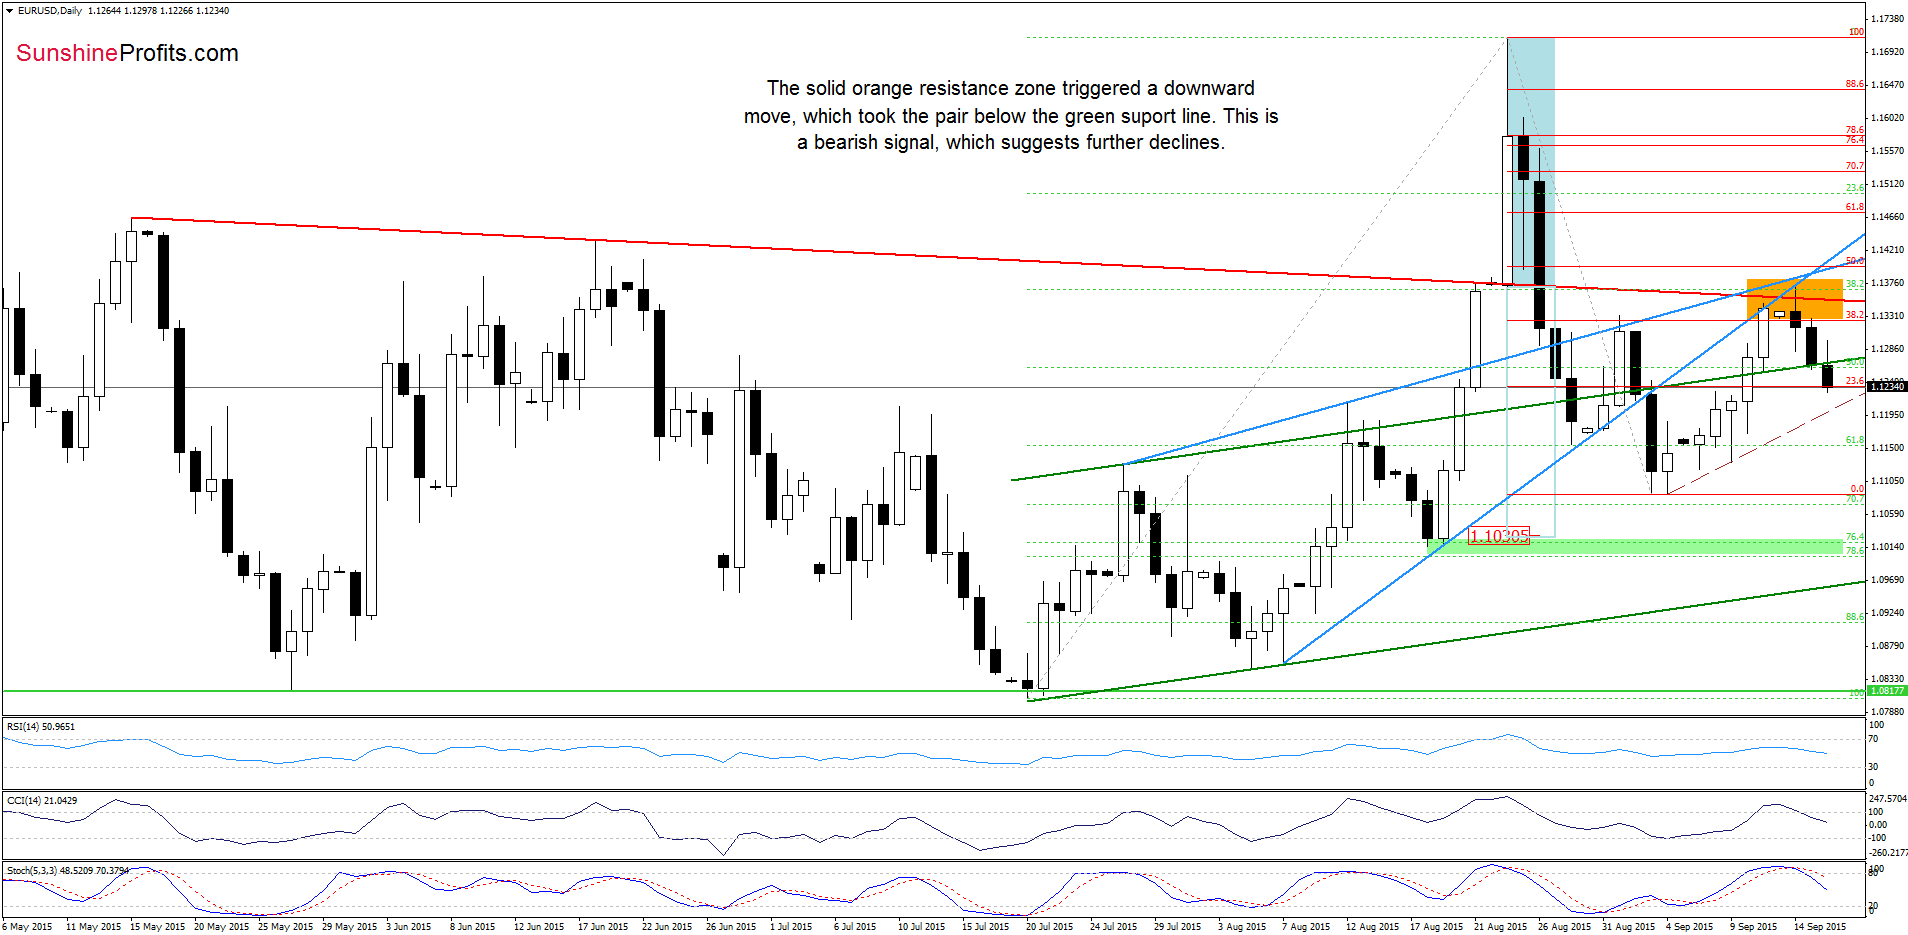
Looking at the daily chart we see that currency bears not only took EUR/USD to our initial downside target, but also managed to push the air below it. In this way, the exchange rate invalidated earlier breakout above the green line, which in combination with sell signals generated by the indicators, suggests lower values of EUR/USD in the coming days (this scenario will be even more likely if we see a daily close below the green line). In our opinion, the current decline will accelerate if the pair drops under the brown dashed support line (currently around 1.1200). If we see such price action, the next downside target would be the Sep low of 1.1086.
Very short-term outlook: bearish
Short-term outlook: bearish
MT outlook: mixed with bearish bias
LT outlook: mixed
Trading position (short-term; our opinion): Short positions with a stop-loss order at 1.1445 are justified from the risk/reward perspective. The downside target around 1.0938. We will keep you informed should anything change, or should we see a confirmation/invalidation of the above.
USD/JPY
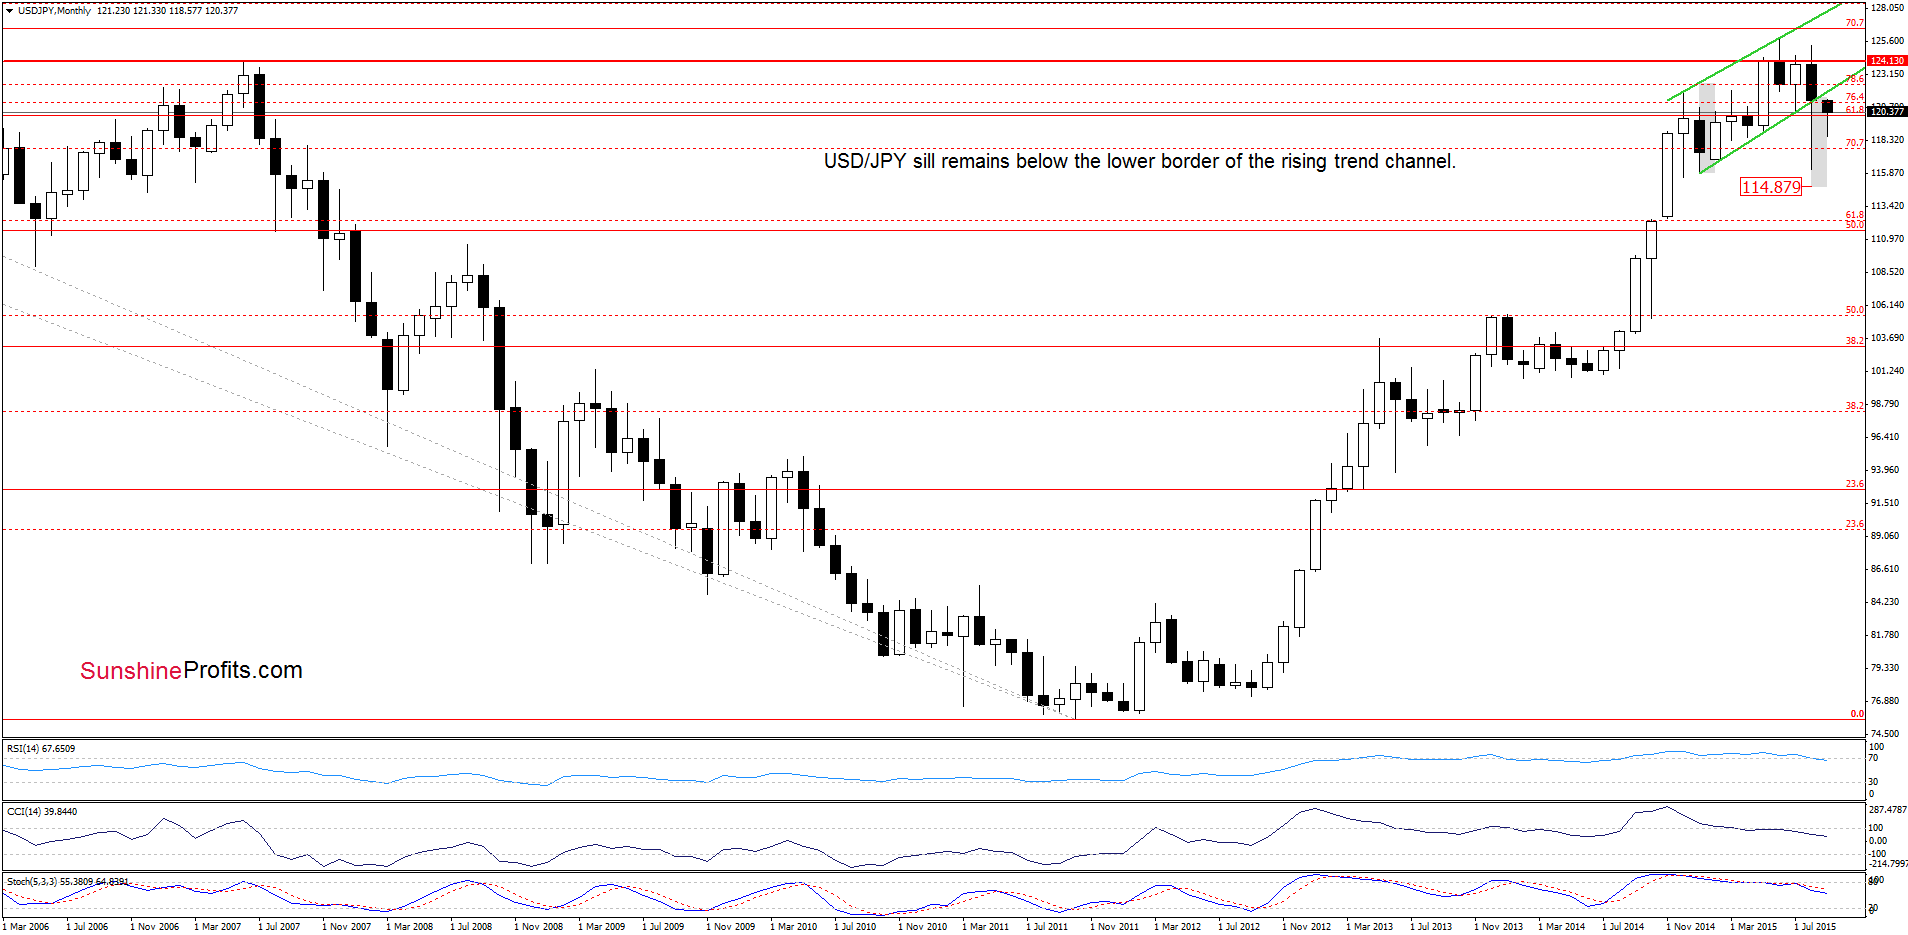
The situation in the medium-term hasn’t changed much as USD/JPY is still trading under the lower border of the rising trend channel. Today, we’ll focus on the very short-term picture.
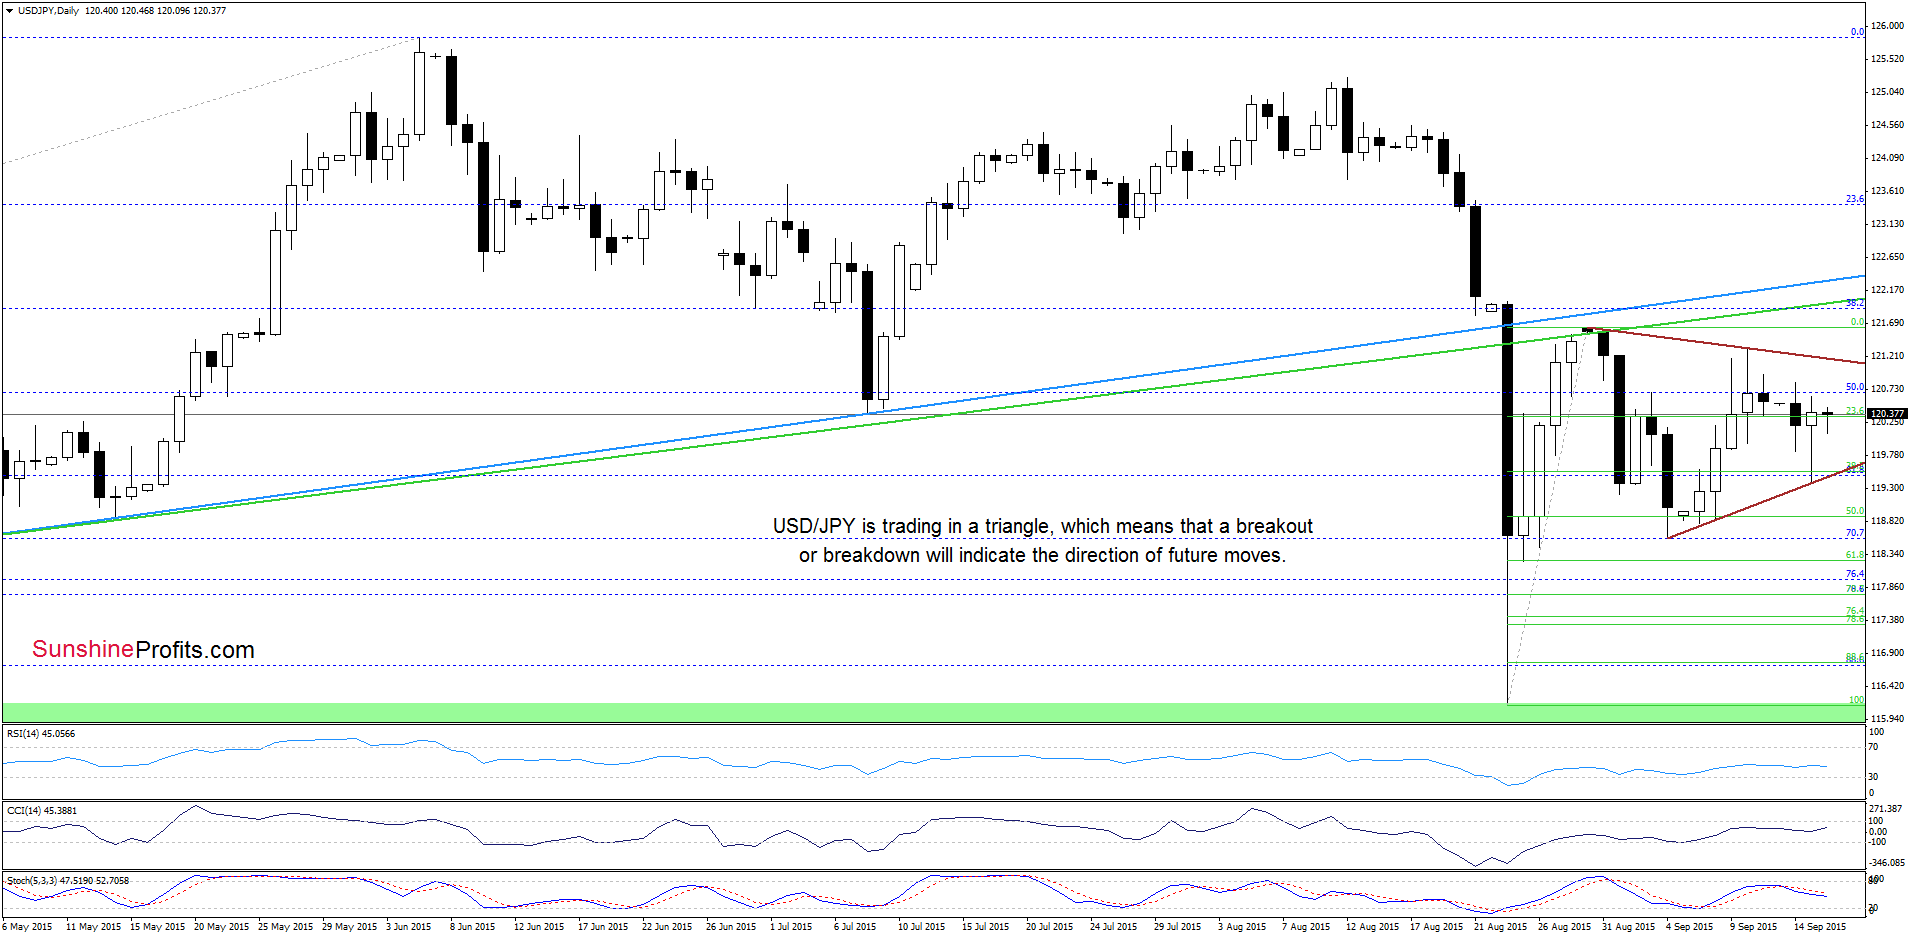
As you see on the daily chart although USD/JPY moved little lower in recent days, the pair is trading in the brown triangle, which means that a breakout/breakdown (and a daily close) will indicate the direction of future moves. If currency bulls win, we’ll see an increase to the Aug 30 and the previously-broken green resistance line (this area is also reinforced by the lower border of the green rising trend channel marked on the long-term chart). On the other hand, a drop below the lower line of the formation will likely trigger a test of the Sep low of 118.57.
Very short-term outlook: mixed
Short-term outlook: mixed
MT outlook: mixed
LT outlook: mixed
Trading position (short-term; our opinion): No positions are justified from the risk/reward perspective at the moment. We will keep you informed should anything change, or should we see a confirmation/invalidation of the above.
AUD/USD
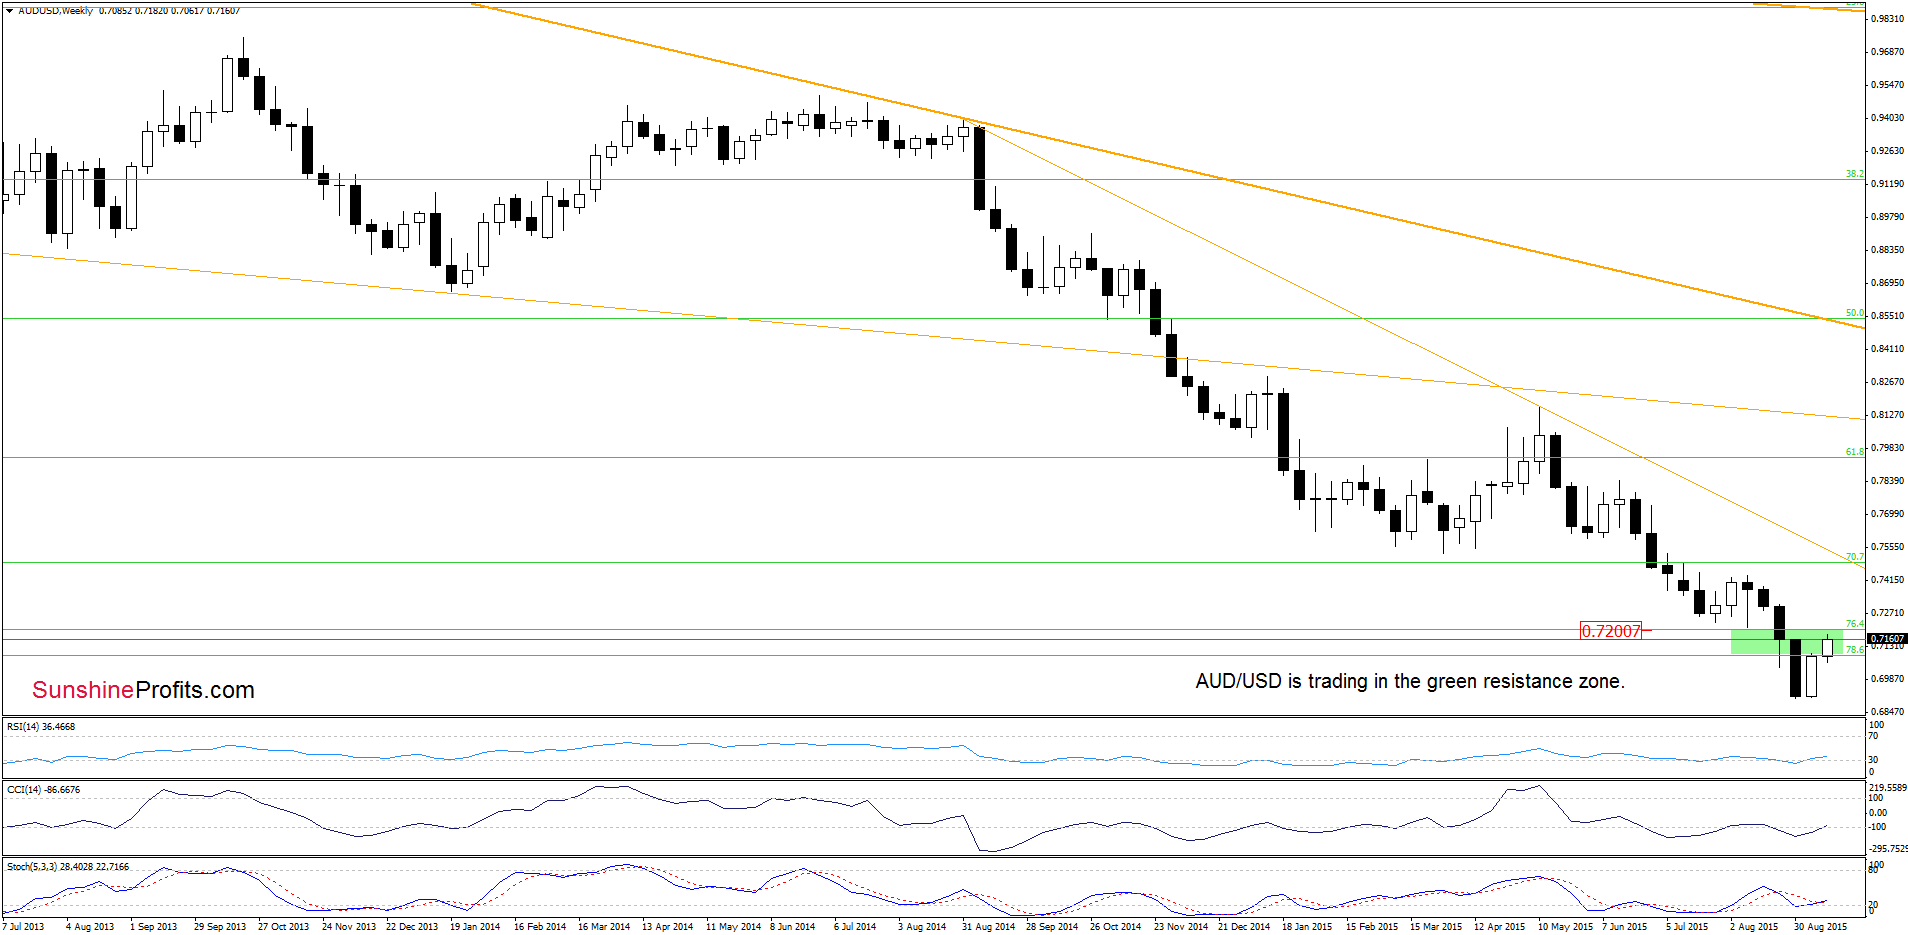
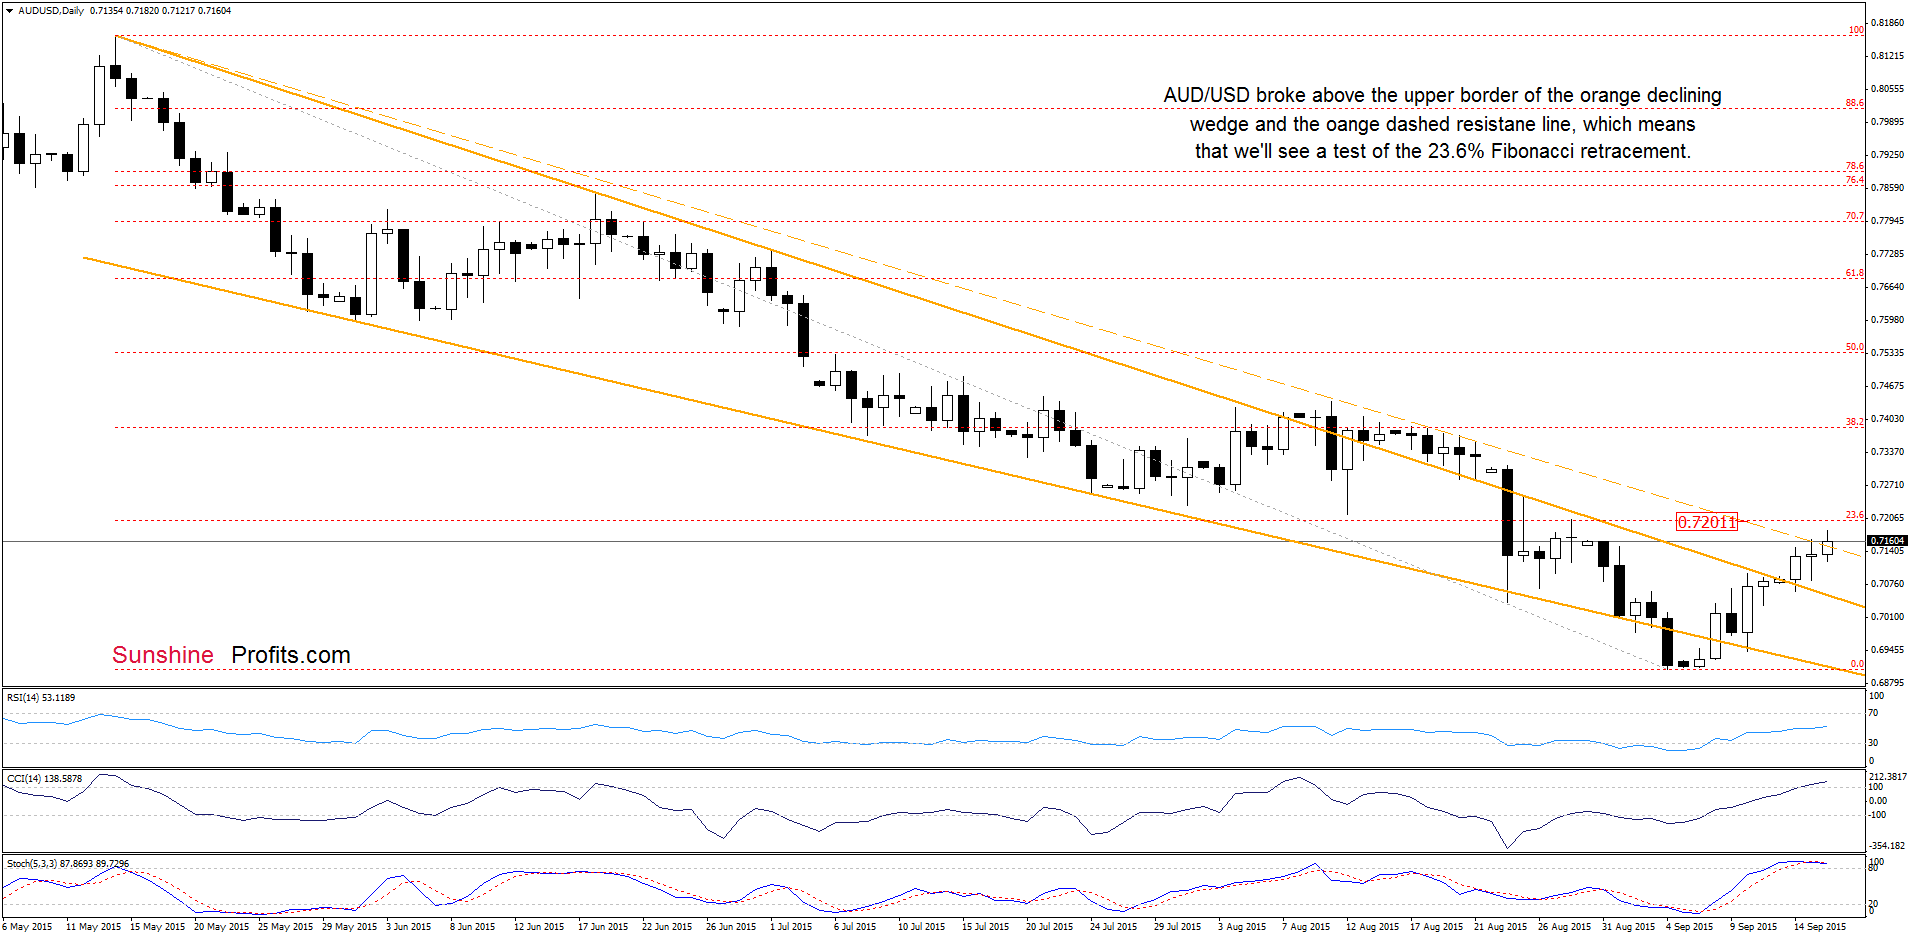
On Friday, we wrote:
(…) Taking into account the current position of the indicators, it seems that we’ll see another attempt to move higher in the coming week. If AUD/USD successfully breaks above the orange resistance line, the next upside target would be around 0.7200, where the orange resistance dashed line and the 23.6% Fibonacci retracement (based on the entire May-Sep declines) are (…).
From today’s point of view we see that the situation developed in line with the above scenario and AUD/USD climbed above the orange resistance dashed line. Although this is a bullish signal, which suggests further improvement and a test of the nearest Fibonacci retracement, we should keep in mind that the current position of the daily indicators (the CCI and Stochastic Oscillator are overbought) and the medium-term picture (the exchange rate didn’t invalidate the breakdown under the green zone based on the 76.4% and 78.6% Fibonacci retracement levels, which serves as the key resistance at the moment) suggest that reversal is just around the corner.
Very short-term outlook: mixed with bearish bias
Short-term outlook: mixed with bearish bias
MT outlook: mixed
LT outlook: mixed
Trading position (short-term; our opinion): No positions are justified from the risk/reward perspective at the moment. We will keep you informed should anything change, or should we see a confirmation/invalidation of the above.
Thank you.
Nadia Simmons
Forex & Oil Trading Strategist
Przemyslaw Radomski, CFA
Founder, Editor-in-chief
Gold & Silver Trading Alerts
Forex Trading Alerts
Oil Investment Updates
Oil Trading Alerts

