

Earlier today, the Australian Bureau of Statistics showed that the country's gross domestic product increased by 0.2% in the second quarter, missing expectations for a 0.4% growth. Additionally, on a yearly basis, Australia's GDP rose by 2.0% also disappointing expectations for a 2.2% gain. Thanks to these numbers, AUD/USD hit a fresh multi-year low and slipped to the medium-term support line. Will it stop further deterioration?
In our opinion the following forex trading positions are justified - summary:
- EUR/USD: short (a stop-loss order at 1.1445; the downside target around 1.0938)
- GBP/USD: none
- USD/JPY: none
- USD/CAD: none
- USD/CHF: none
- AUD/USD: none
EUR/USD
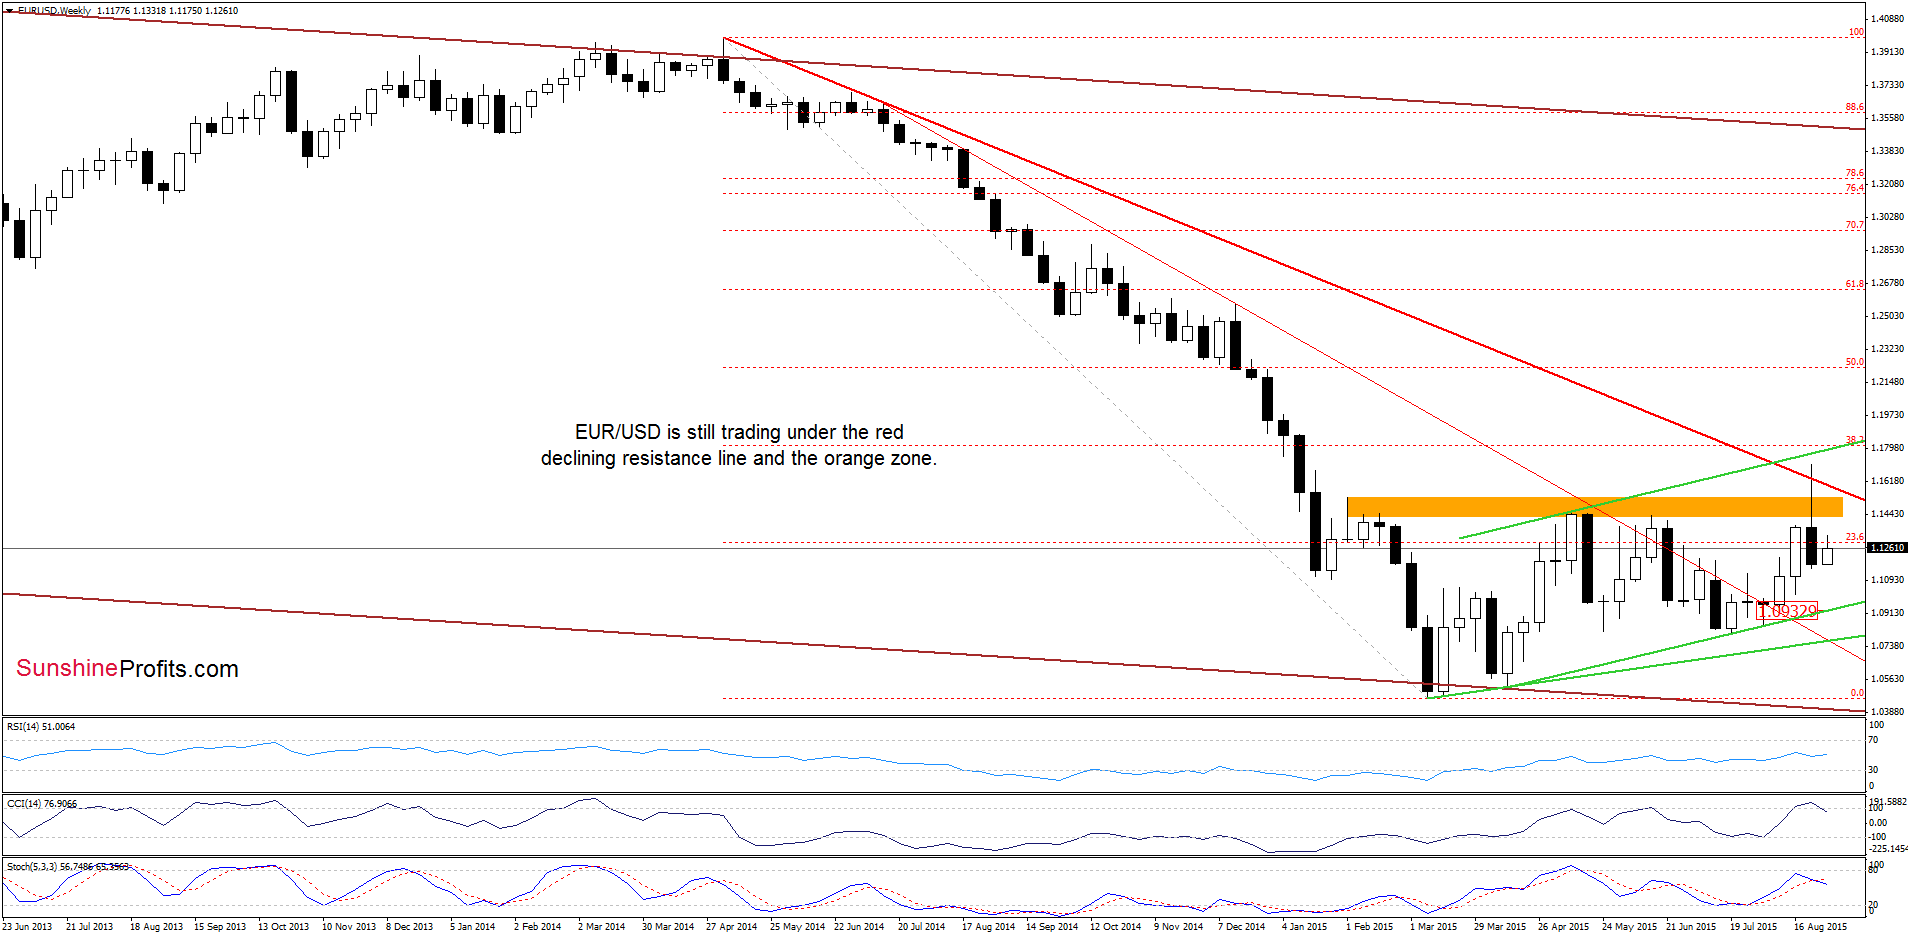
The situation in the medium-term hasn’t changed much as EUR/USD is still trading well below the long-term red line and the previously-broken orange resistance zone, which suggests lower values of the exchange rate in the coming week (especially when we factor in sell signals generated by the indicators).
Having said that, let’s focus on the very short-term picture.
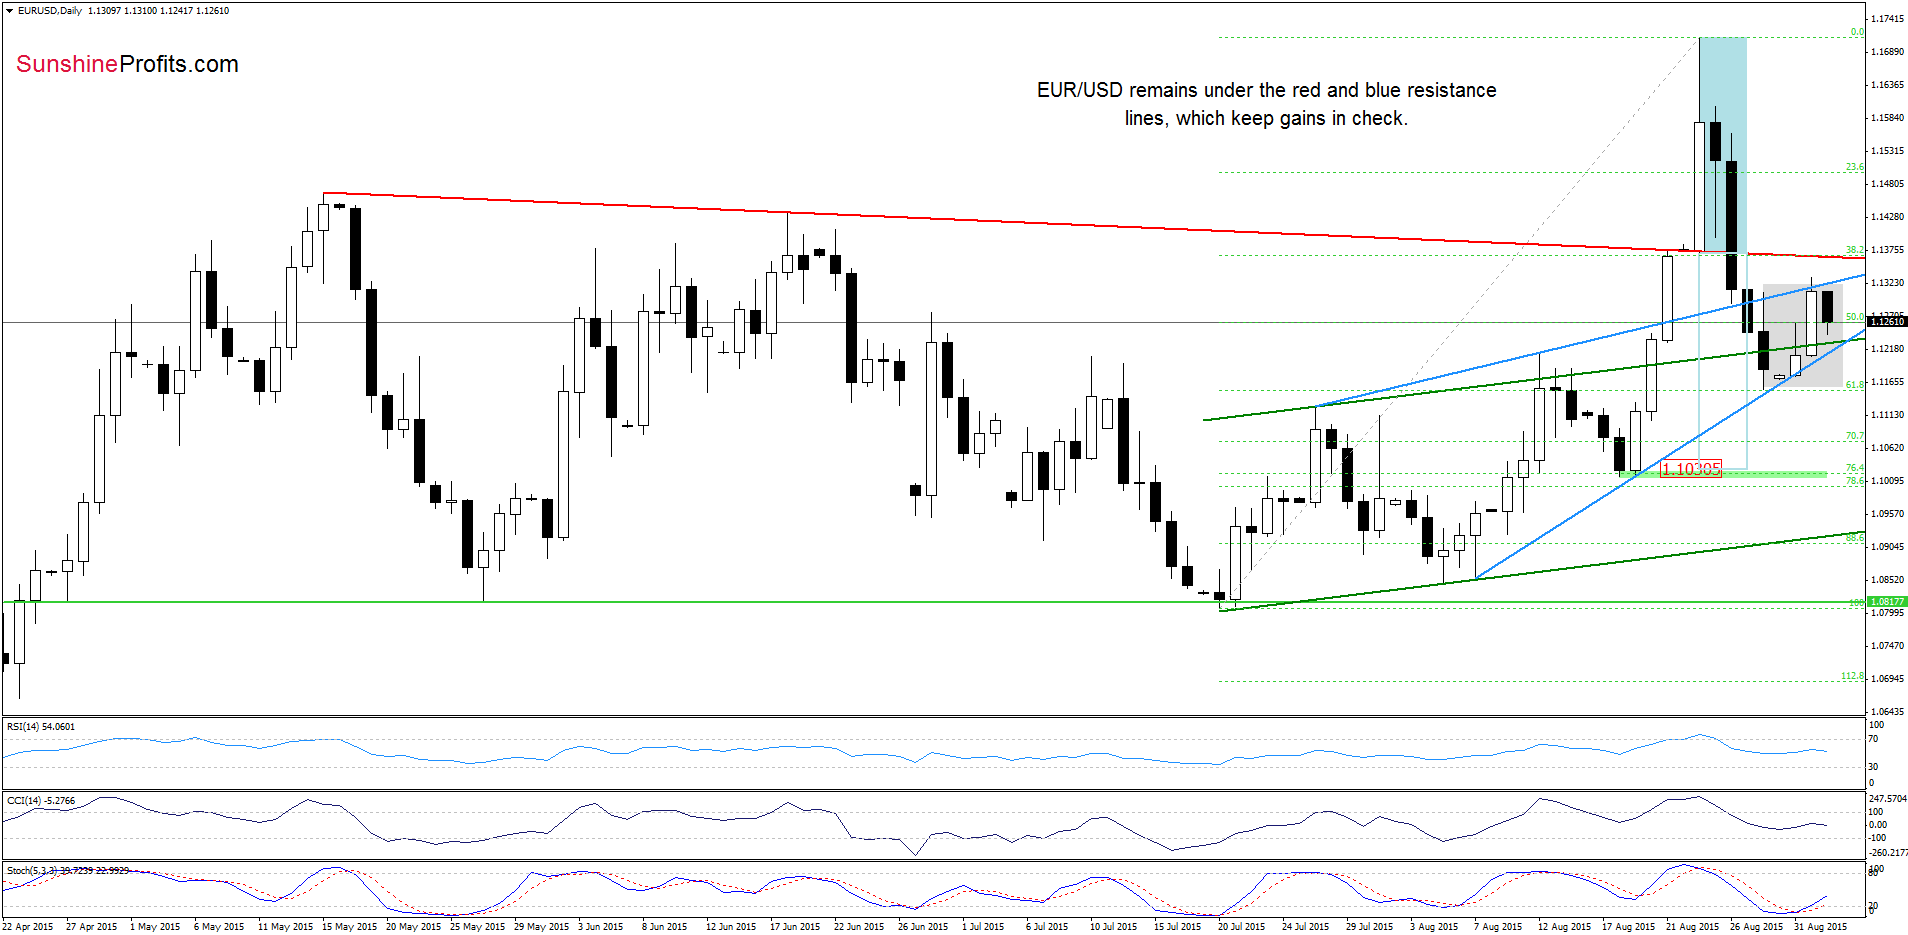
Looking at the daily chart we see that the combination of the blue resistance line (the upper border of the rising wedge) and the upper line of the grey consolidation continue to keep gains in check. Therefore, our last commentary on this currency pair is up-to-date:
(…) the exchange rate is still trading under the red declining resistance line, which together suggests that as long as there is no invalidation of the breakdown under all these lines another attempt to move lower is more likely than not. In our opinion, if the pair drops under the lower line of the rising wedge (marked with blue), the next downside target would be around 1.1030, where the size of the downward move will correspond to the height of the blue consolidation and where the mid-Aug lows are.
Very short-term outlook: bearish
Short-term outlook: bearish
MT outlook: mixed with bearish bias
LT outlook: mixed
Trading position (short-term; our opinion): Short positions with a stop-loss order at 1.1445 are justified from the risk/reward perspective. The downside target around 1.0938. We will keep you informed should anything change, or should we see a confirmation/invalidation of the above.
USD/CHF
The medium-term picture hasn’t changed much as USD/CHF is trading between the orange resistance line and the green support line, slightly below the last week’s high.
Will the daily chat give us more clues about future moves? Let’s check.
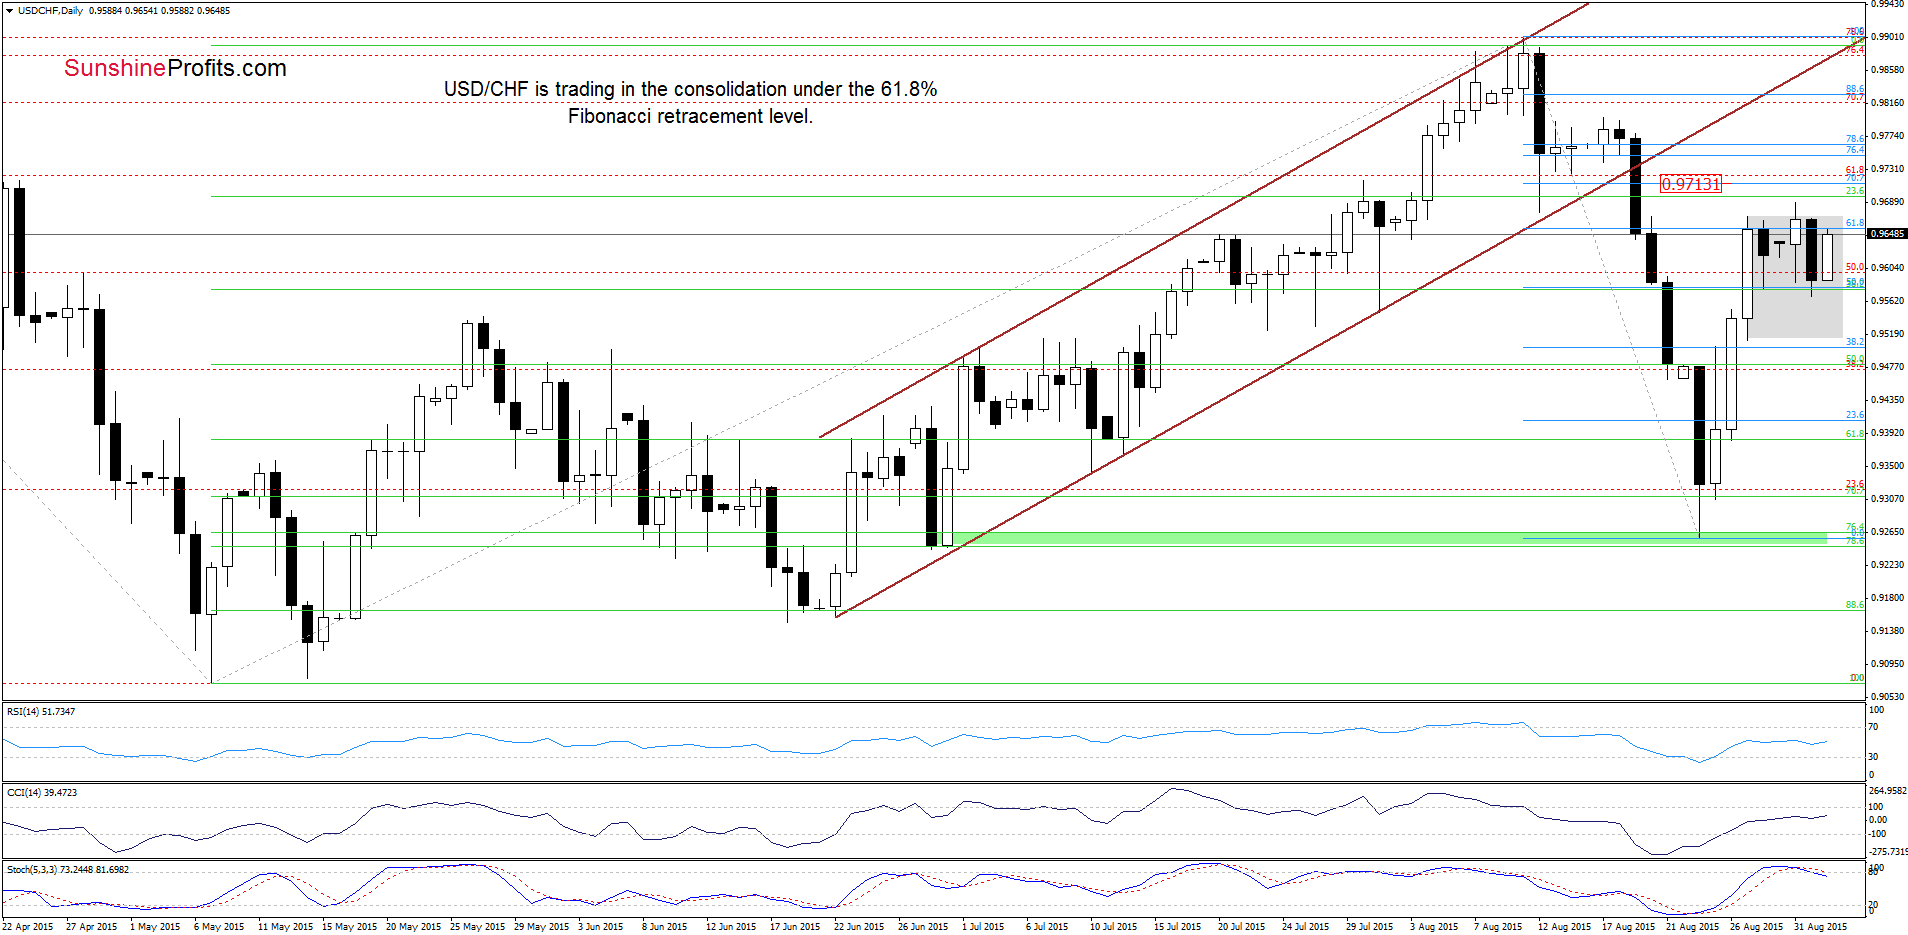
As you see on the above chat, although USD/CHF declined yesterday, the exchange rate remains in a consolidation (marked with grey). Taking this fact into account, we believe that what we wrote on Monday is still valid:
(…) a breakout above the upper line of the formation (or breakdown below the lower border) will indicate the direction of future moves. Nevertheless, taking into account buy signals generated by the RSI and CCI it seems that currency bulls will try to push the pair higher. In this case, if the exchange rate climbs above the last week’s high, we’ll see an increase to the 70.7% retracement (around 0.9713) or even a test of the resistance zone created by the 76.4% and 78.6% Fibonacci retracements around 0.9749-0.9763.
Very short-term outlook: mixed with bullish bias
Short-term outlook: mixed with bullish bias
MT outlook: mixed
LT outlook: mixed
Trading position (short-term; our opinion): No positions are justified from the risk/reward perspective at the moment. We will keep you informed should anything change, or should we see a confirmation/invalidation of the above.
AUD/USD
Quoting our Monday’s alert:
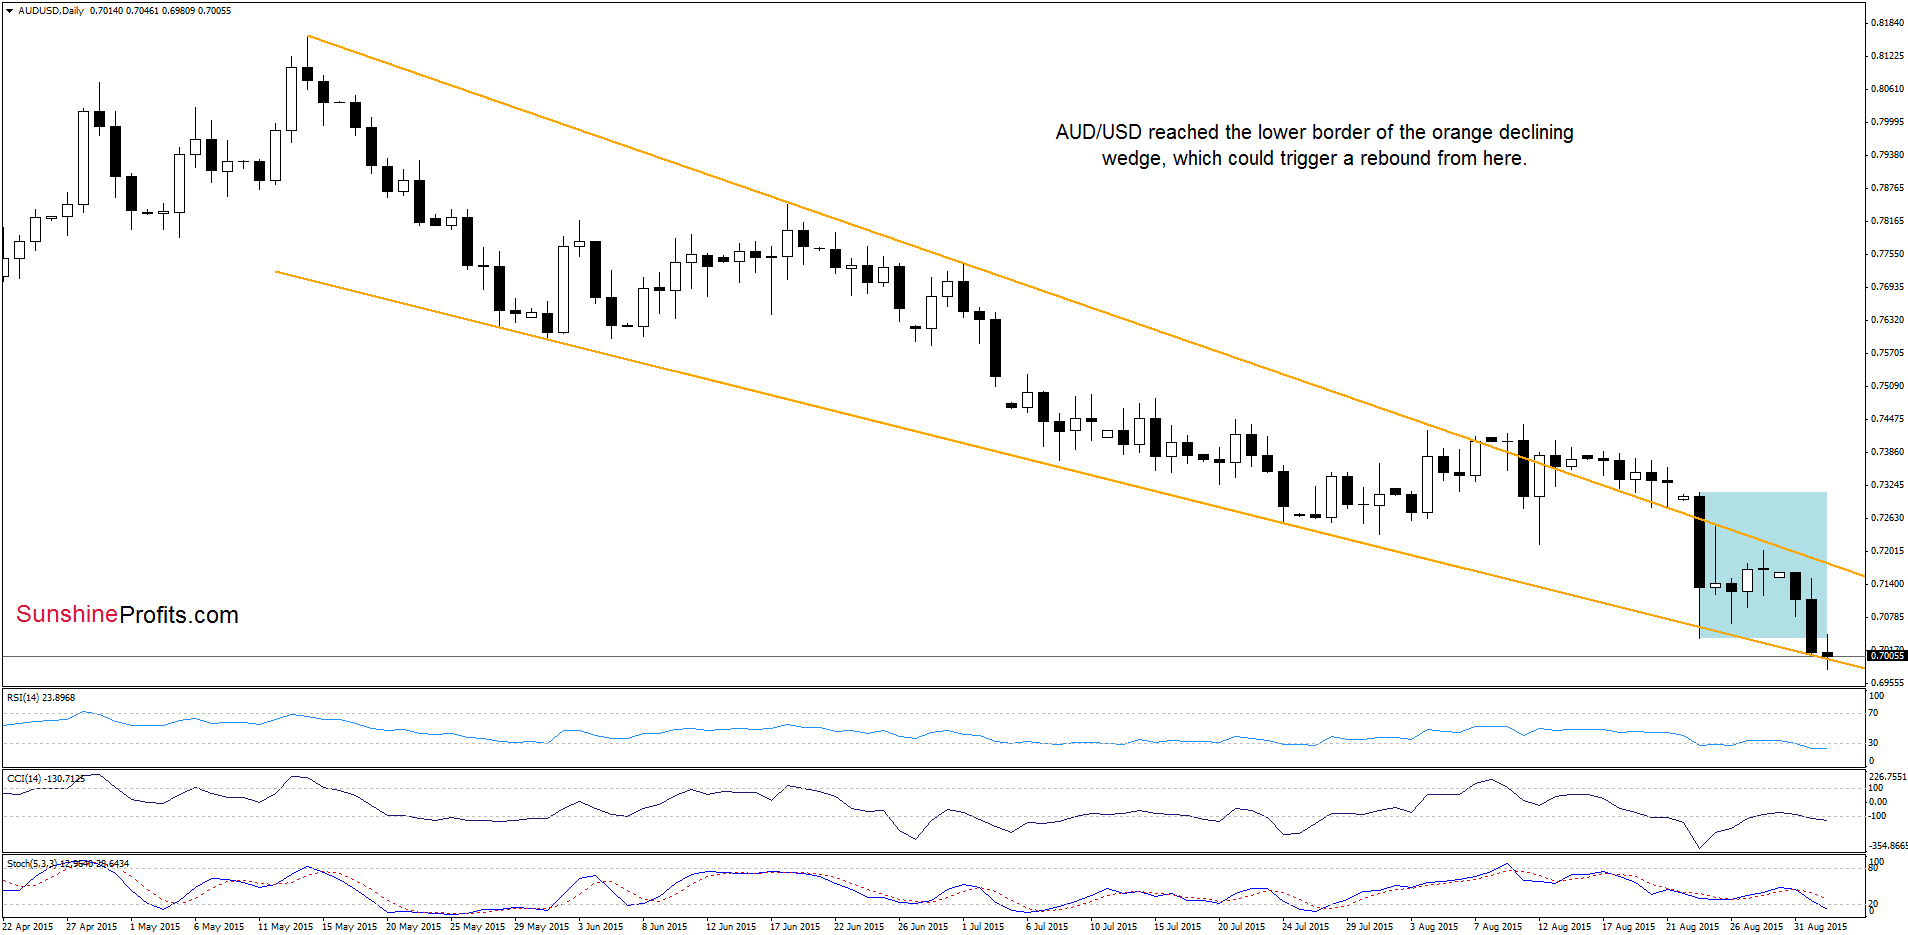
(…) the proximity to the upper border of the consolidation triggered another decline earlier today, which suggests a test of the lower line of the formation in the coming days.
Looking at the daily chart, we see that the situation developed in line with the above scenario and AUD/USD reached our downside target earlier today. Although the exchange rate could rebound from here (similarly to what we saw in previous weeks), the current position of the indicators suggests that currency bears will try to push the pair lower in the coming day(s).
What could happen if they succeed? Let’s take a look at the weekly chart and find out.
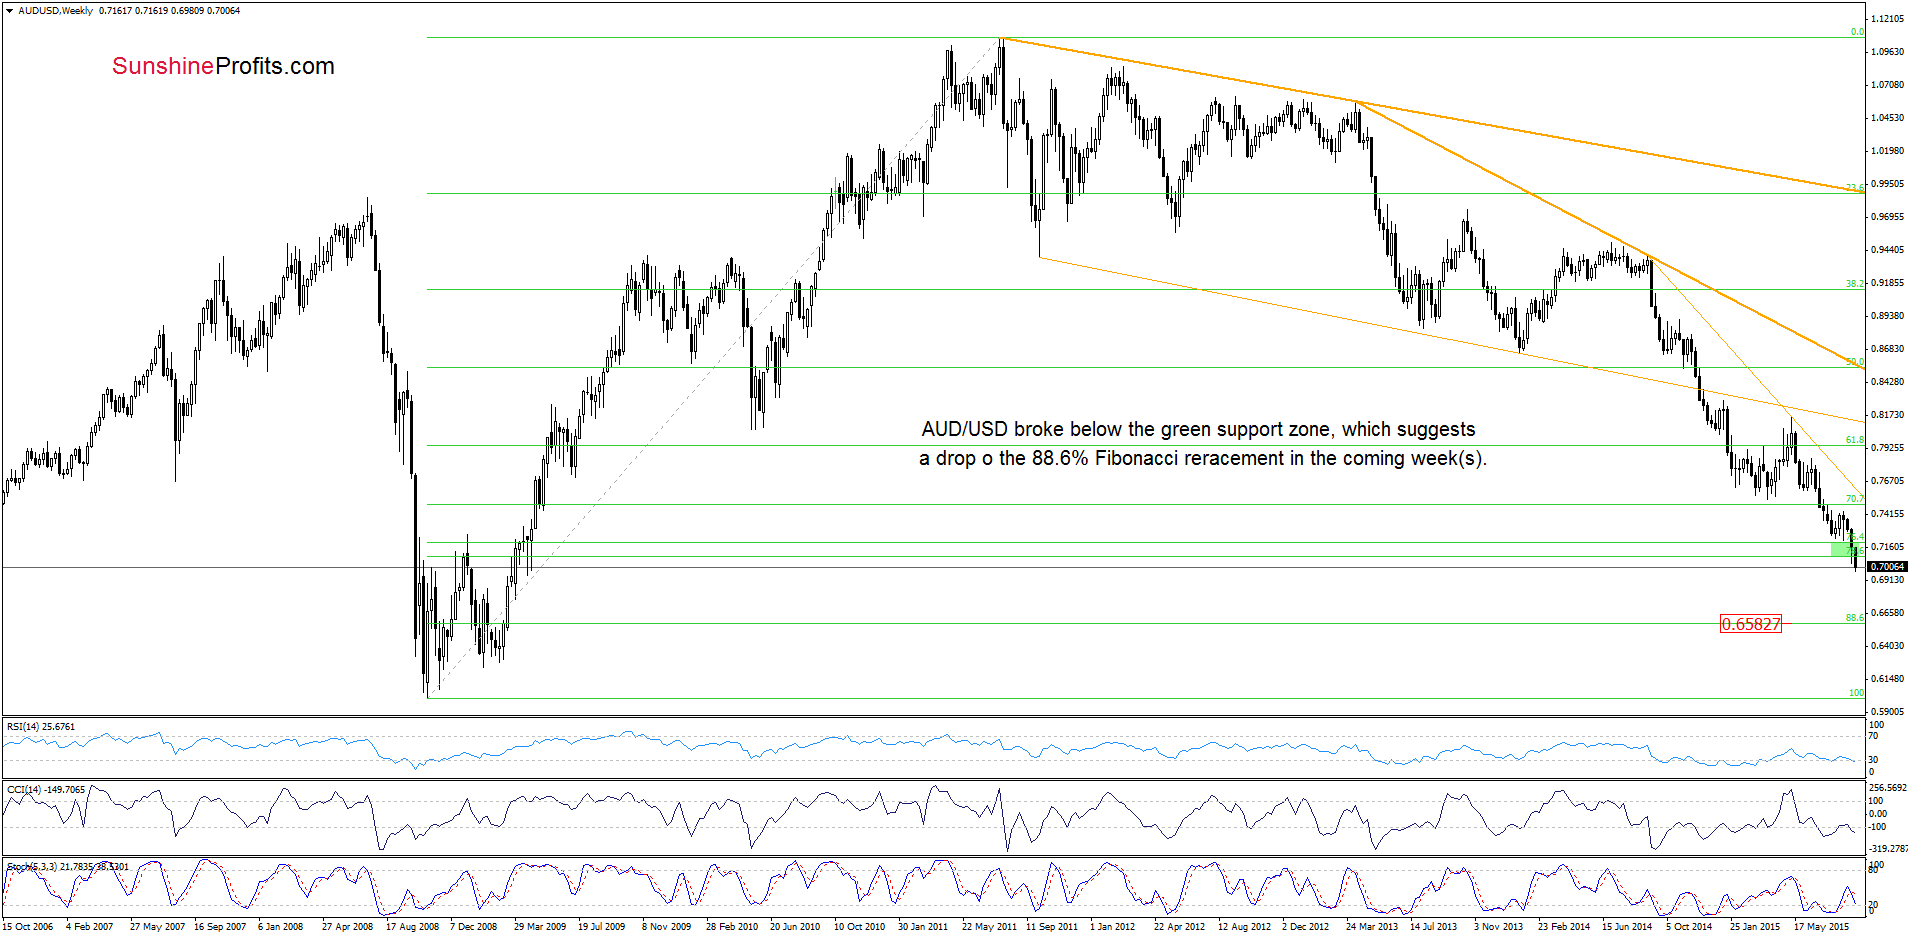
From this perspective we see that the recent downward move took AUD/USD below the green support zone (based on the 76.4% and 78.6% Fibonacci retracement levels), which suggests further deterioration and a drop even to around 0.6583, where the 88.6% Fibonacci retracement is.
Very short-term outlook: mixed with bearish bias
Short-term outlook: mixed with bearish bias
MT outlook: mixed with bearish bias
LT outlook: mixed
Trading position (short-term; our opinion): No positions are justified from the risk/reward perspective at the moment. We will keep you informed should anything change, or should we see a confirmation/invalidation of the above.
Thank you.
Nadia Simmons
Forex & Oil Trading Strategist
Przemyslaw Radomski, CFA
Founder, Editor-in-chief
Gold & Silver Trading Alerts
Forex Trading Alerts
Oil Investment Updates
Oil Trading Alerts

