

The USD Index reversed and rebounded after the People’s Bank of China cut interest rates by 25 basis points to 4.6%. As a result the index erased over 75% of yesterday’s decline, pushing the euro under the May high. Will we see further deterioration in EUR/USD in the coming days?
In our opinion the following forex trading positions are justified - summary:
EUR/USD
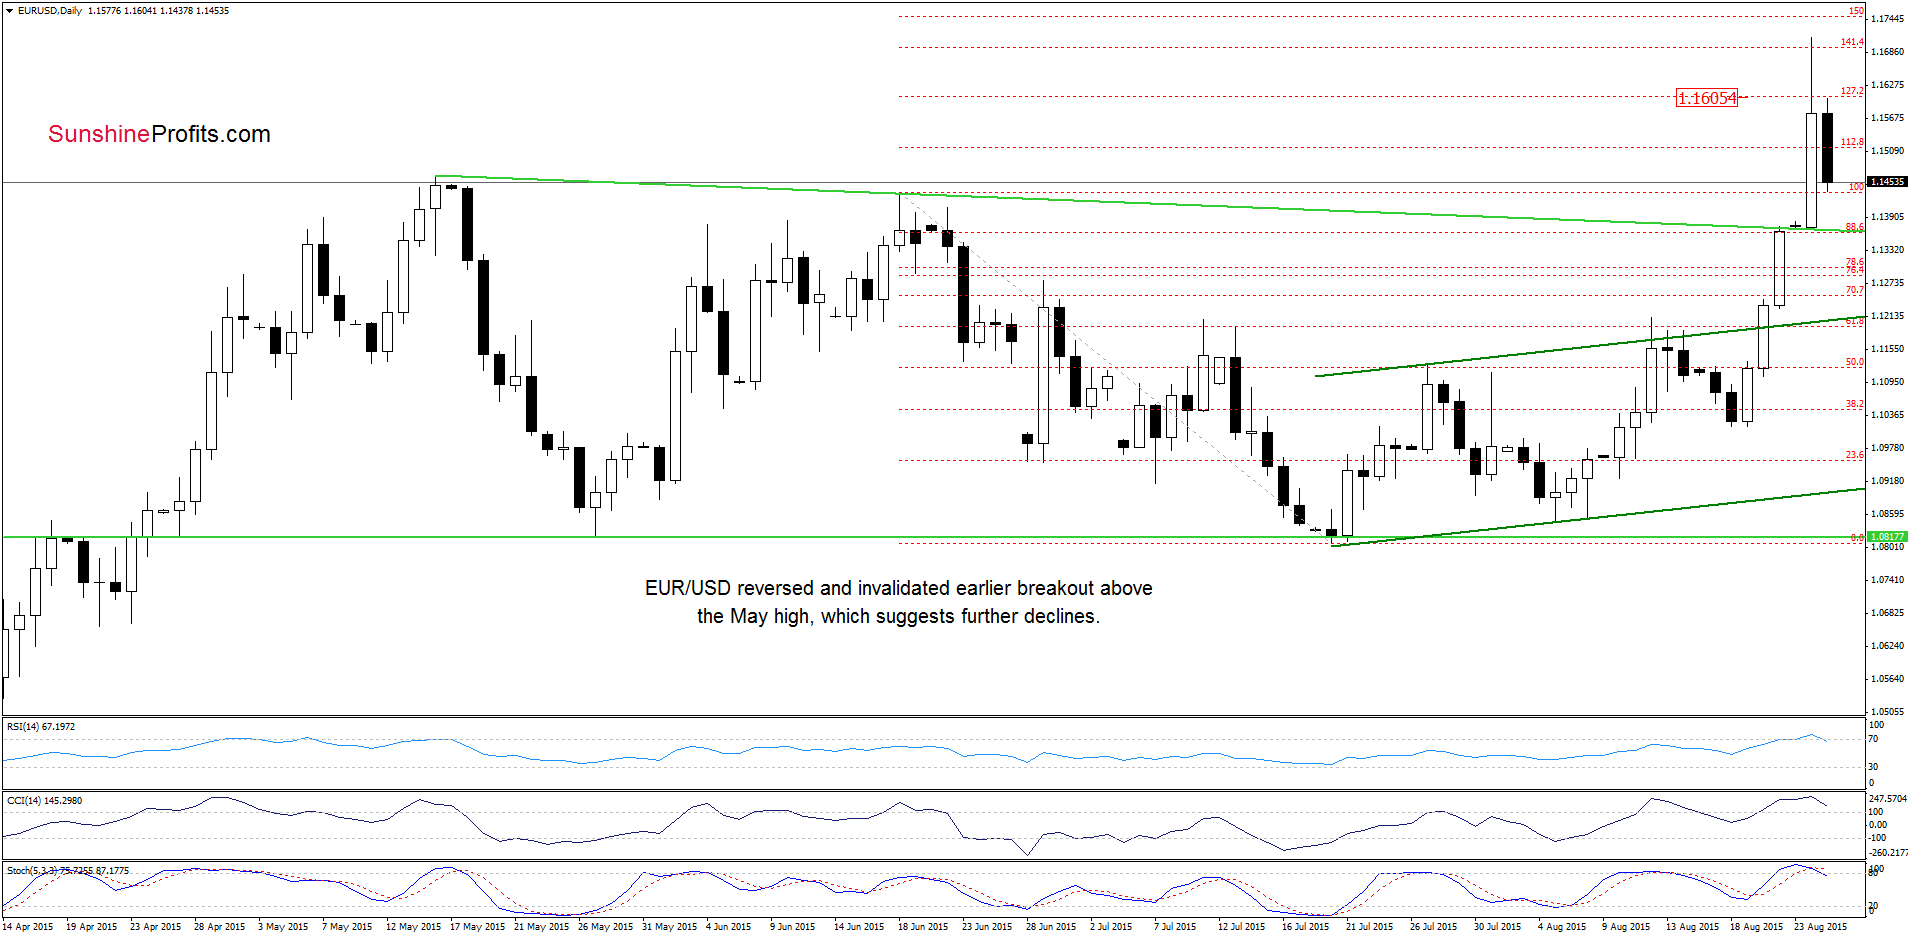
Looking at the daily chart we see that EUR/USD broke above the May high which triggered a sharp rally and an increase to the 141.4% Fibonacci extension level. Despite this improvement the exchange rate reversed and declined. Why? Let’s take a look at the weekly chart below.
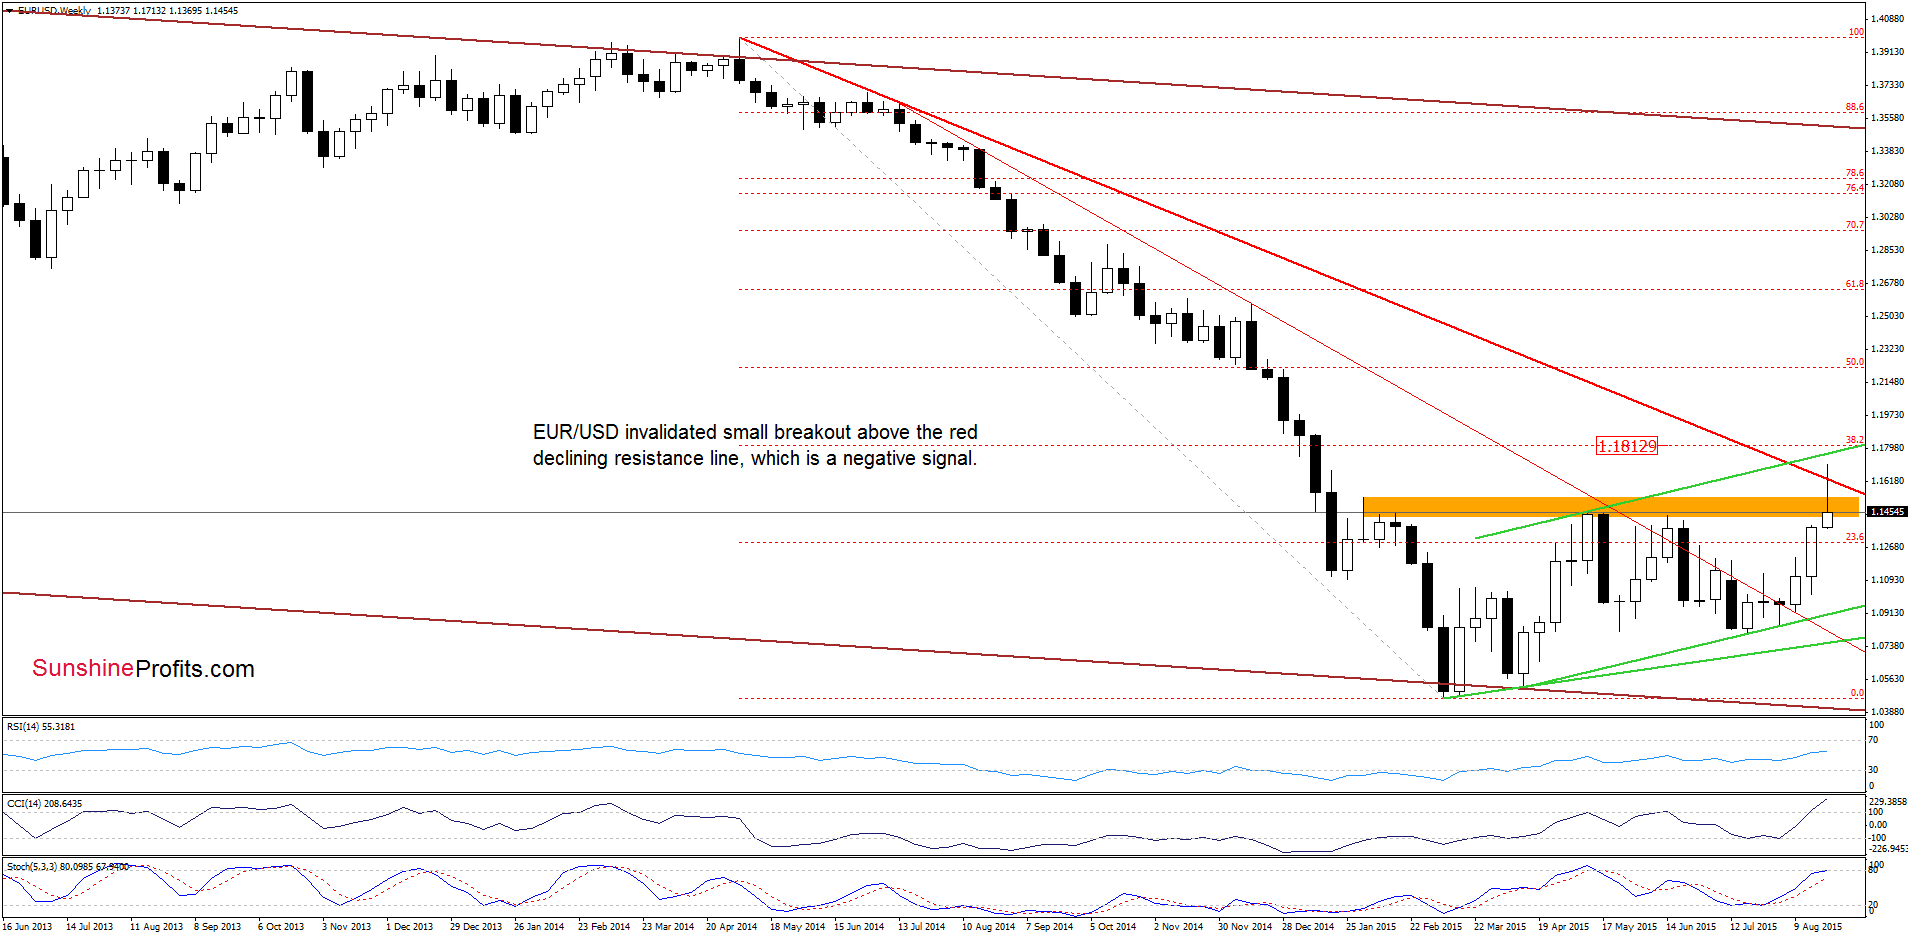
From this perspective we see that yesterday’s move took the pair above the orange resistance zone, the long-term red declining resistance line and approached EUR/USD to the upper border of the green rising trend channel. As you see, the proximity to this resistance encouraged currency bears to act, which resulted in a decline. With this move, the pair invalidated earlier small breakout above the red line, which is a negative signal that suggests further deterioration.
Nevertheless, in our opinion this scenario will be more likely if EUR/USD closes the day below the green support line based on the May and June highs (marked on the daily chart). Will we see such price action in near future? Taking into account the current position of the indicators (the daily RSI and Stochastic Oscillator generated sell signals, while the CCI is close to doing the same), we think that currency bears will try push the pair lower and realize the above-mentioned goal. If they succeed, the next downside target would be around 1.1206, where the previously-broken upper line of the rising trend channel (marked on the daily chart) is.
Very short-term outlook: mixed with bearish bias
Short-term outlook: mixed
MT outlook: mixed
LT outlook: mixed
Trading position (short-term; our opinion): No positions are justified from the risk/reward perspective at the moment. We will keep you informed should anything change, or should we see a confirmation/invalidation of the above.
USD/CAD
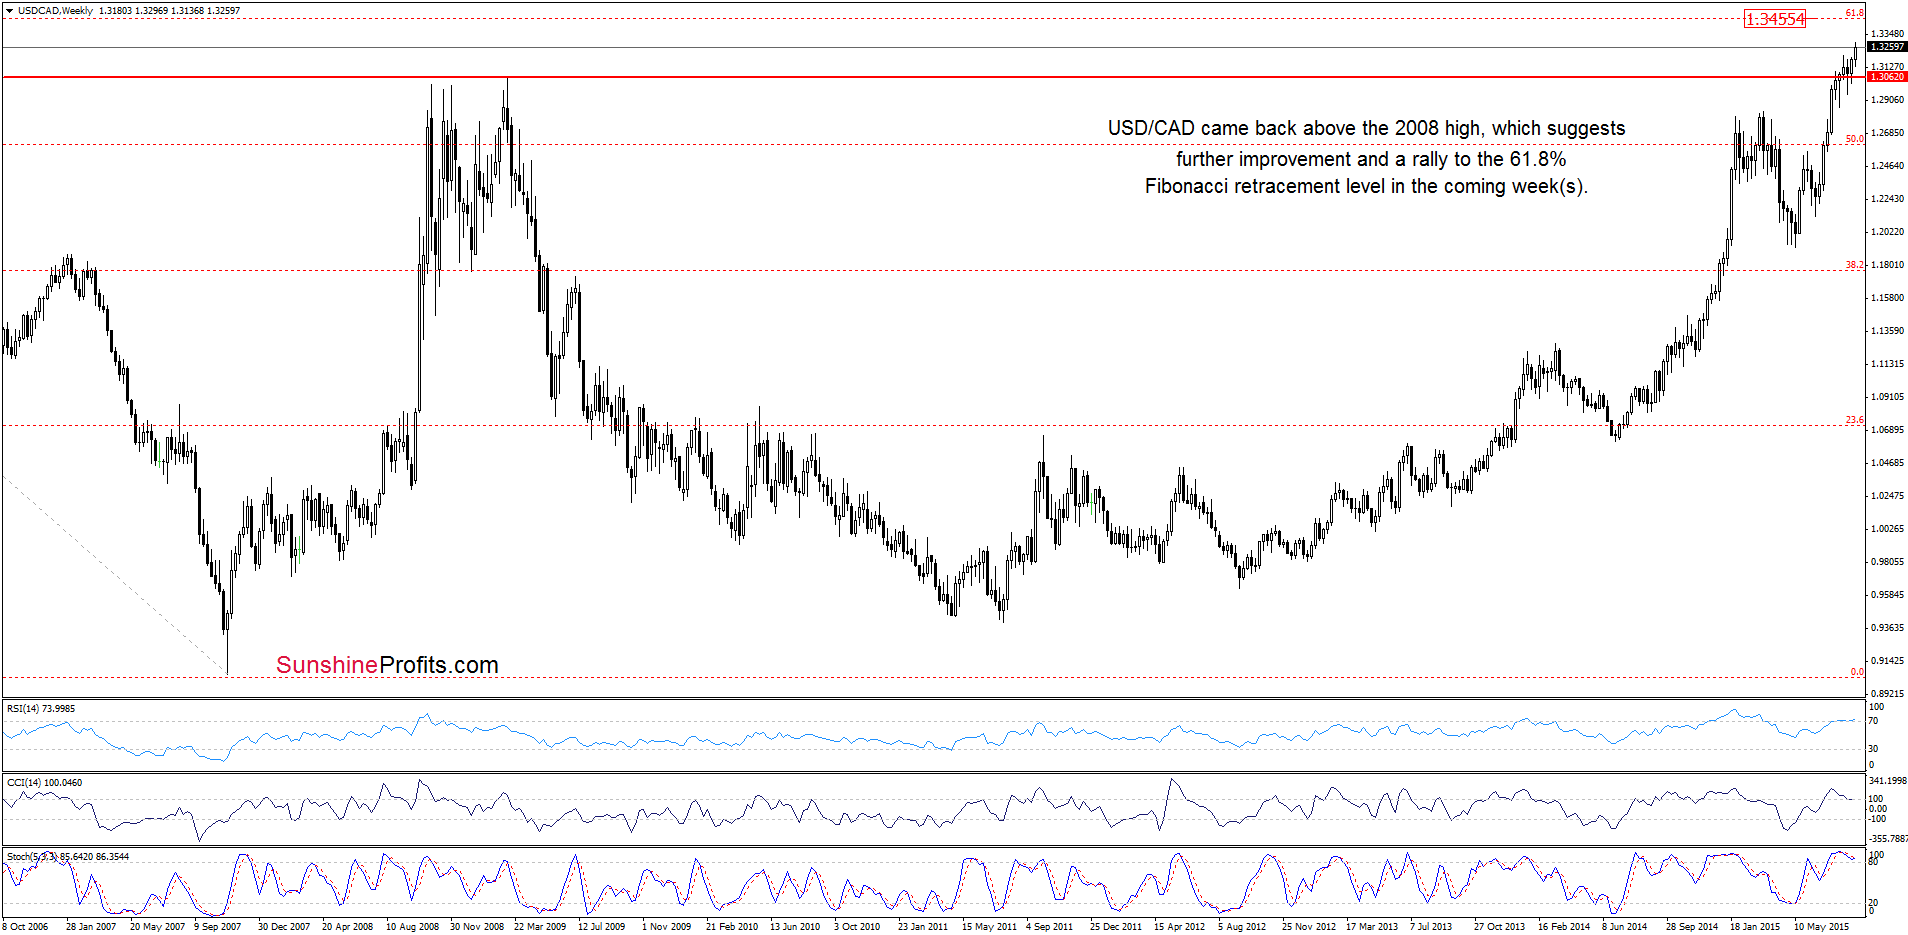
The medium-term picture has improved as USD/CAD came back above the 2008 high, which suggests a rally to the 61.8% Fibonacci retracement in the coming week(s).
Will the short-term picture confirm this pro-growth scenario? Let’s check.
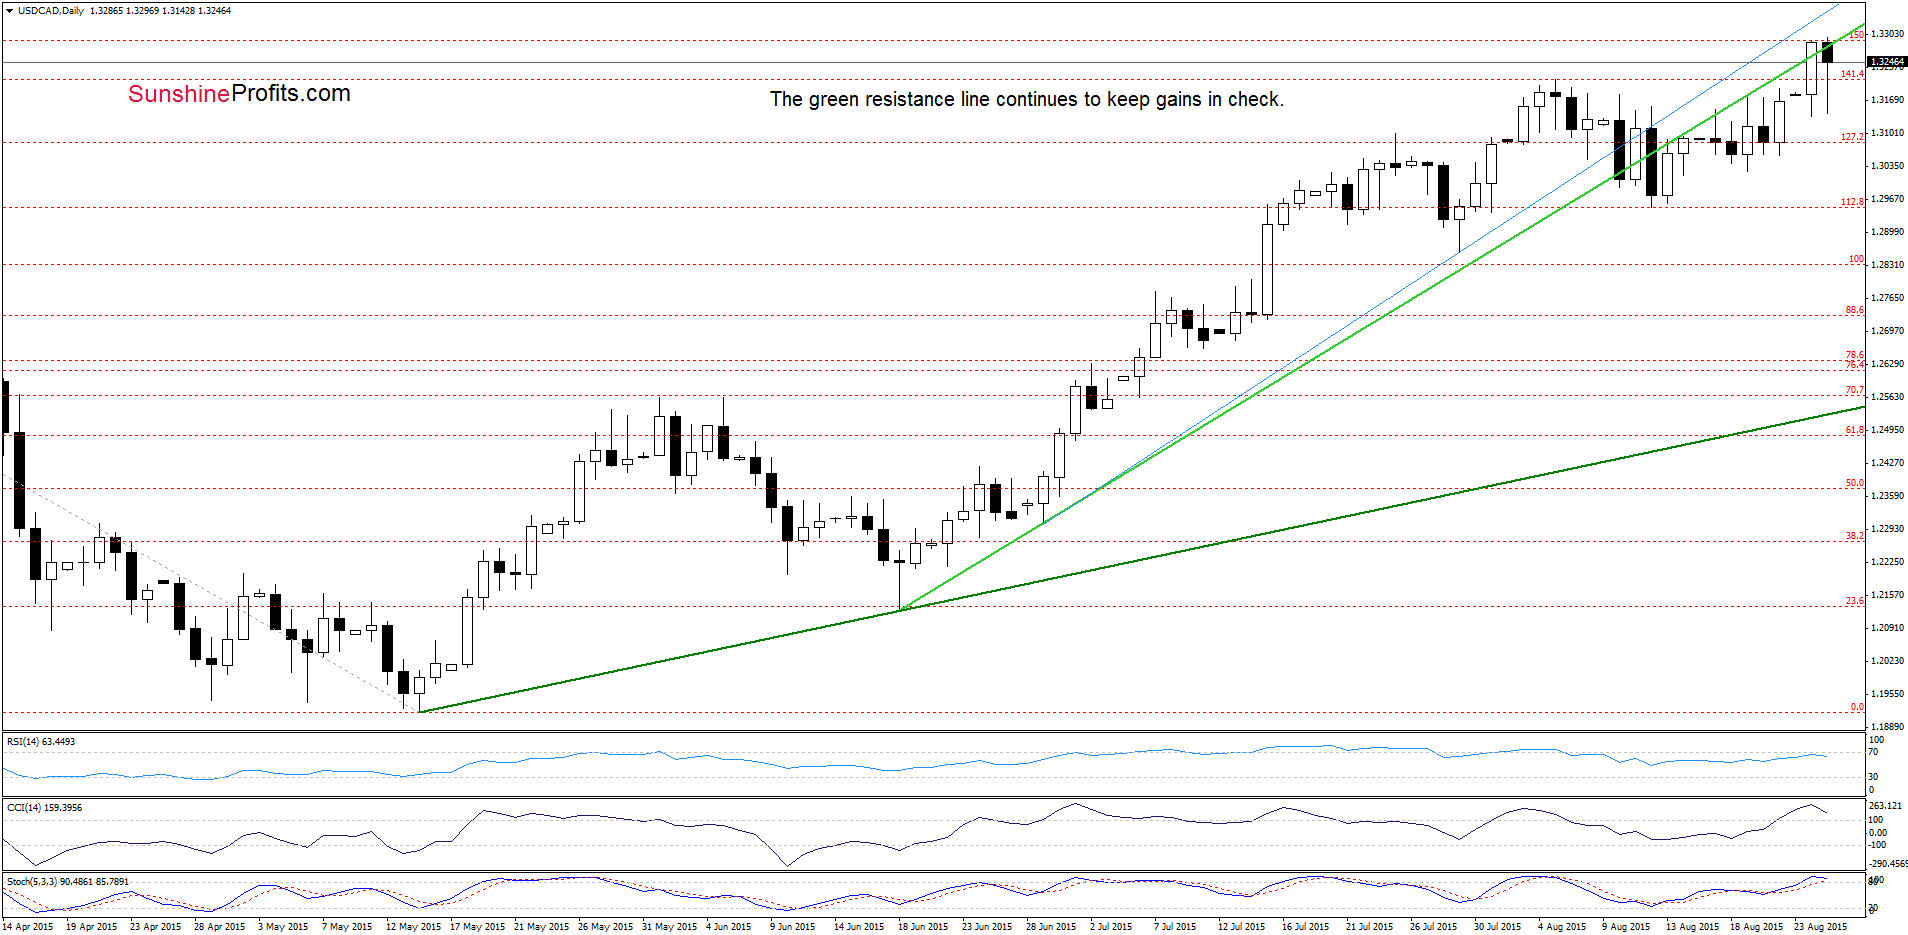
On the daily chart, we see that although USD/CAD climbed above the previous high, the green resistance line in combination with the 150% Fibonacci extension (based on the Mar-May decline) stopped further improvement, triggering a pullback earlier today. Therefore, we still believe that as long as there is no invalidation of the breakdown below this key resistance, further rally is questionable. Taking this fact into account and the current position of the indicators, it seems that currency bears will try to push the pair lower in the coming day(s).
Very short-term outlook: mixed
Short-term outlook: mixed
MT outlook: mixed with bullish bias
LT outlook: mixed
Trading position (short-term; our opinion): No positions are justified from the risk/reward perspective at the moment. We will keep you informed should anything change, or should we see a confirmation/invalidation of the above.
AUD/USD
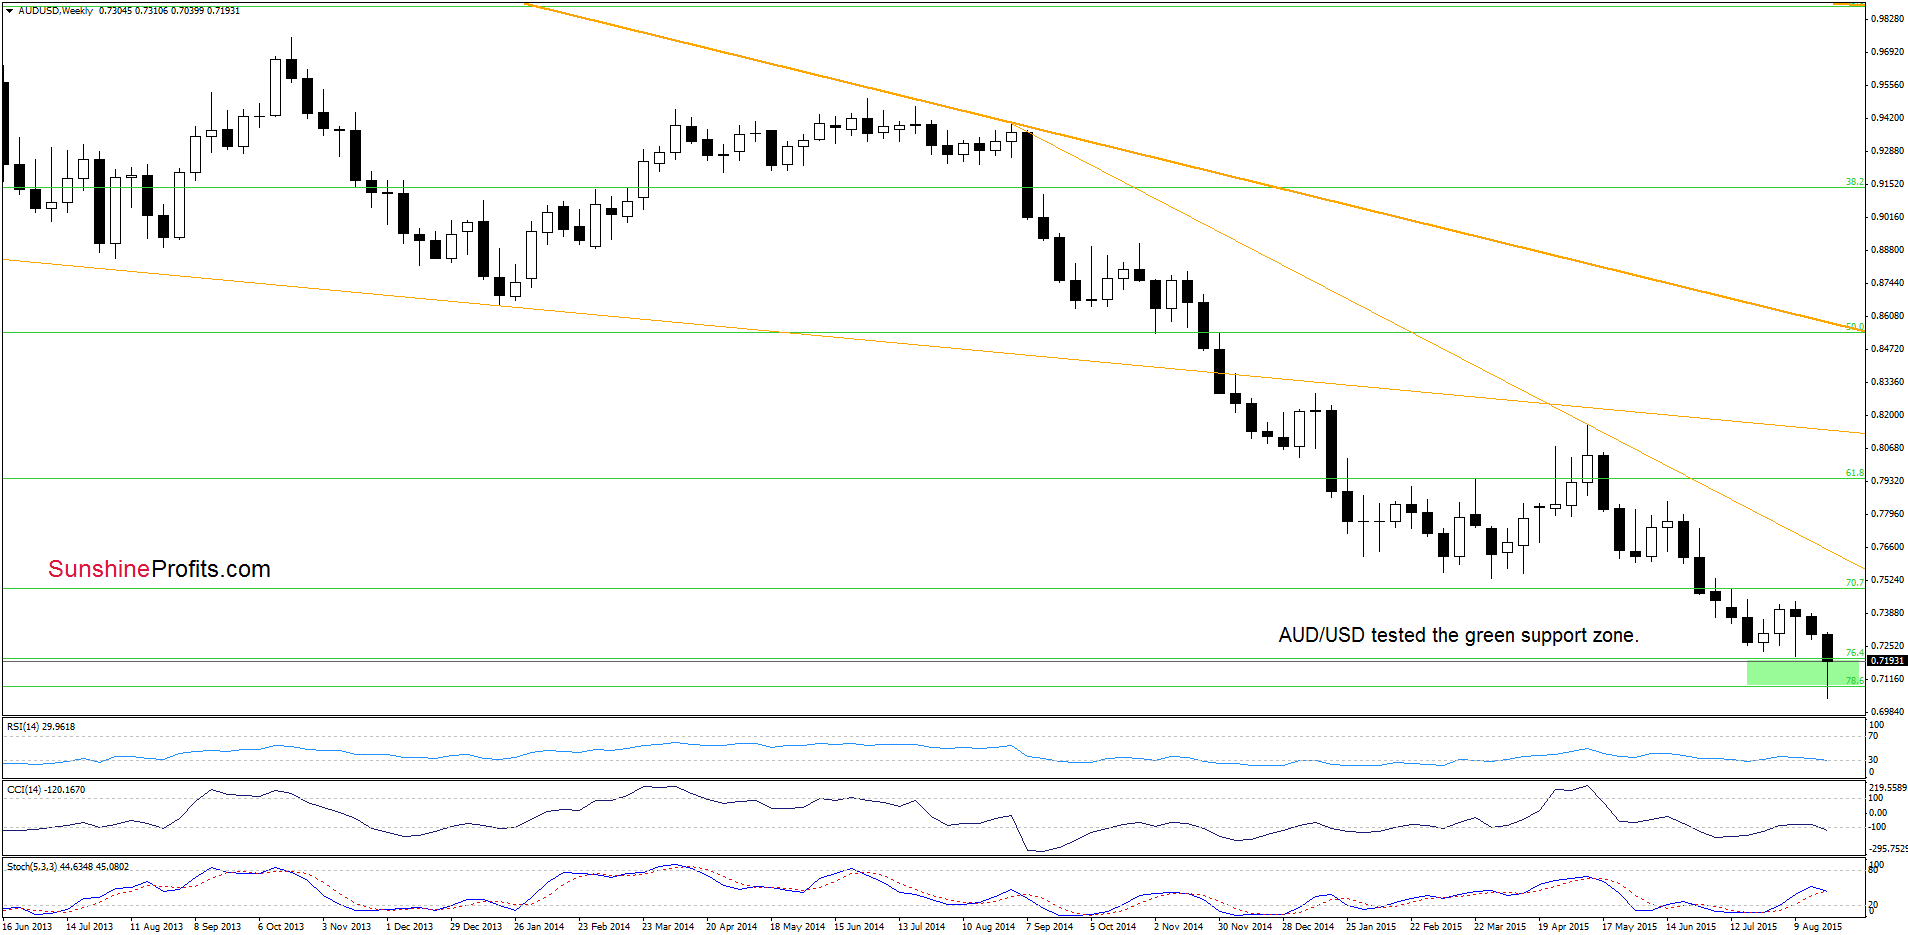
Looking at the weekly chart we see that AUD/USD tested the green support zone (based on the 76.4% and 78.6% Fibonacci retracement levels) and rebounded.
What impact did this move have on the very short-term picture? Let’s find out.
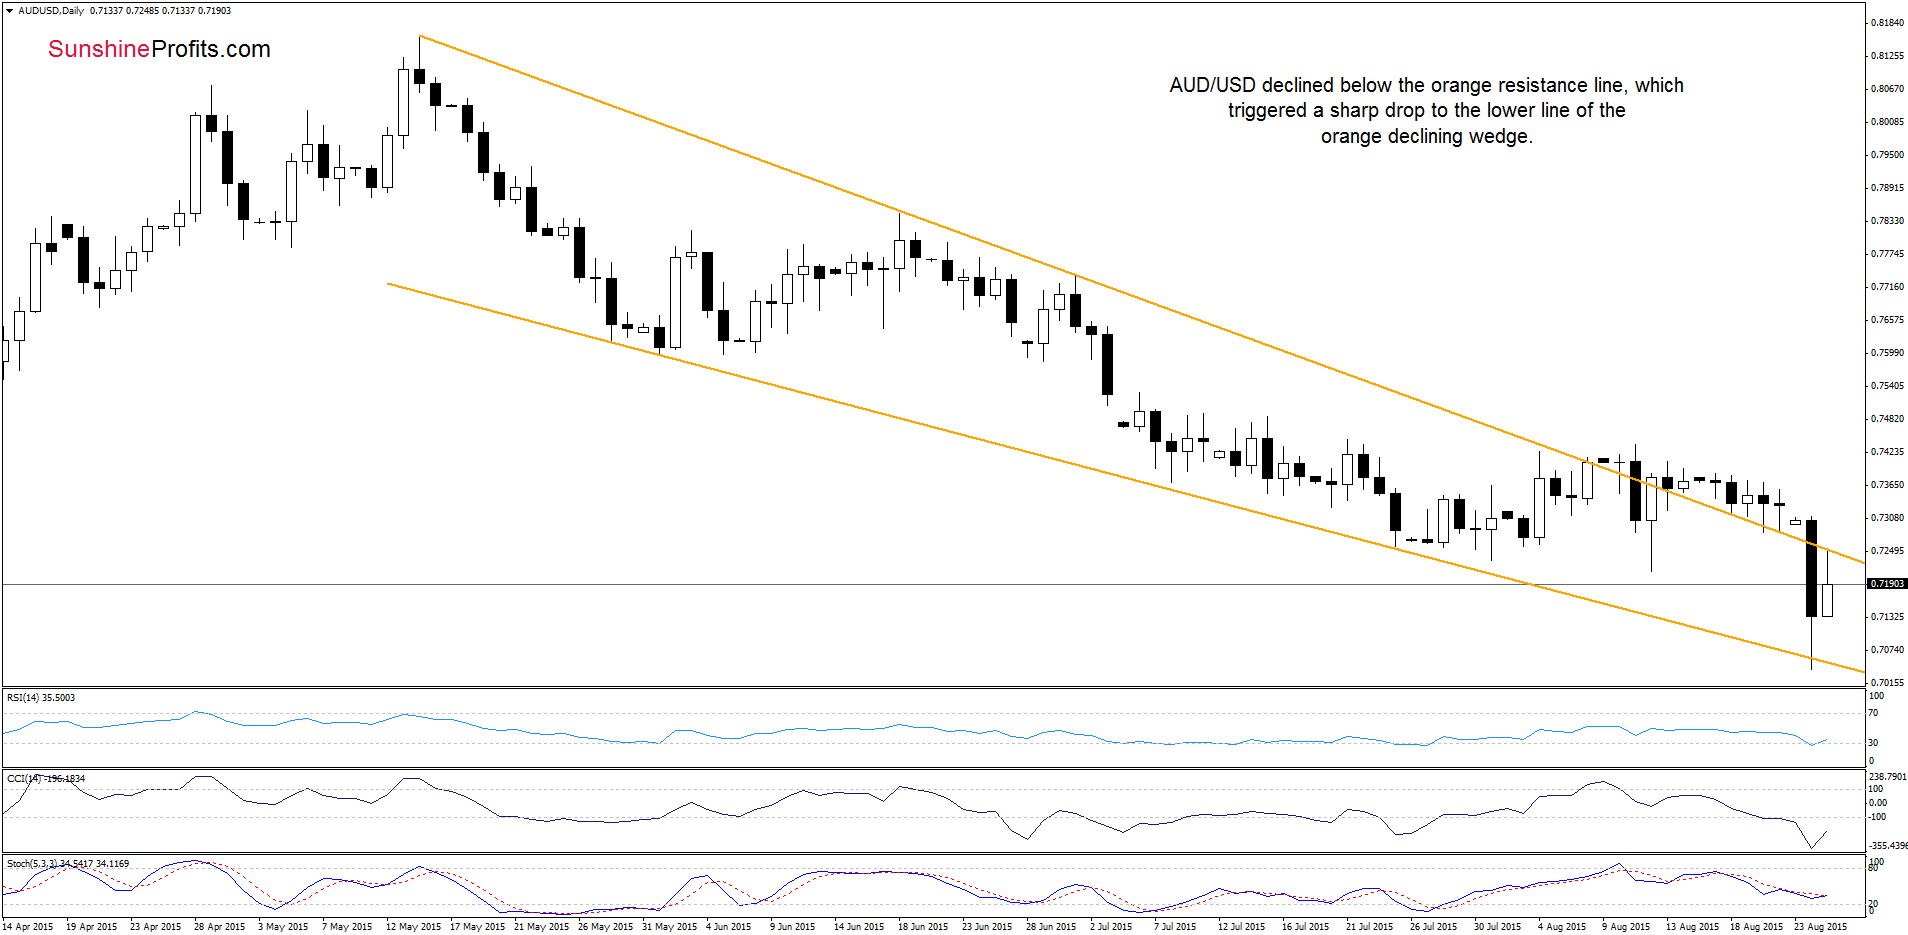
From today’s point of view we see that AUD/USD moved lower and broke below the previously-broken orange support/resistance line, which triggered a sharp decline that took the exchange rate to the lower border of the declining wedge (marked with orange). As you see, this support line encouraged currency bulls to act, which resulted in an upswing the upper border of the formation. Taking this fact into account, we think that as long as there is no daily closure above this line all upswing would be nothing more than verifications of earlier breakdown. In this case, another downswing(s) and a test of yesterday’s low would be quite likely.
Very short-term outlook: mixed
Short-term outlook: mixed
MT outlook: mixed
LT outlook: mixed
Trading position (short-term; our opinion): No positions are justified from the risk/reward perspective at the moment. We will keep you informed should anything change, or should we see a confirmation/invalidation of the above.
Thank you.
Nadia Simmons
Forex & Oil Trading Strategist
Przemyslaw Radomski, CFA
Founder, Editor-in-chief
Gold & Silver Trading Alerts
Forex Trading Alerts
Oil Investment Updates
Oil Trading Alerts

