

Earlier today, the U.S. currency extended gains as Friday’s data (which showed that U.S. producer prices were higher for a third straight month in July and factory output increased at the fastest rate in eight months) continued to support demand for the greenback. What impact did this move have on the GBP/USD?
In our opinion the following forex trading positions are justified - summary:
EUR/USD
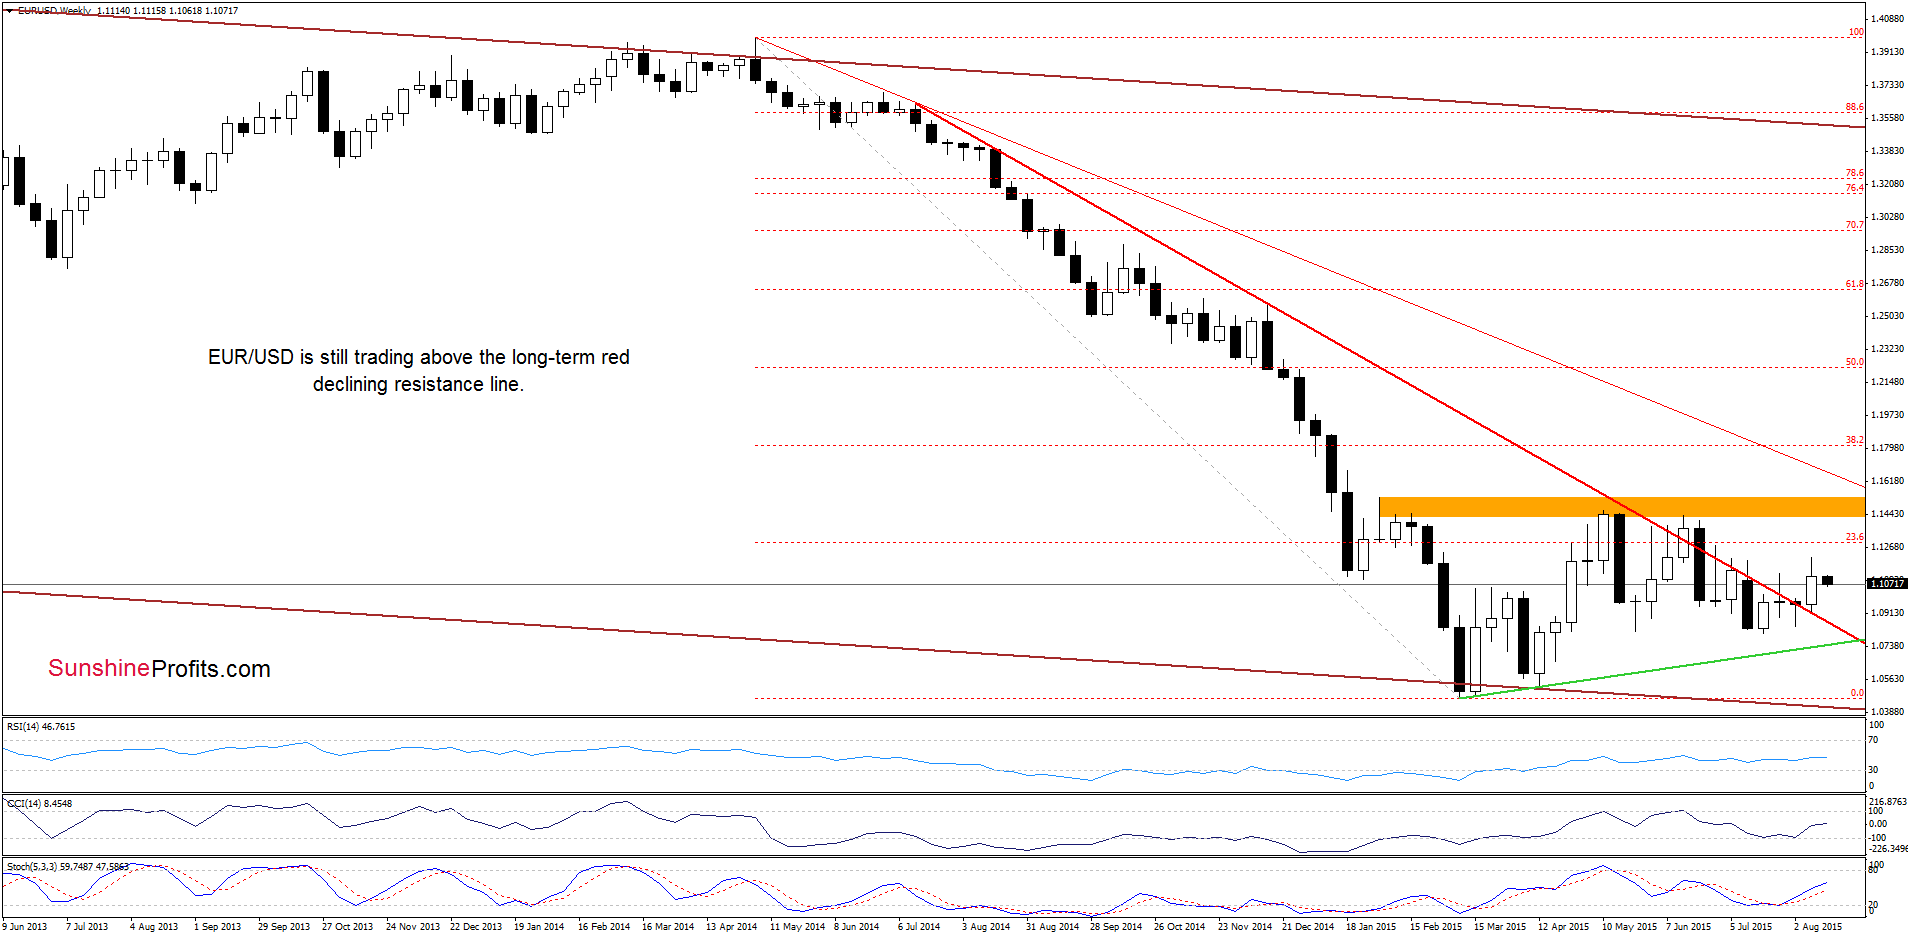
Although EUR/USD moved little lower, the situation in the medium term hasn’t changed much as the exchange rate remains above the previously-broken long-term red declining resistance line.
Will the very short-term picture give us more clues about future moves? Let’s check.
Quoting our Friday’s Forex Trading Alert:
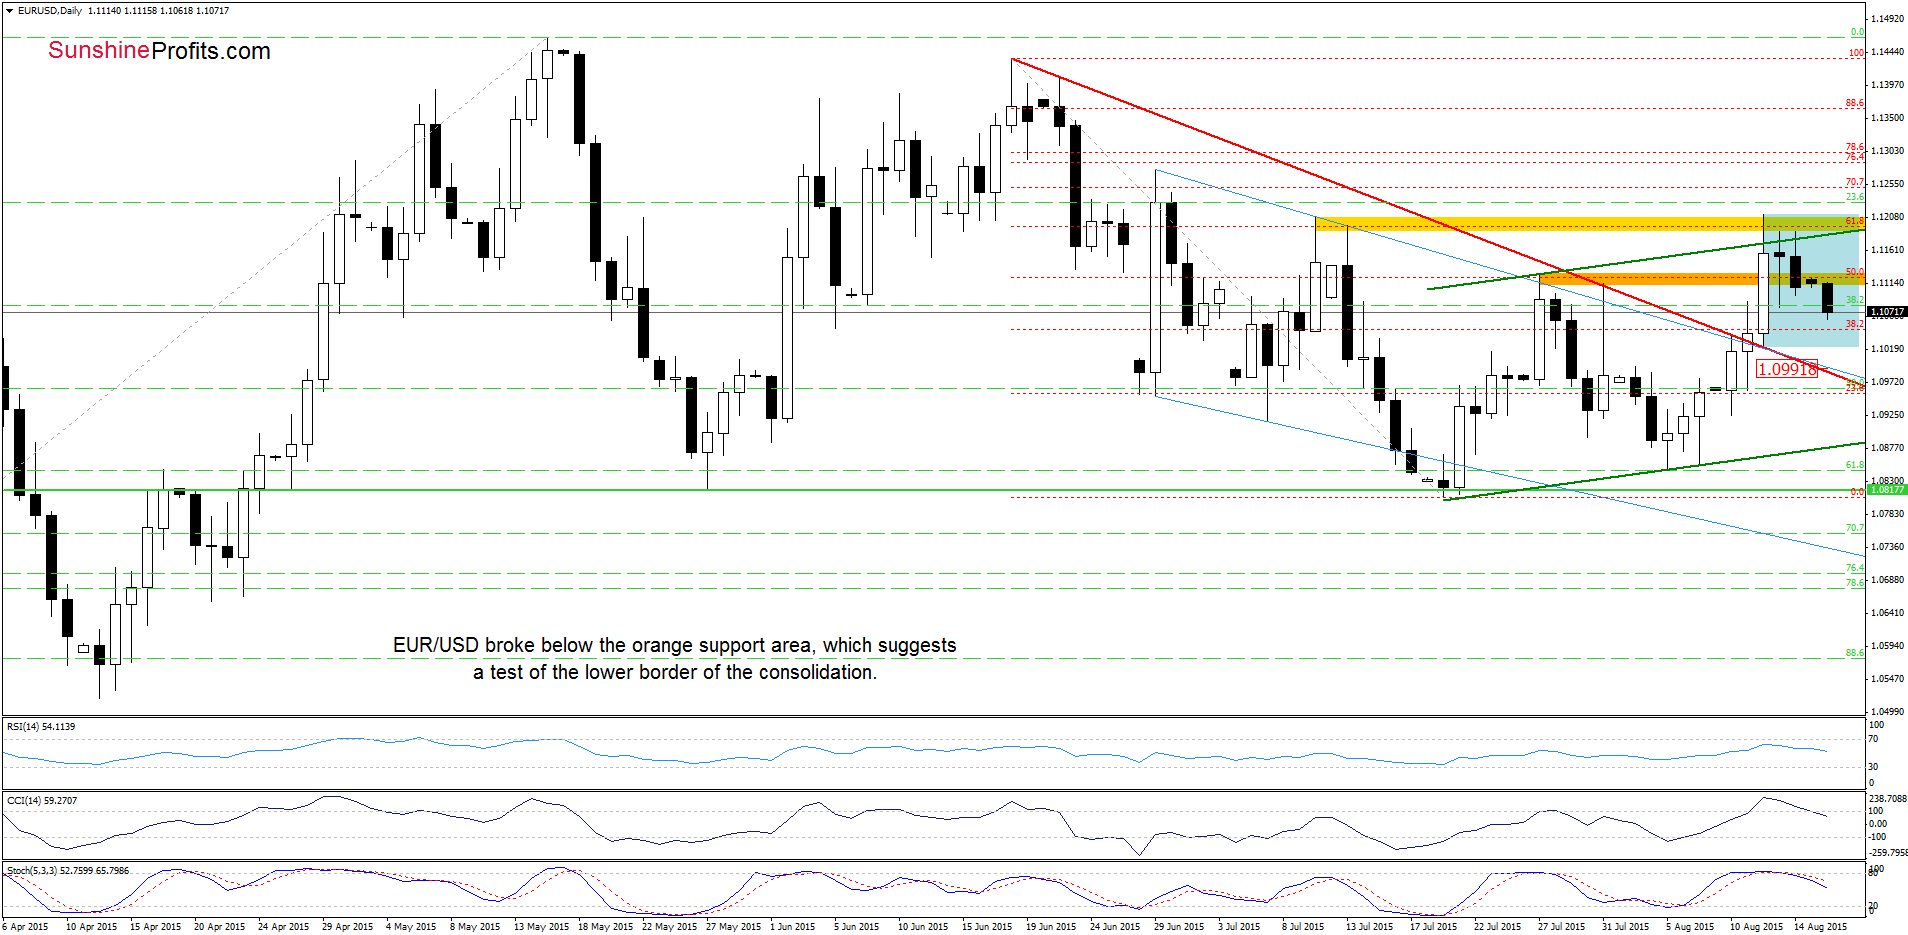
(…) EUR/USD is trading in a narrow range between the yellow resistance zone (which is currently reinforced by the upper border of the green rising trend channel) and the orange area (it serves as the nearest support at the moment). (…) Taking into account the above-mentioned solid resistance and the current position of the indicators (the CCI and Stochastic Oscillator are overbought and very close to generating sell signals), we think that lower values of the exchange rate are just around the corner. (…) Nevertheless, this scenario will be more likely if EUR/USD closes today’s session under the orange zone.
From today’s point of view we see that the situation developed in line with the above scenario and EUR/USD moved lower, breaking under the orange support area. This negative sign, in combination with sell signals generated by the indicators, suggests that the pair will likely test the lower border of the blue consolidation in the coming day(s). If this support is broken the next downside target would be the red declining line, which is slightly below the psychological barrier of 1.1000.
Very short-term outlook: mixed with bearish bias
Short-term outlook: mixed
MT outlook: mixed
LT outlook: mixed
Trading position (short-term; our opinion): No positions are justified from the risk/reward perspective at the moment. We will keep you informed should anything change, or should we see a confirmation/invalidation of the above.
GBP/USD
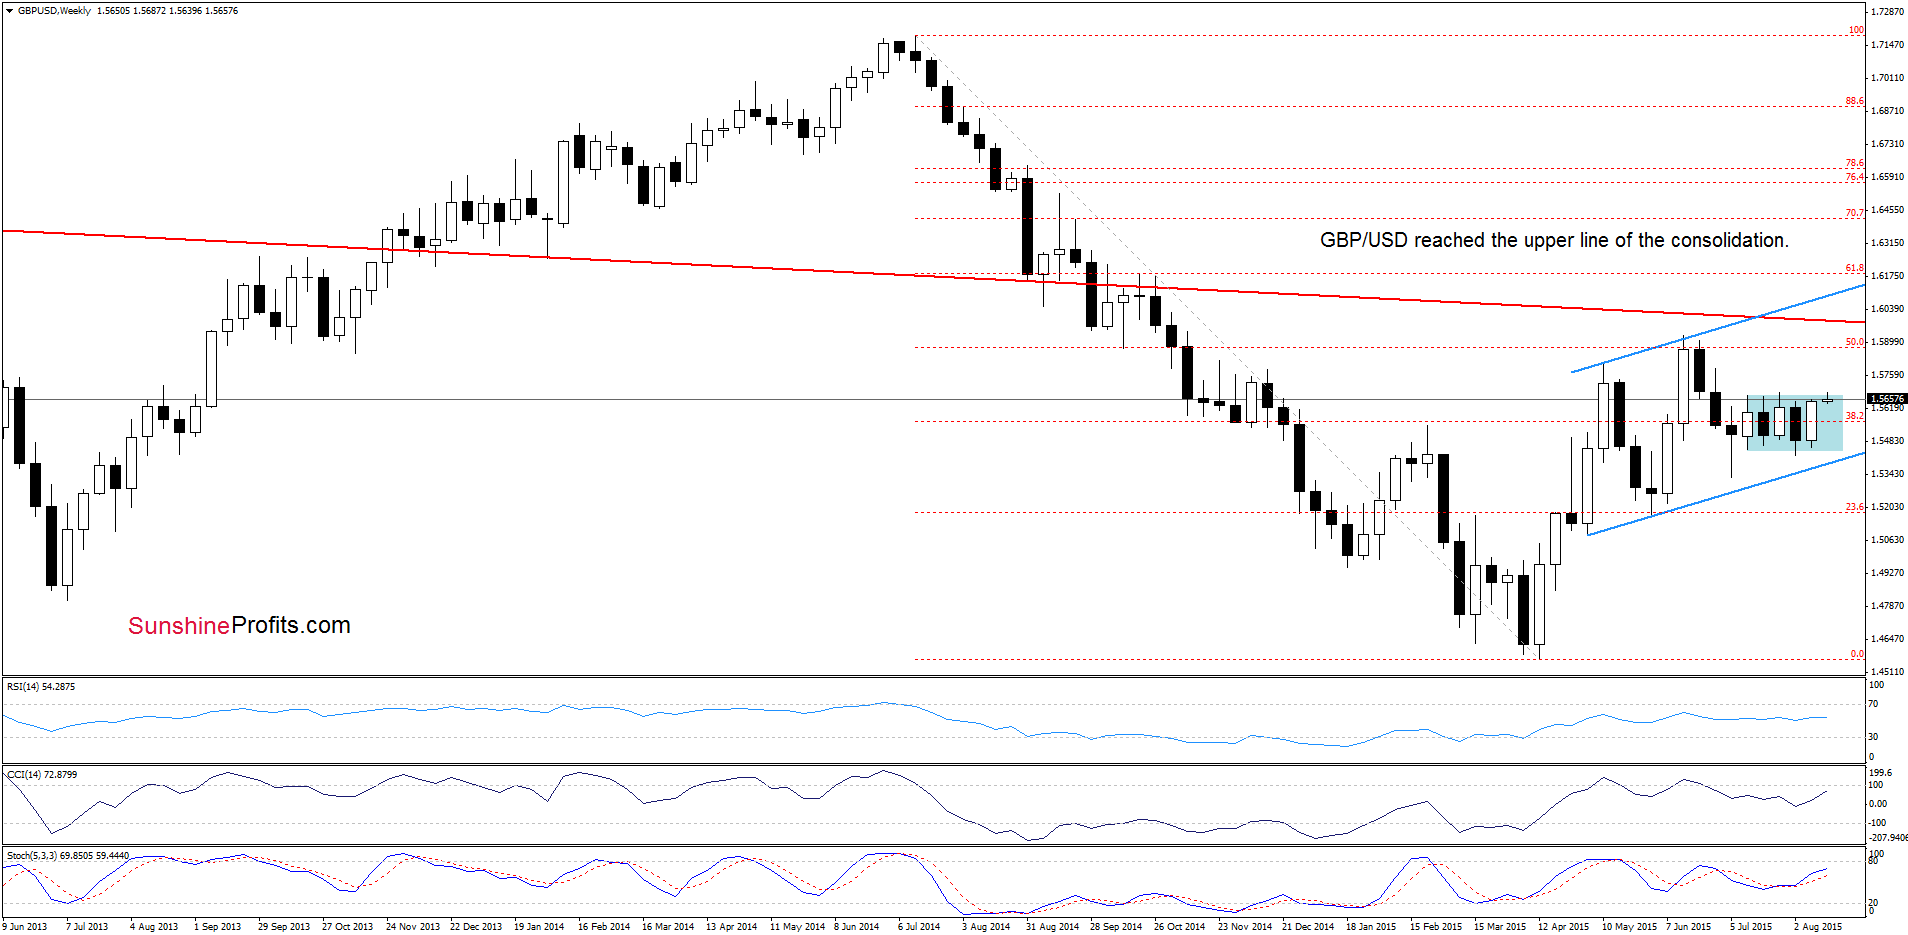
GBP/USD moved higher and reached the upper border of the blue consolidation. Will we see a breakout in the coming days? Let’s examine the daily chart and find out.
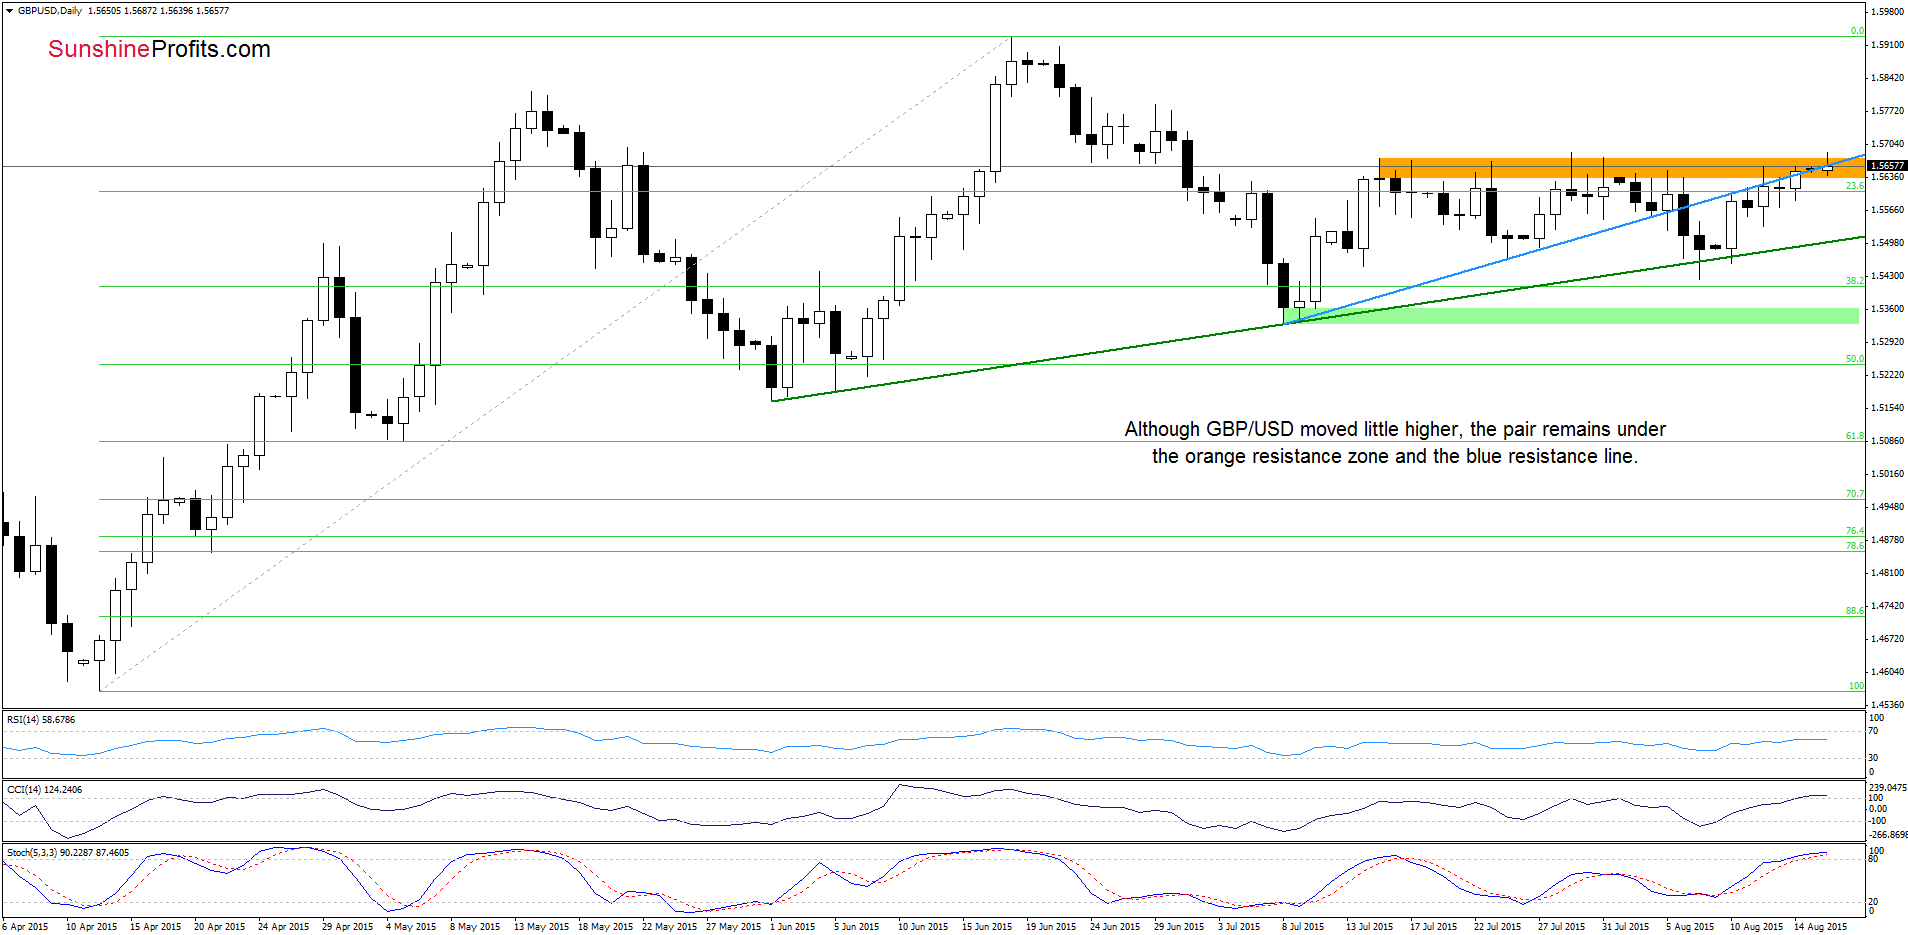
Looking at the above chart, we see that GBP/USD is still trading slightly below the orange resistance zone, which is currently reinforced by the previously-broken blue line. Therefore, we believe that our last commentary on this currency pair is up-to-date:
(…) in our opinion, as long as there is no comeback above this area all upswings are nothing more than verifications of earlier breakdown and a bigger upward move is not likely to be seen. Additionally, if the indicators generate sell signals in the coming day(s), we’ll likely see another test of the green support line.
Very short-term outlook: mixed with bearish bias
Short-term outlook: mixed
MT outlook: mixed
LT outlook: mixed
Trading position (short-term; our opinion): No positions are justified from the risk/reward perspective at the moment. We will keep you informed should anything change, or should we see a confirmation/invalidation of the above.
USD/CAD
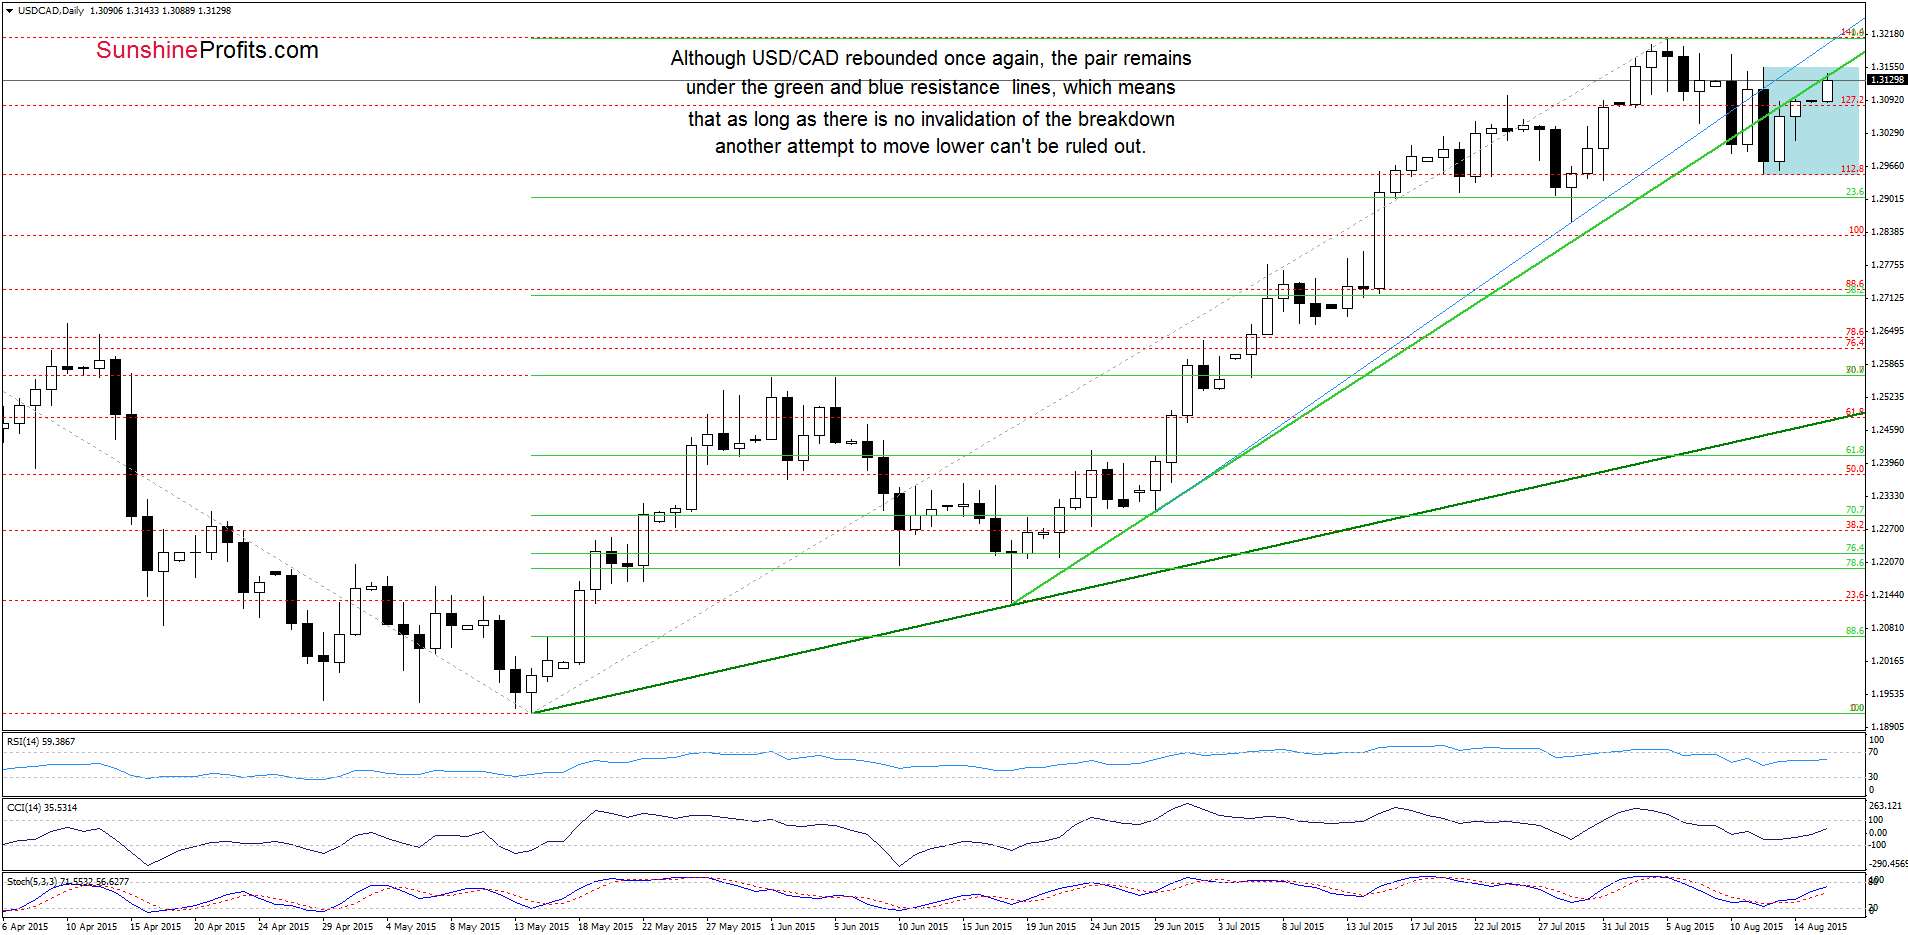
On the daily chart, we see that USD/CAD reversed once again and climbed to the previously-broken green line (which serves as the nearest resistance at the moment). So far currency bulls didn’t manage to invalidate the breakdown below this line (despite several attempts in the previous week), which doesn’t confirm their strength. Nevertheless, taking into account the current position of the indicators, it seems that they will try to push the pair higher once again in the coming day(s).
Will they succeed? Let’s take a closer look at the weekly chart and find out whether there are any positive technical factors on the weekly chart or not.
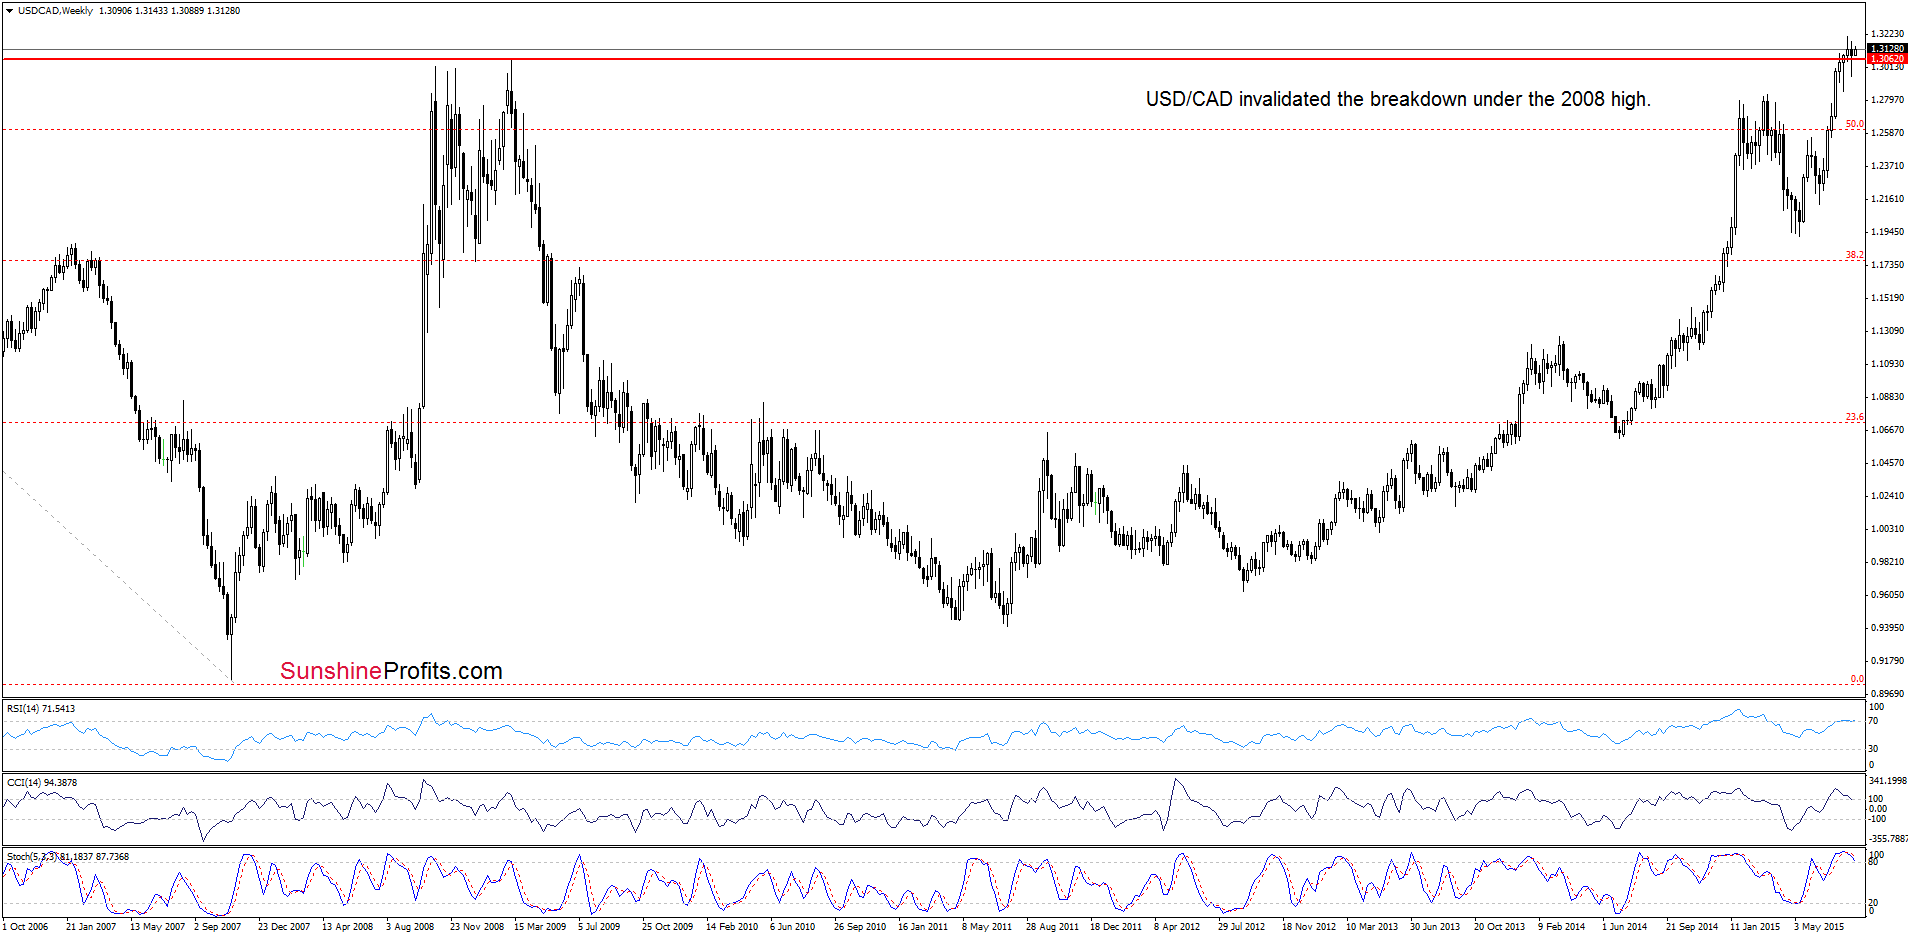
From this perspective, we see that USD/CAD closed the previous week above the 2008 high, invalidating earlier breakdown under this support, which is a positive signal that suggests further improvement and a test of the last week’s high (or even the Aug high of 1.3211) in the coming days.
Very short-term outlook: mixed with bullish bias
Short-term outlook: mixed with bullish bias
MT outlook: mixed with bullish bias
LT outlook: mixed
Trading position (short-term; our opinion): No positions are justified from the risk/reward perspective at the moment. We will keep you informed should anything change, or should we see a confirmation/invalidation of the above.
Thank you.
Nadia Simmons
Forex & Oil Trading Strategist
Przemyslaw Radomski, CFA
Founder, Editor-in-chief
Gold & Silver Trading Alerts
Forex Trading Alerts
Oil Investment Updates
Oil Trading Alerts

