

Earlier today, the Melbourne Institute showed that its inflation expectations for the next 12 months increased to 3.7%, which in combination with the turmoil caused by the devaluation of China's currency pushed the Australian dollar lower against its U.S. counterpart. As a result, AUD/USD slipped under support lines once again. Will we see fresh lows in the coming days?
In our opinion the following forex trading positions are justified - summary:
EUR/USD
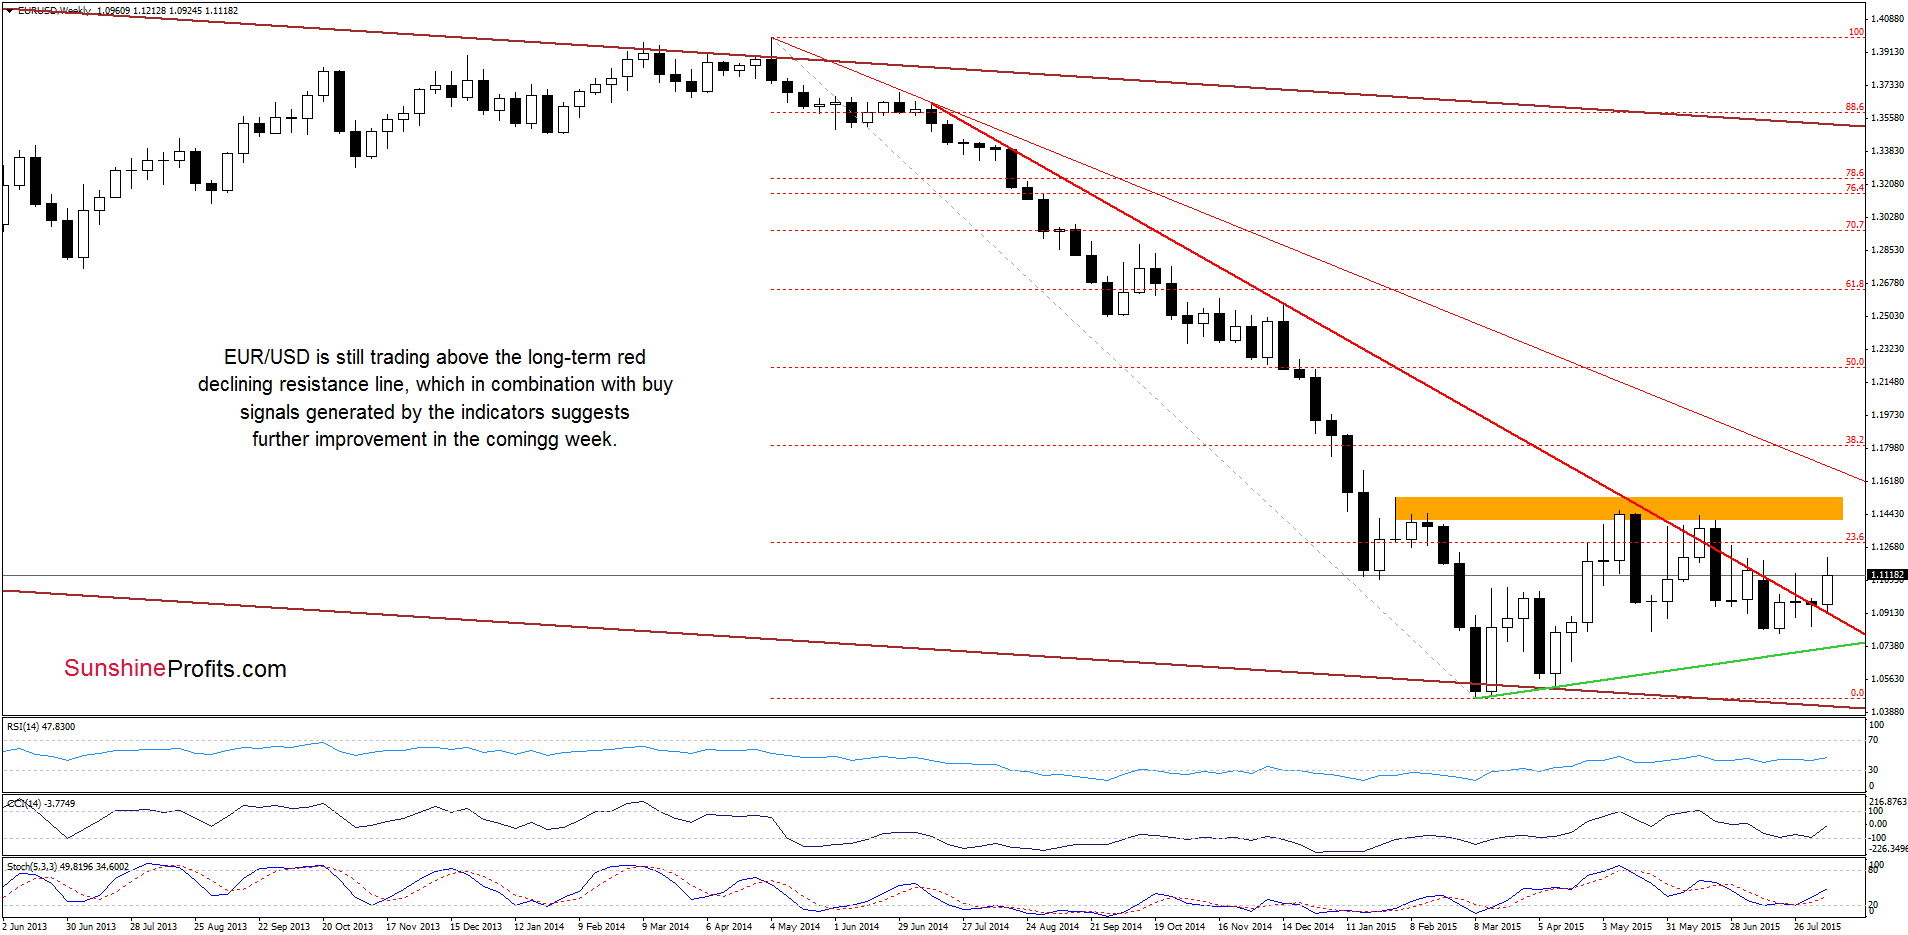
The situation in the medium term hasn’t changed much as EUR/USD is trading above the previously-broken long-term red declining resistance line, which in combination with buy signals generated by the indicators suggests further improvement.
But does the short-term chart confirm this pro growth scenario? Let’s check.
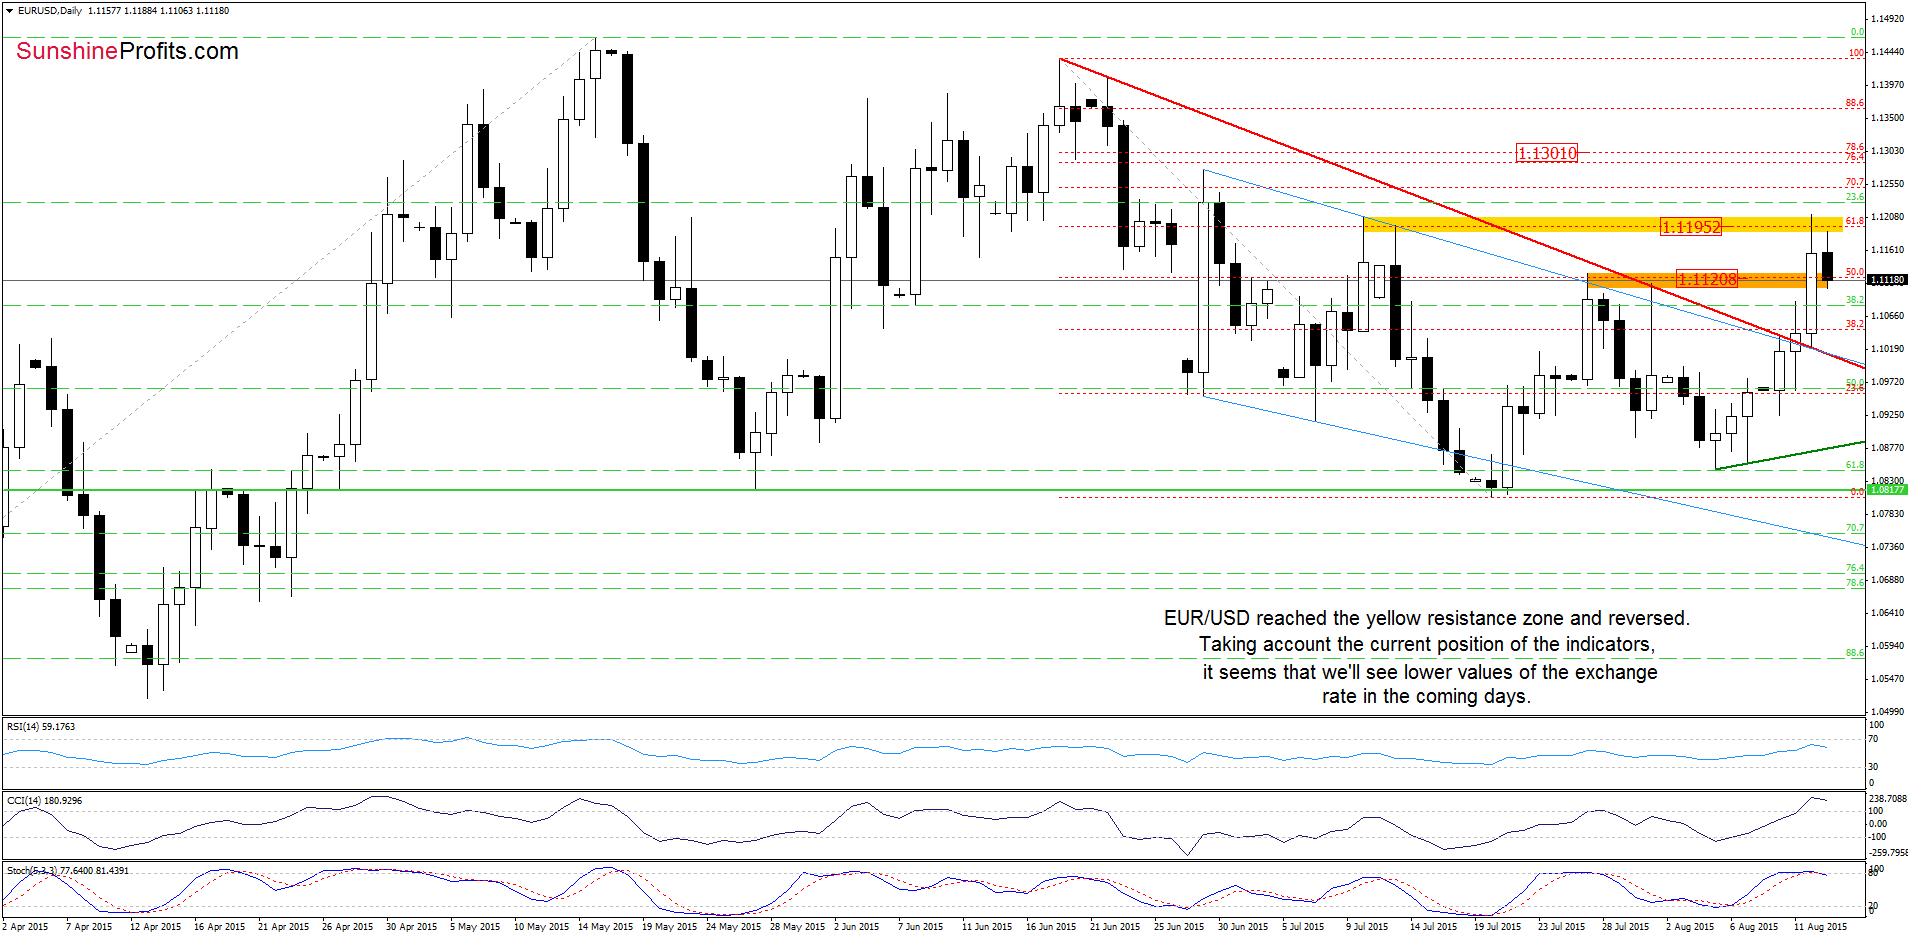
Quoting our previous commentary:
(…) EUR/USD (…) broke above (…) the orange resistance zone earlier today. Taking this factor into account, and combining it with buy signals generated by the indicators, it seems that we’ll see a test of the yellow resistance area in the coming day(s).
Looking at the daily chart we see that the situation developed in line with the above scenario and EUR/USD reached our upside target. Despite this improvement, currency bulls didn’t manage to push the pair higher, which resulted in a reversal and a drop to the orange zone. Although the pair could rebound from here, we think that the current position of the indicators will encourage currency bears to act. If this is the case, and the pair moves lower from here, we’ll likely see a test of the previously-broken red declining line in the coming days. Nevertheless, this scenario will be more likely if EUR/USD closes today’s session under the range zone.
Very short-term outlook: mixed with bearish bias
Short-term outlook: mixed
MT outlook: mixed
LT outlook: mixed
Trading position (short-term; our opinion): No positions are justified from the risk/reward perspective at the moment. We will keep you informed should anything change, or should we see a confirmation/invalidation of the above.
USD/CAD
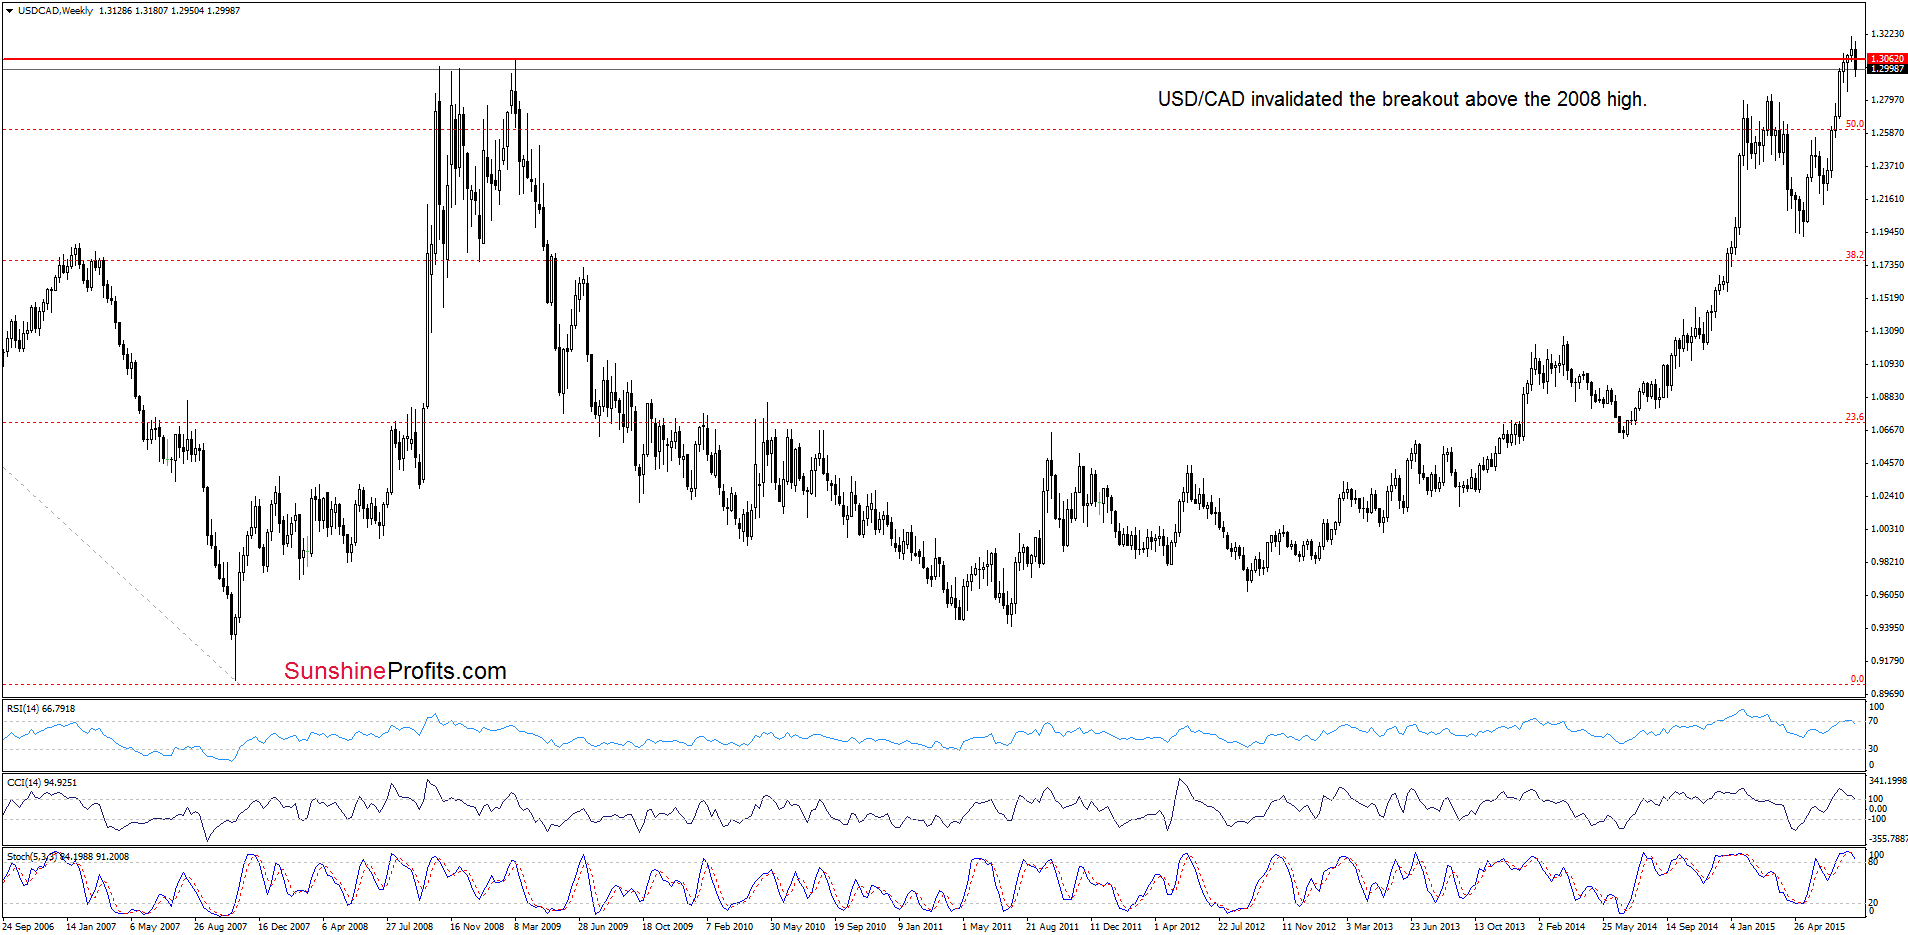
The first thing that catches the eye on the weekly chart is an invalidation of the breakout above the 2008 high. This is a negative signal, which suggests further deterioration. Nevertheless, we should keep in mind that currency bulls managed to push the pair above this resistance level (an invalidation of the breakdown) earlier this week, which suggests that as long as there is no weekly close under this resistance another attempt to move higher can’t be ruled out.
Will the very short-term picture give us more clues about future moves? Let’s check.
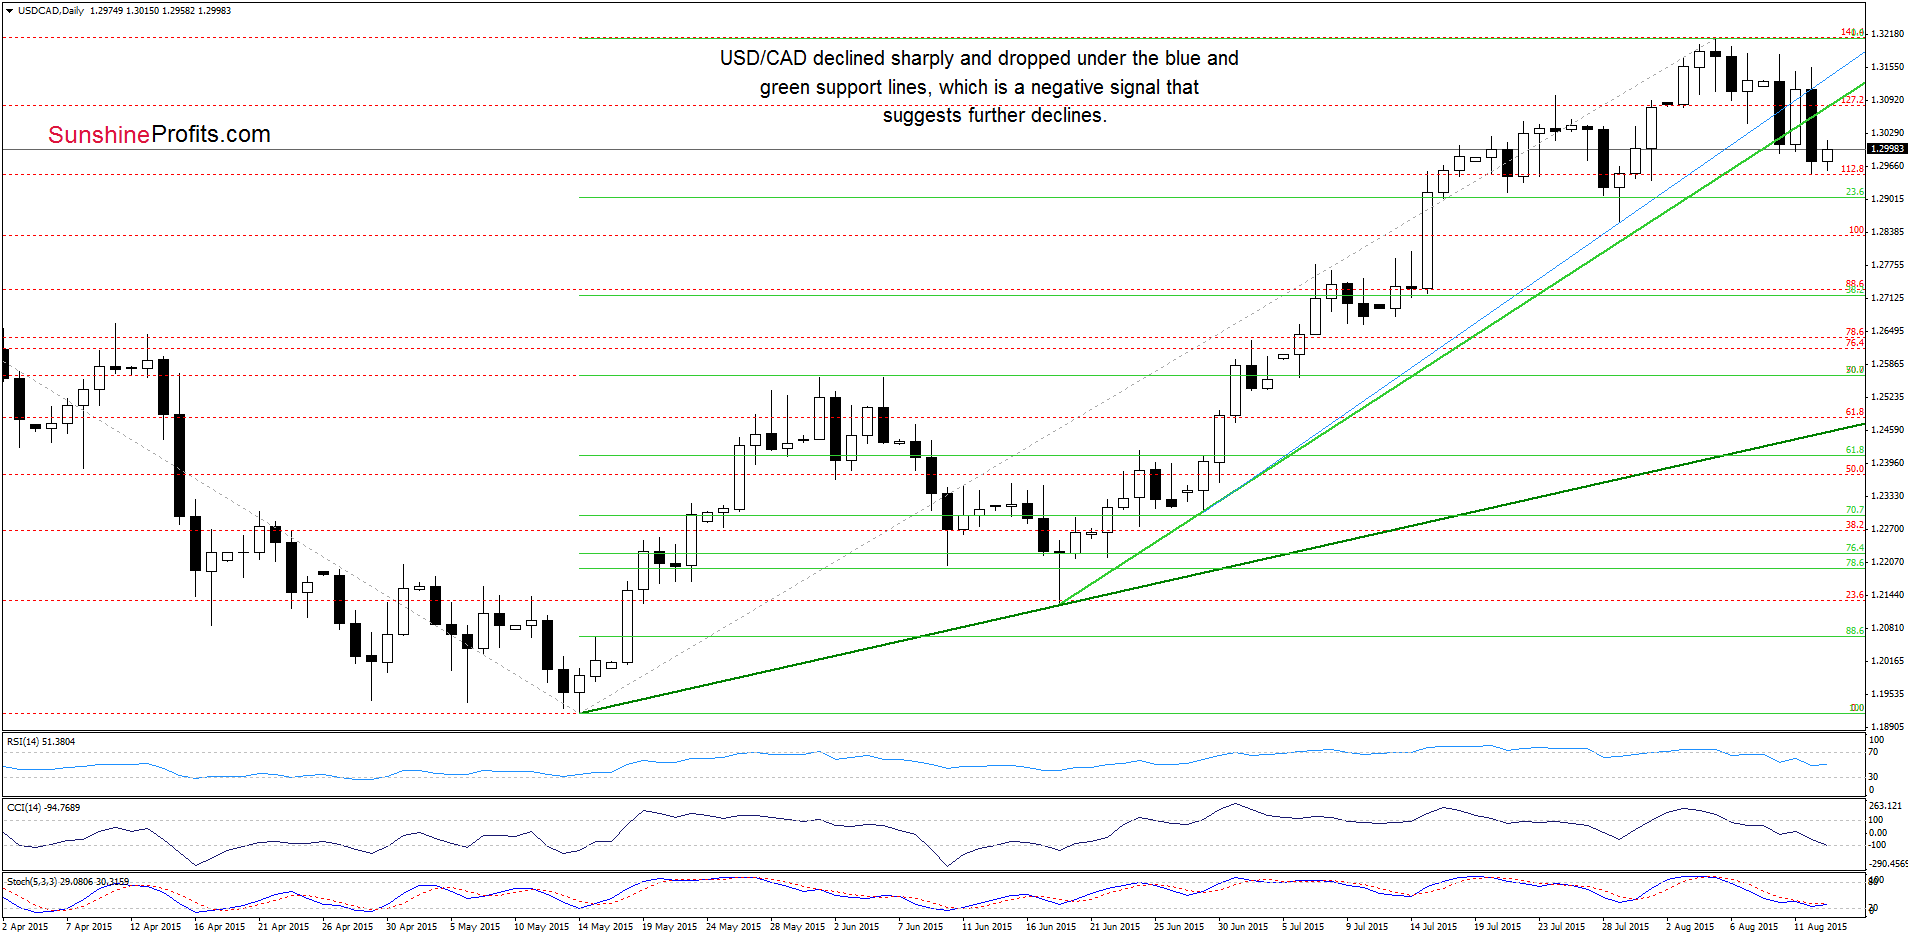
As you see on the daily chart the situation in the very short-term has deteriorated as USD/CAD reversed and declined sharply below the previously-broken blue and green support lines. Although the pair rebounded slightly earlier today, it seems that as long as the exchange rate remains under these lines (which serve now as a resistance) another downswing can’t be ruled out. Nevertheless, the current position of the Stochastic Oscillator (very close to generating a buy signal) suggests that currency bulls will likely try to push the pair higher – similarly to what we saw on Tuesday.
Very short-term outlook: mixed
Short-term outlook: mixed
MT outlook: mixed
LT outlook: mixed
Trading position (short-term; our opinion): No positions are justified from the risk/reward perspective at the moment. We will keep you informed should anything change, or should we see a confirmation/invalidation of the above.
AUD/USD
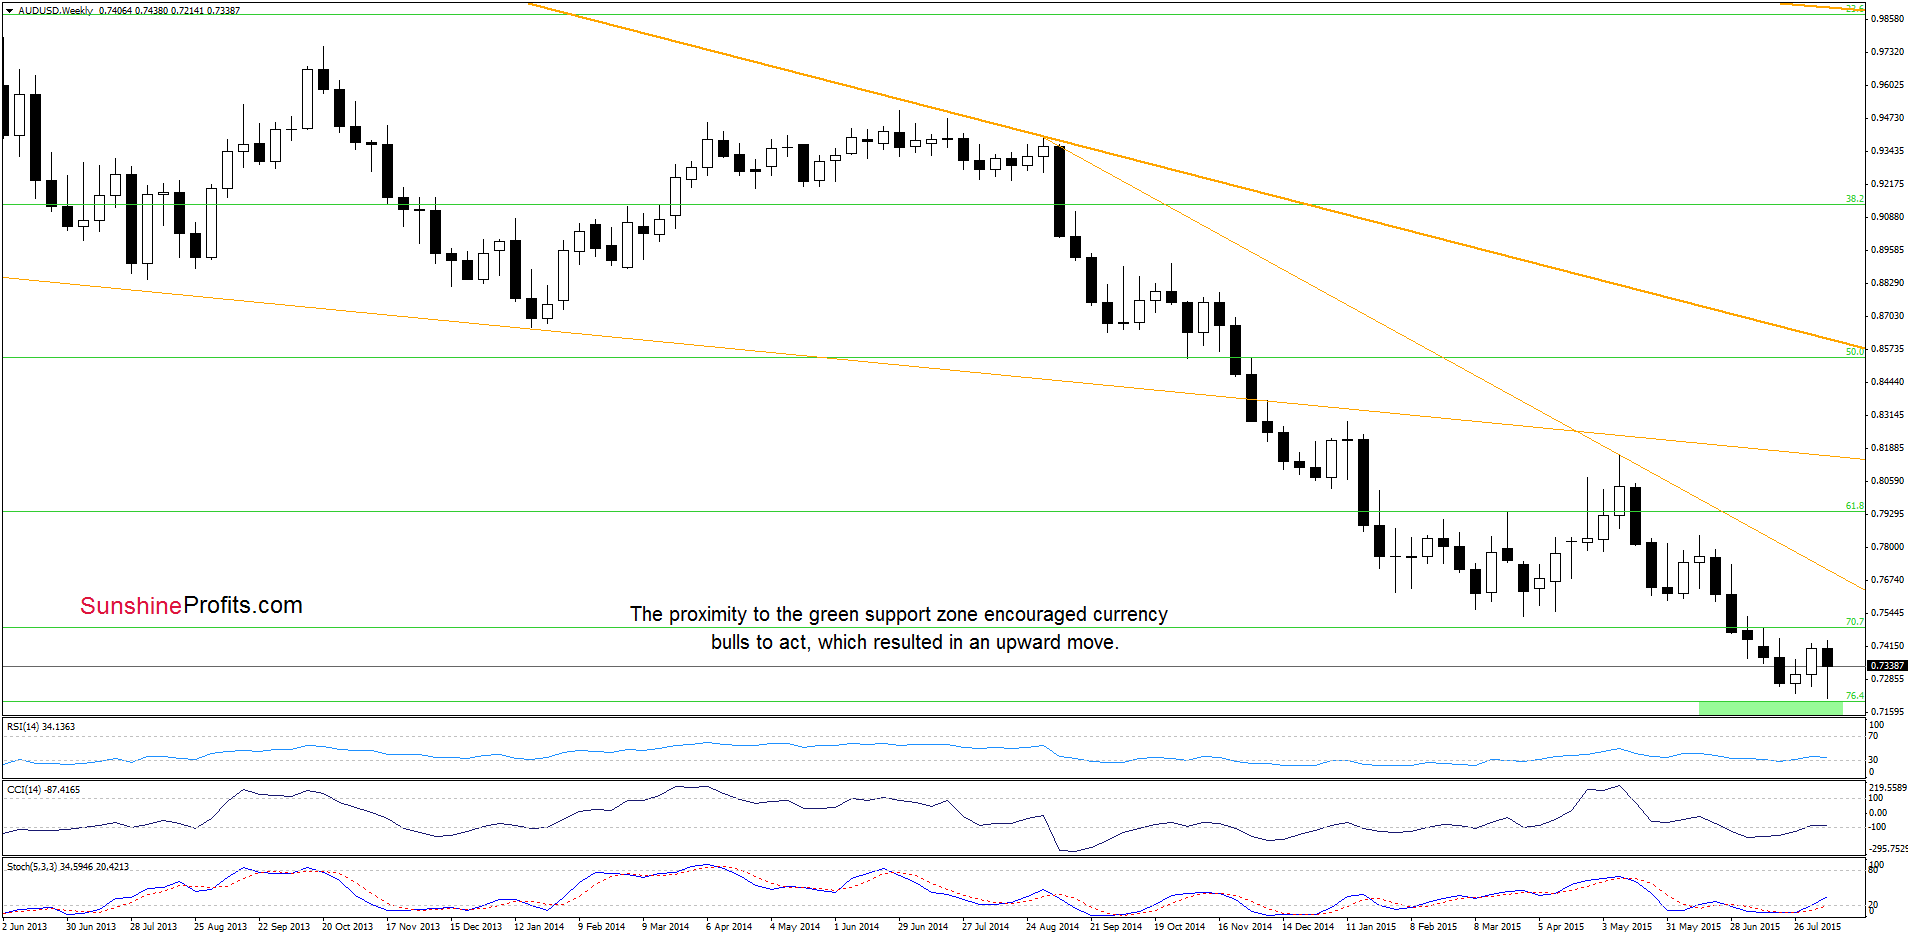
As you see on the weekly chart, the proximity to the green support zone (based on the 76.4% and 78.6% Fibonacci retracement levels) encouraged currency bulls to act, which resulted in a rebound earlier this week.
What impact did this move have on the very short-term picture? Let’s examine the daily chart and find out.
Quoting our last commentary on this currency pair:
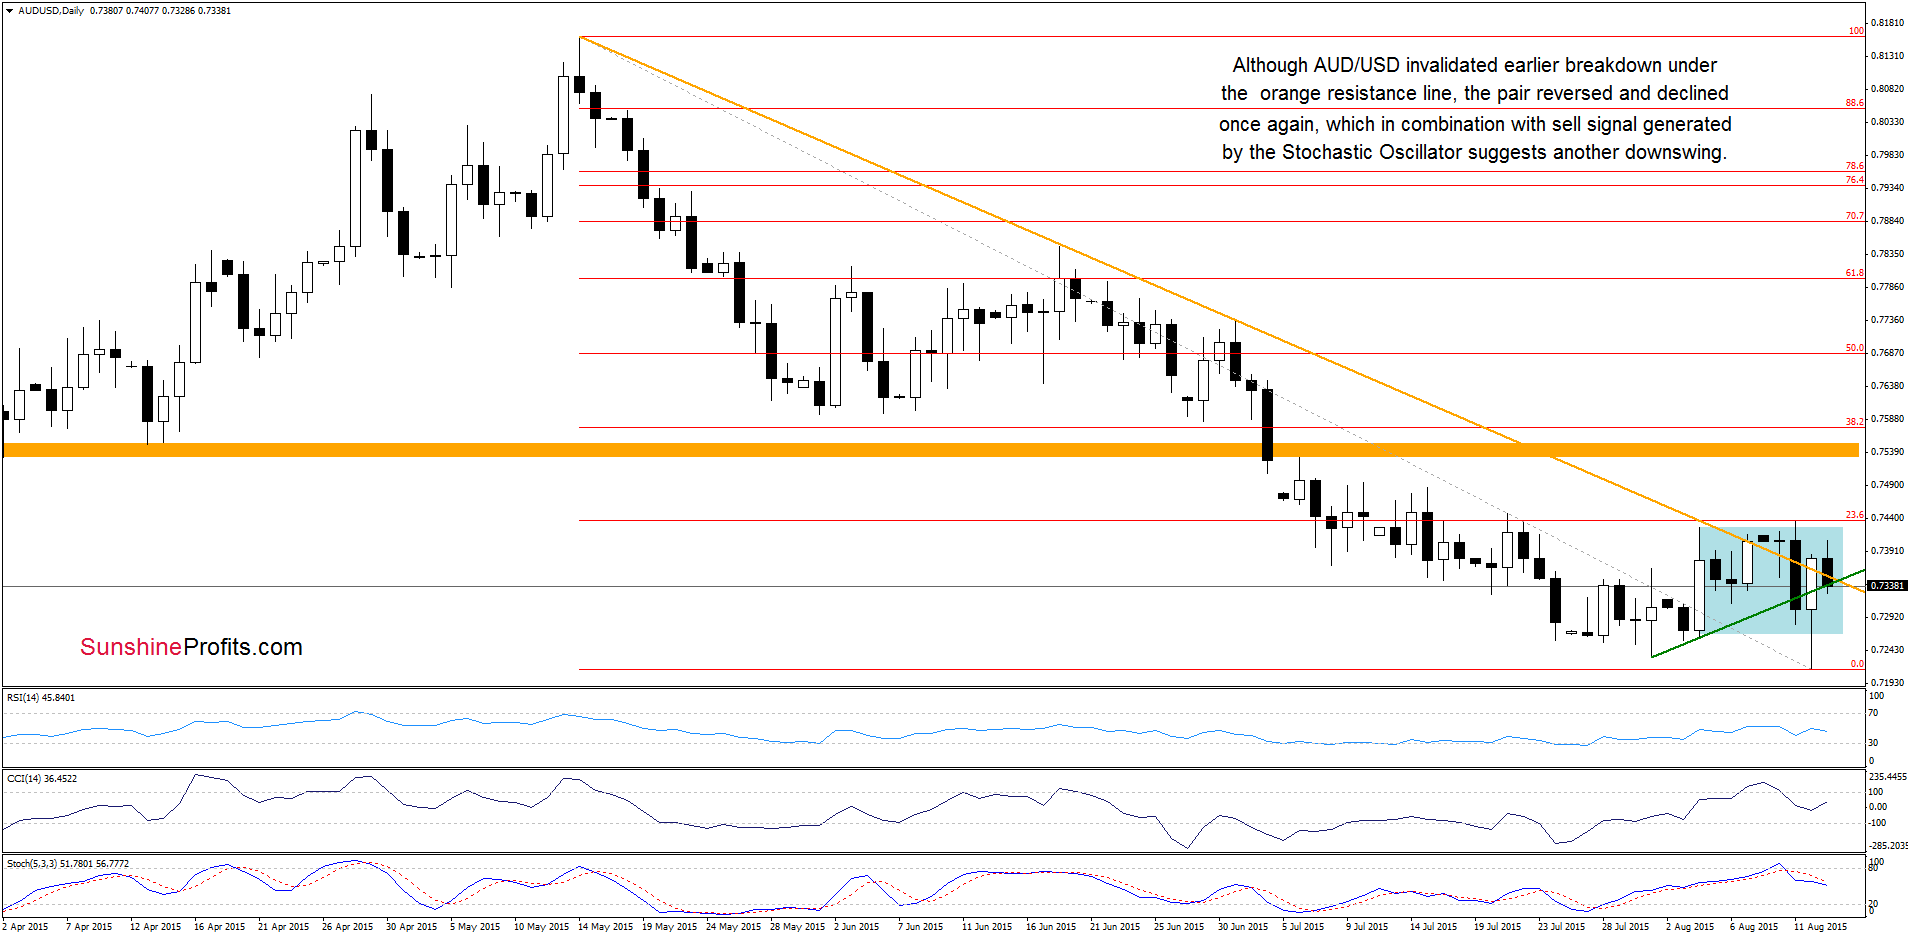
(…) AUD/USD reversed and declined, invalidating earlier breakout above the orange declining support line and the upper border of the blue consolidation. This negative event triggered a sharp decline, which took the pair to the green support line (based on the recent lows) (…) the current position of the indicators (…) suggests that further deterioration is more likely. If this is the case, and the pair moves lower for here, it would be another negative sign (…), which will likely translate to a test of the recent lows in the coming days.
Looking at the daily chart, we see that currency bears pushed the pair lower as we had expected. With this downward move, AUD/USD slipped to a fresh multi-month low. Although the exchange rate rebounded sharply and invalidated earlier breakdown under the orange declining support line, the pair reversed and declined once again. Additionally, the Stochastic Oscillator generated a sell signal, which suggests another downswing and a test of yesterday’s low in the coming day(s).
Very short-term outlook: mixed with bearish bias
Short-term outlook: mixed with bearish bias
MT outlook: mixed with bearish bias
LT outlook: mixed
Trading position (short-term; our opinion): No positions are justified from the risk/reward perspective at the moment. We will keep you informed should anything change, or should we see a confirmation/invalidation of the above.
Thank you.
Nadia Simmons
Forex & Oil Trading Strategist
Przemyslaw Radomski, CFA
Founder, Editor-in-chief
Gold & Silver Trading Alerts
Forex Trading Alerts
Oil Investment Updates
Oil Trading Alerts

