

In recent weeks, the greenback rallied from 93.30 to 98.30 supported by expectations that the U.S. central bank could raise rates later this year. However, uncertainty around Wednesday’s Fed statement encouraged investors to sell the U.S. currency, which pushed the USD Index below 97. As a result, USD/CAD invalidated earlier breakout above the Mar 2009 high. Will the exchange rate drop under 1.300 in the coming week?
In our opinion the following forex trading positions are justified - summary:
EUR/USD
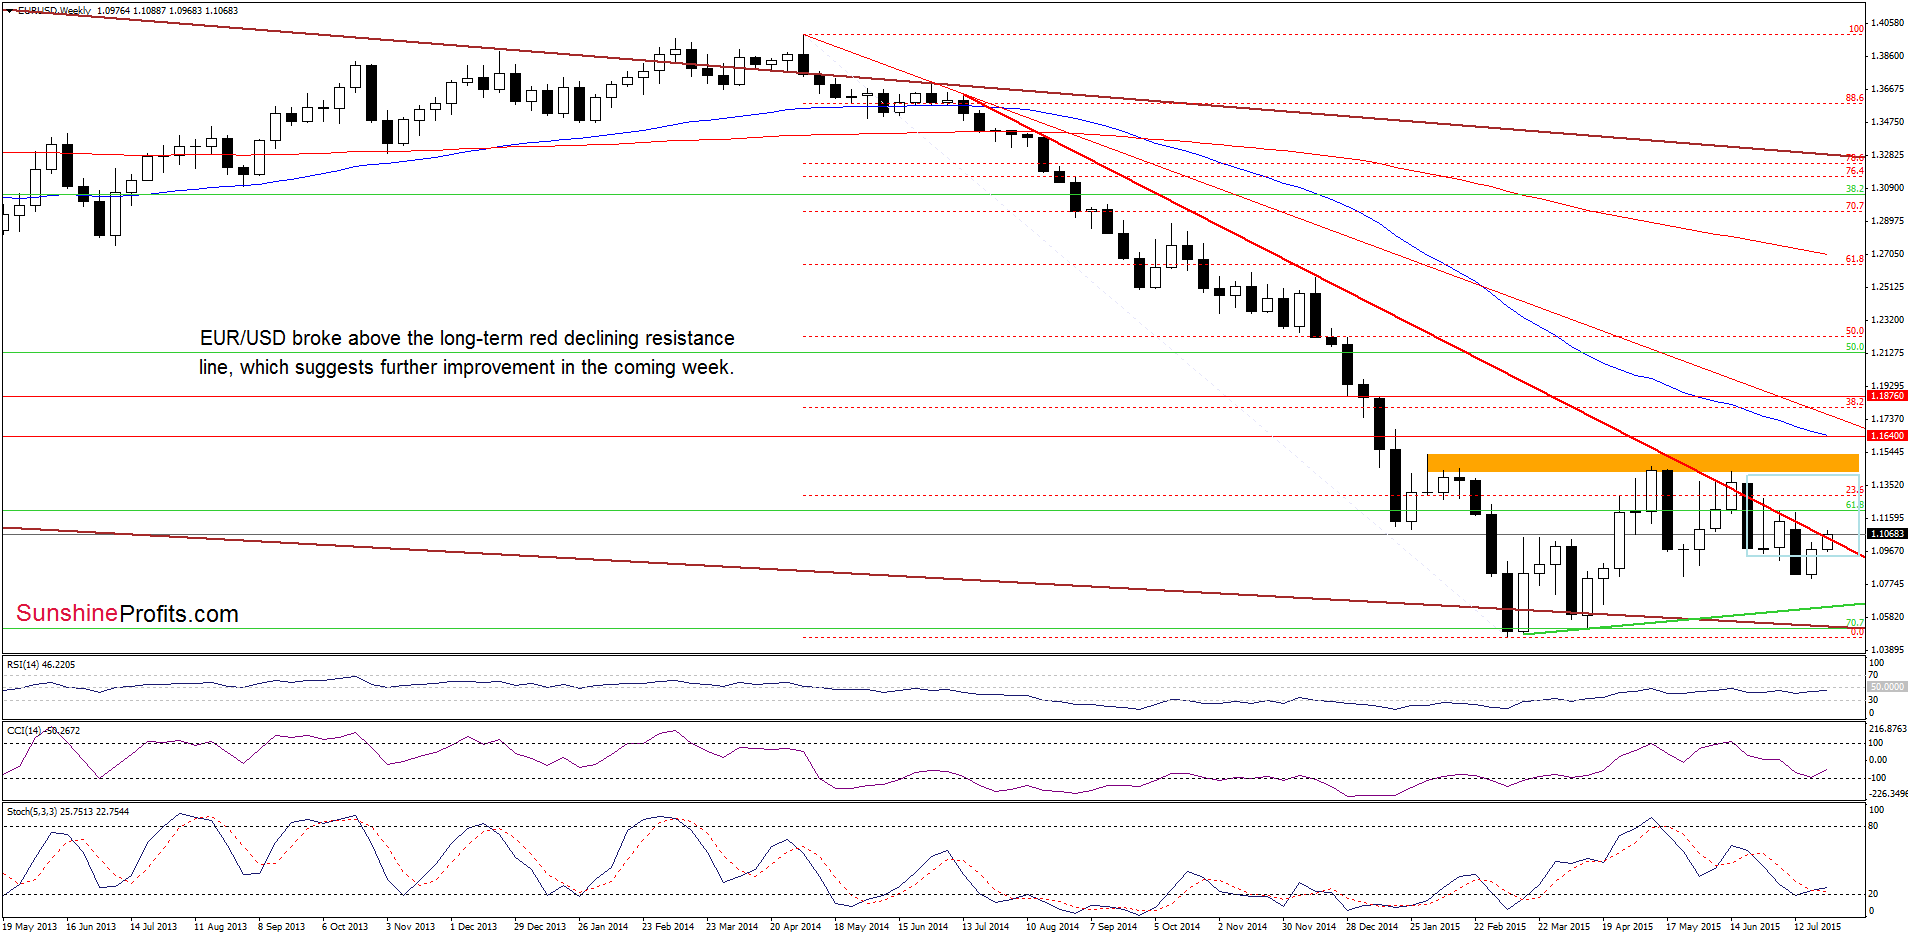
Looking at the weekly chart, we see that EUR/USD moved higher and broke above the long-term red declining resistance line, which is a very positive signal that suggests further improvement. Nevertheless, when we take a closer look at the weekly chart, we’ll notice that there were several intra-week breakouts above this major resistance in the previous weeks, but none of them was successful. Therefore, in our opinion, the current breakout will be bullish only if we see a weekly close above this key support/resistance line.
What impact did this increase have on the very short-term picture? Let’s examine the daily chart and find out.
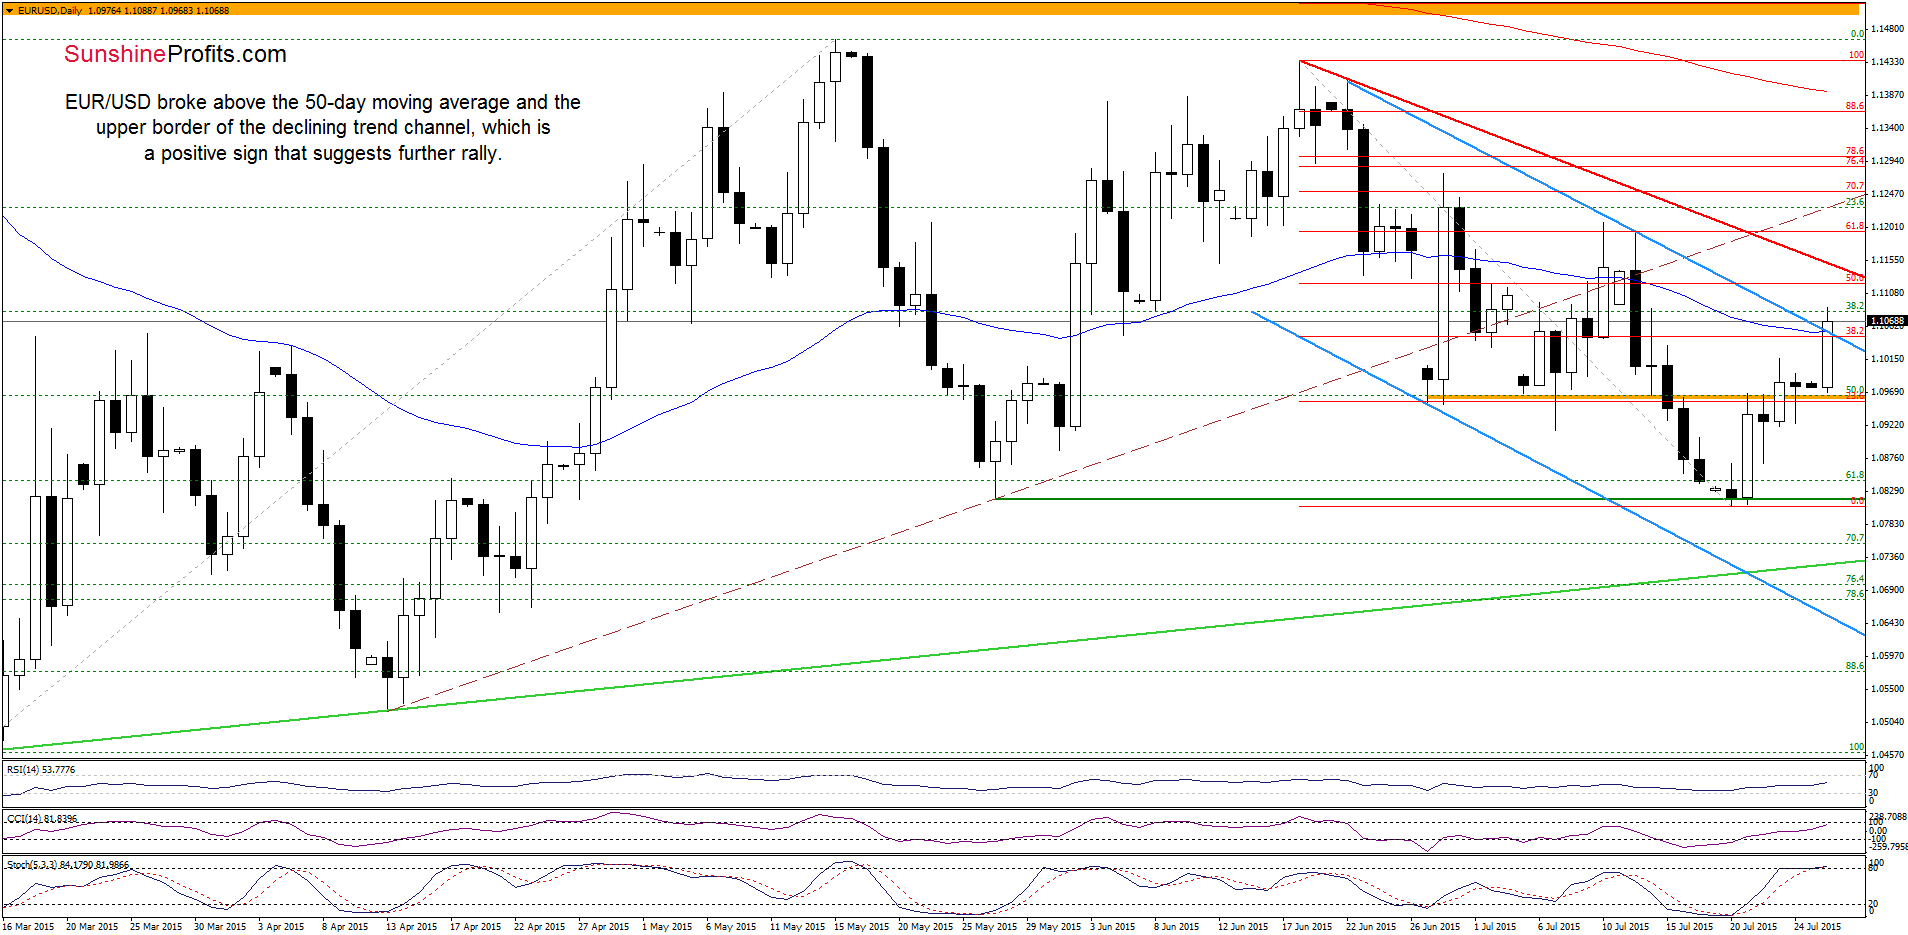
From this perspective, we see that EUR/USD bounced off the previously-broken orange zone and broke above the 50-day moving average and the upper border of the declining blue trend channel. This is a positive signal, which suggests that the exchange rate will likely test the red declining resistance line (currently around 1.1151) in the coming day(s). Nevertheless, before we see such price action, currency bulls will have to push the pair above the 50% Fibonacci retracement based on the entire Jun-Jul decline (around 1.1122).
Very short-term outlook: mixed with bullish bias
Short-term outlook: mixed
MT outlook: mixed
LT outlook: mixed
Trading position (short-term; our opinion): No positions are justified from the risk/reward perspective at the moment. We will keep you informed should anything change, or should we see a confirmation/invalidation of the above.
USD/JPY
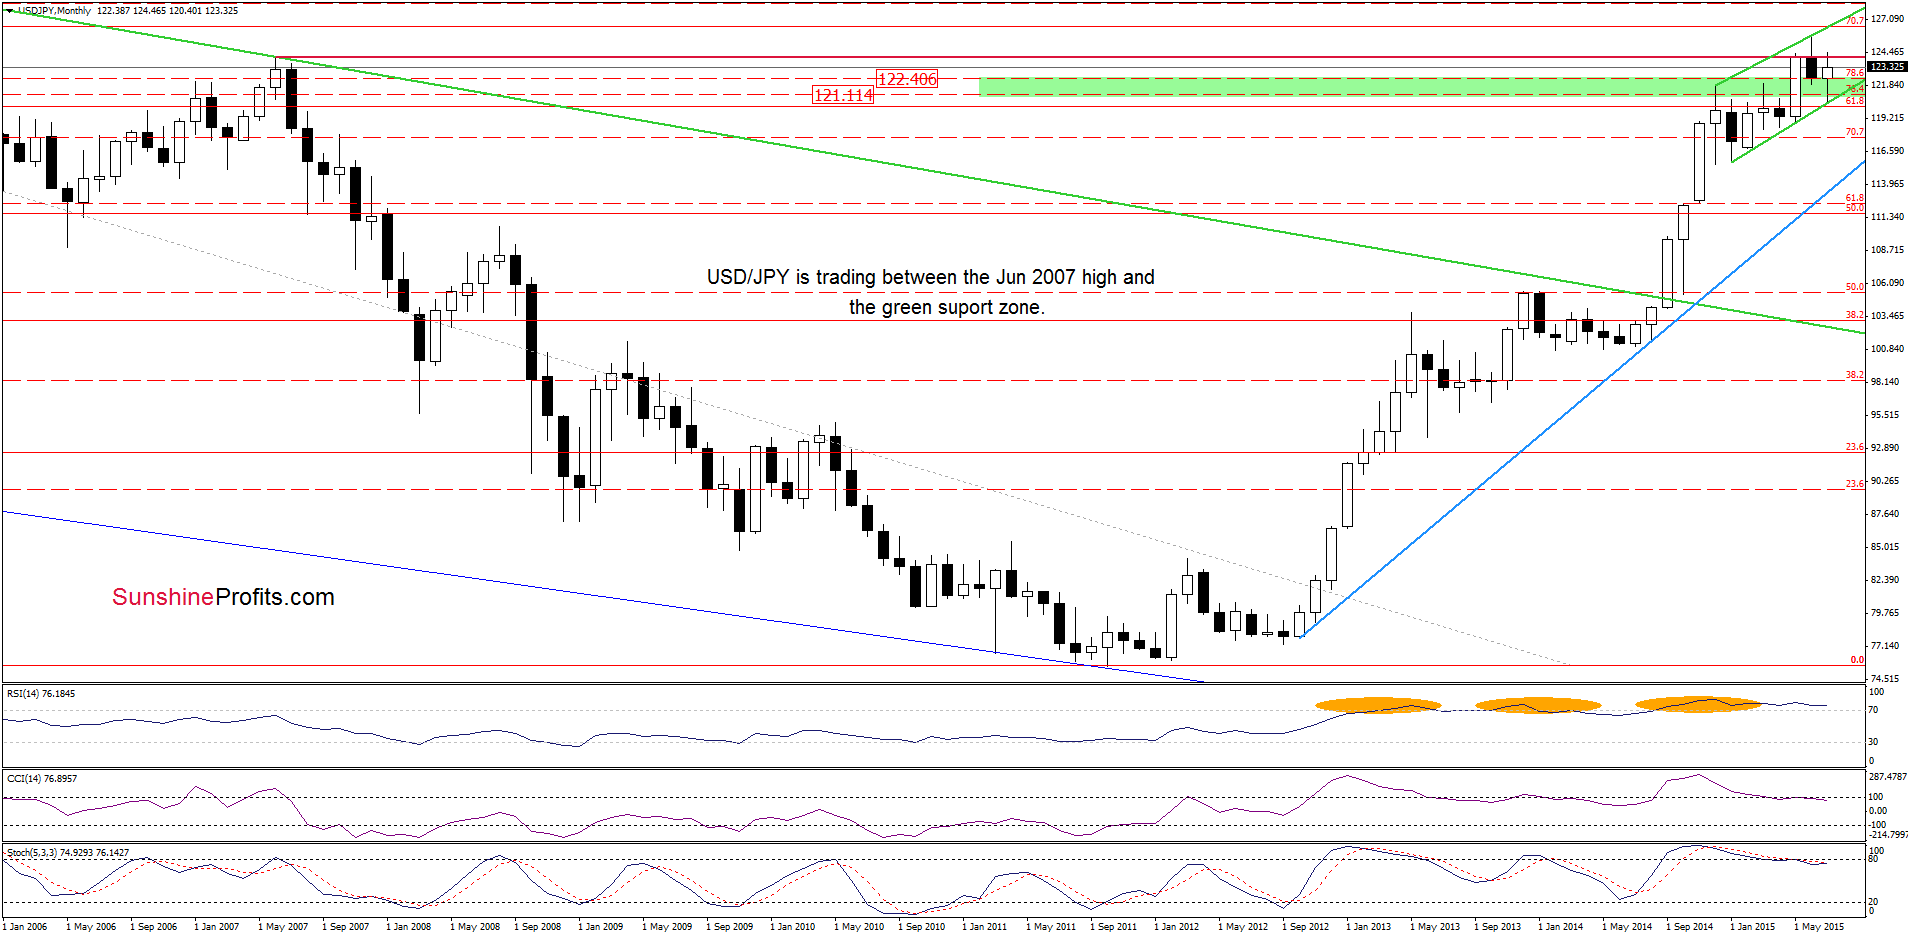
The situation in the medium term hasn’t changed much as USD/JPY is trading between the June 2007 high and the green support zone created by the previously-broken 76.4% and 78.6% Fibonacci retracement levels.
Today, we’ll focus on the very short-term picture.
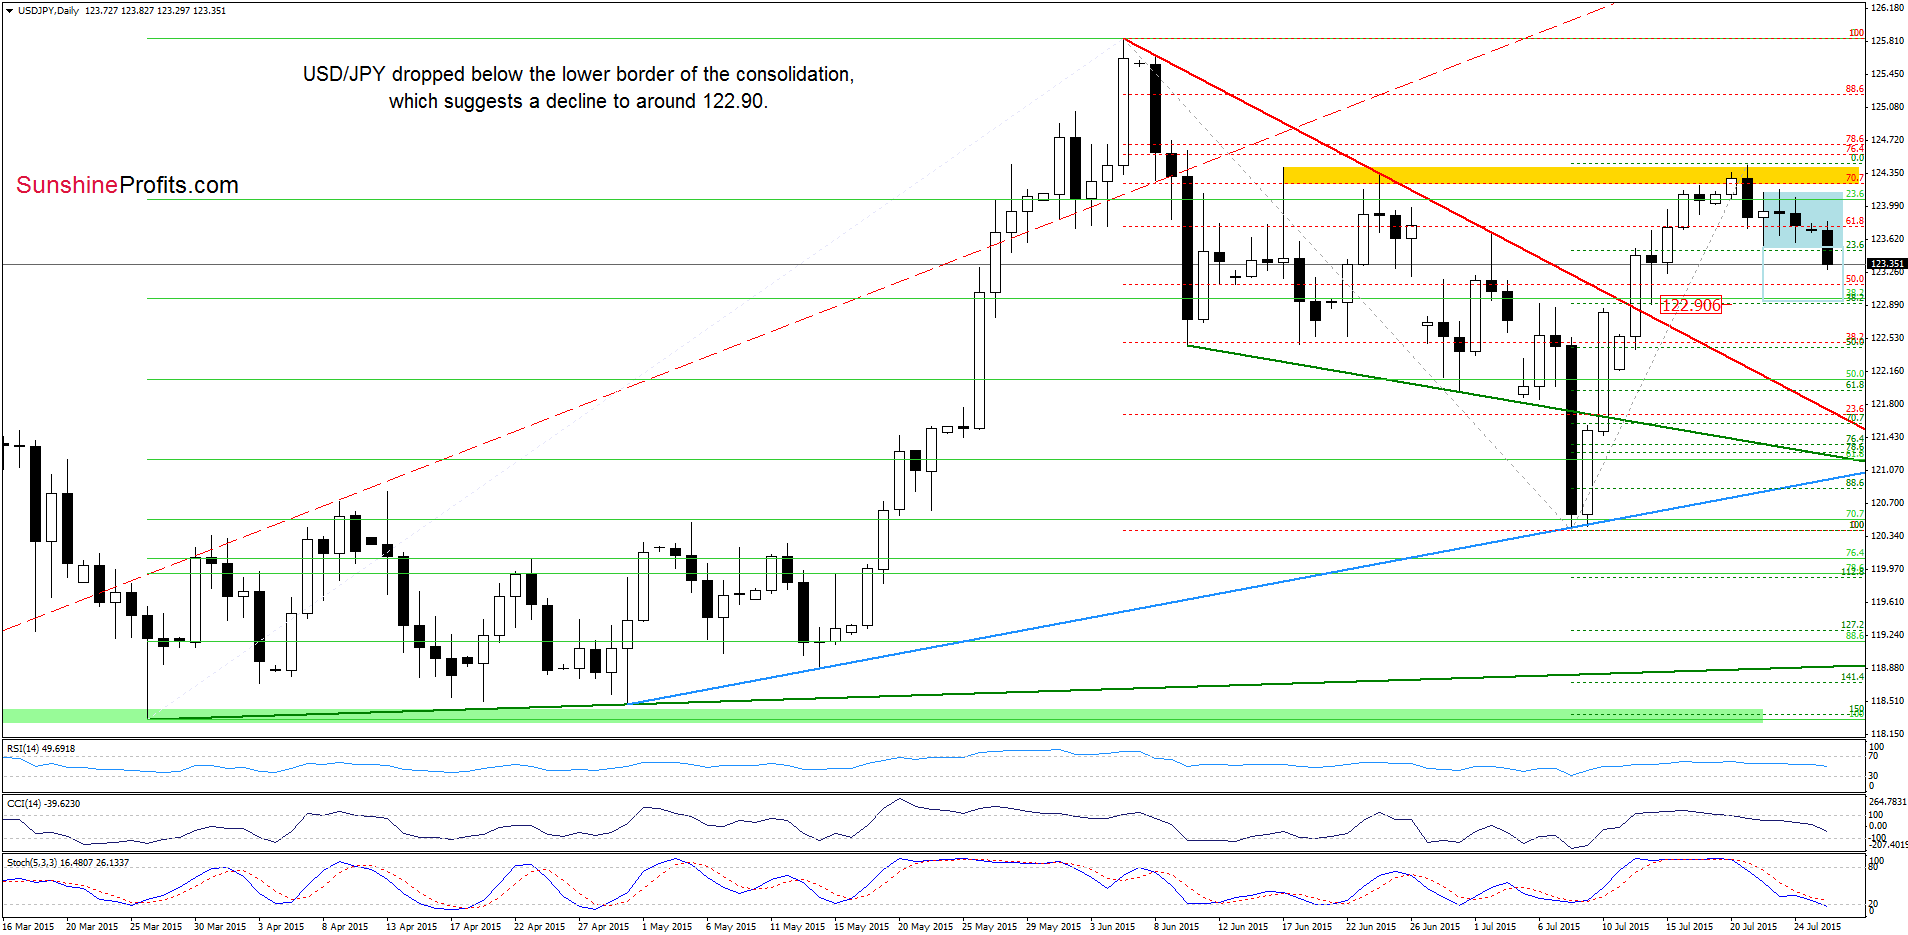
On the above chart, we see that USD/JPY broke below the lower border of the blue consolidation and the 23.6% Fibonacci retracement, which is a negative signal that suggests further deterioration and a drop to around 122.90, where the next Fibonacci retracement is (in this area, the size of the downward move will also correspond to the height of he formation). Additionally, sell signals generated by the indicators support the bearish case at the moment.
Very short-term outlook: bearish
Short-term outlook: mixed
MT outlook: mixed
LT outlook: mixed
Trading position (short-term; our opinion): No positions are justified from the risk/reward perspective at the moment. We will keep you informed should anything change, or should we see a confirmation/invalidation of the above.
USD/CAD
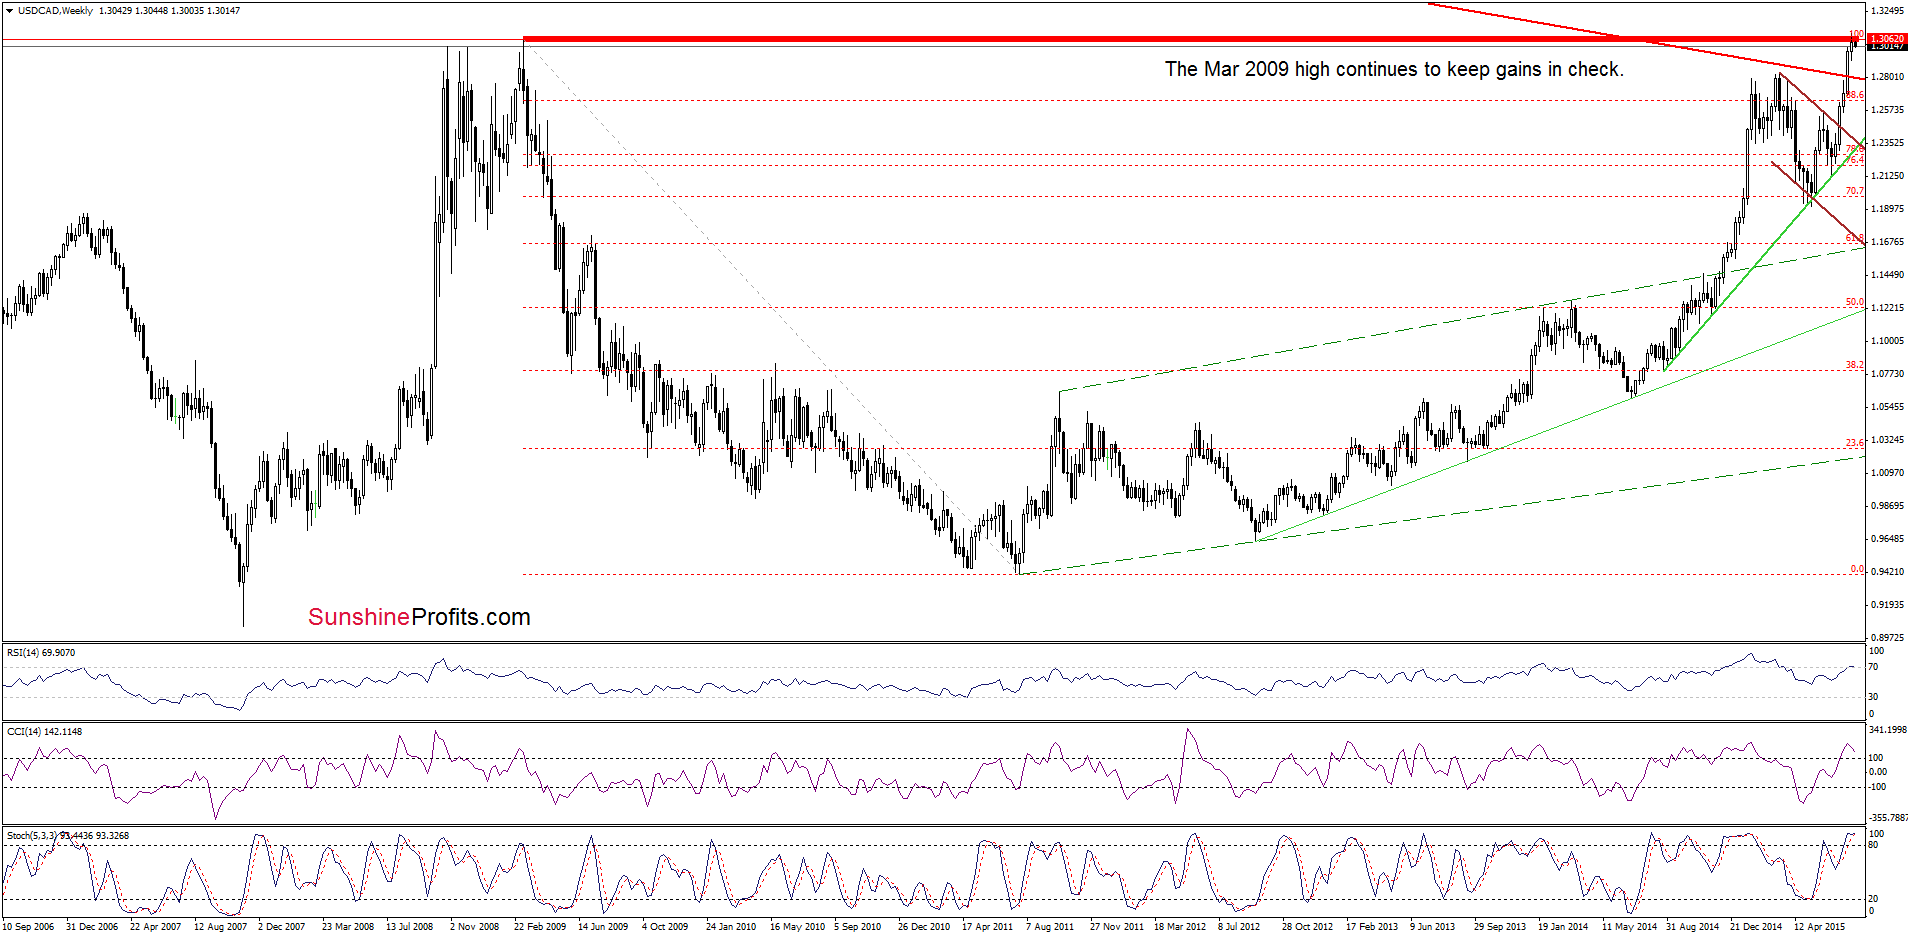
On Friday, USD/CAD moved higher once again and broke above the Mar 2009 high. Despite this move, currency bulls didn’t manage to hold gained levels, which resulted in a reversal and an invalidation of earlier small breakout. This is a negative sign, which suggests that the exchange rate could go lower in the coming week – especially when we factor in the current situation in the indicators (there are negative divergences between the RSI, CCI and USD/CAD, while the Stochastic Oscillator is overbought and very close to generating a sell signal).
Having said that, let’s take a closer look at the daily chart. Will it give us more clues about future moves?
On Friday, we wrote the following:
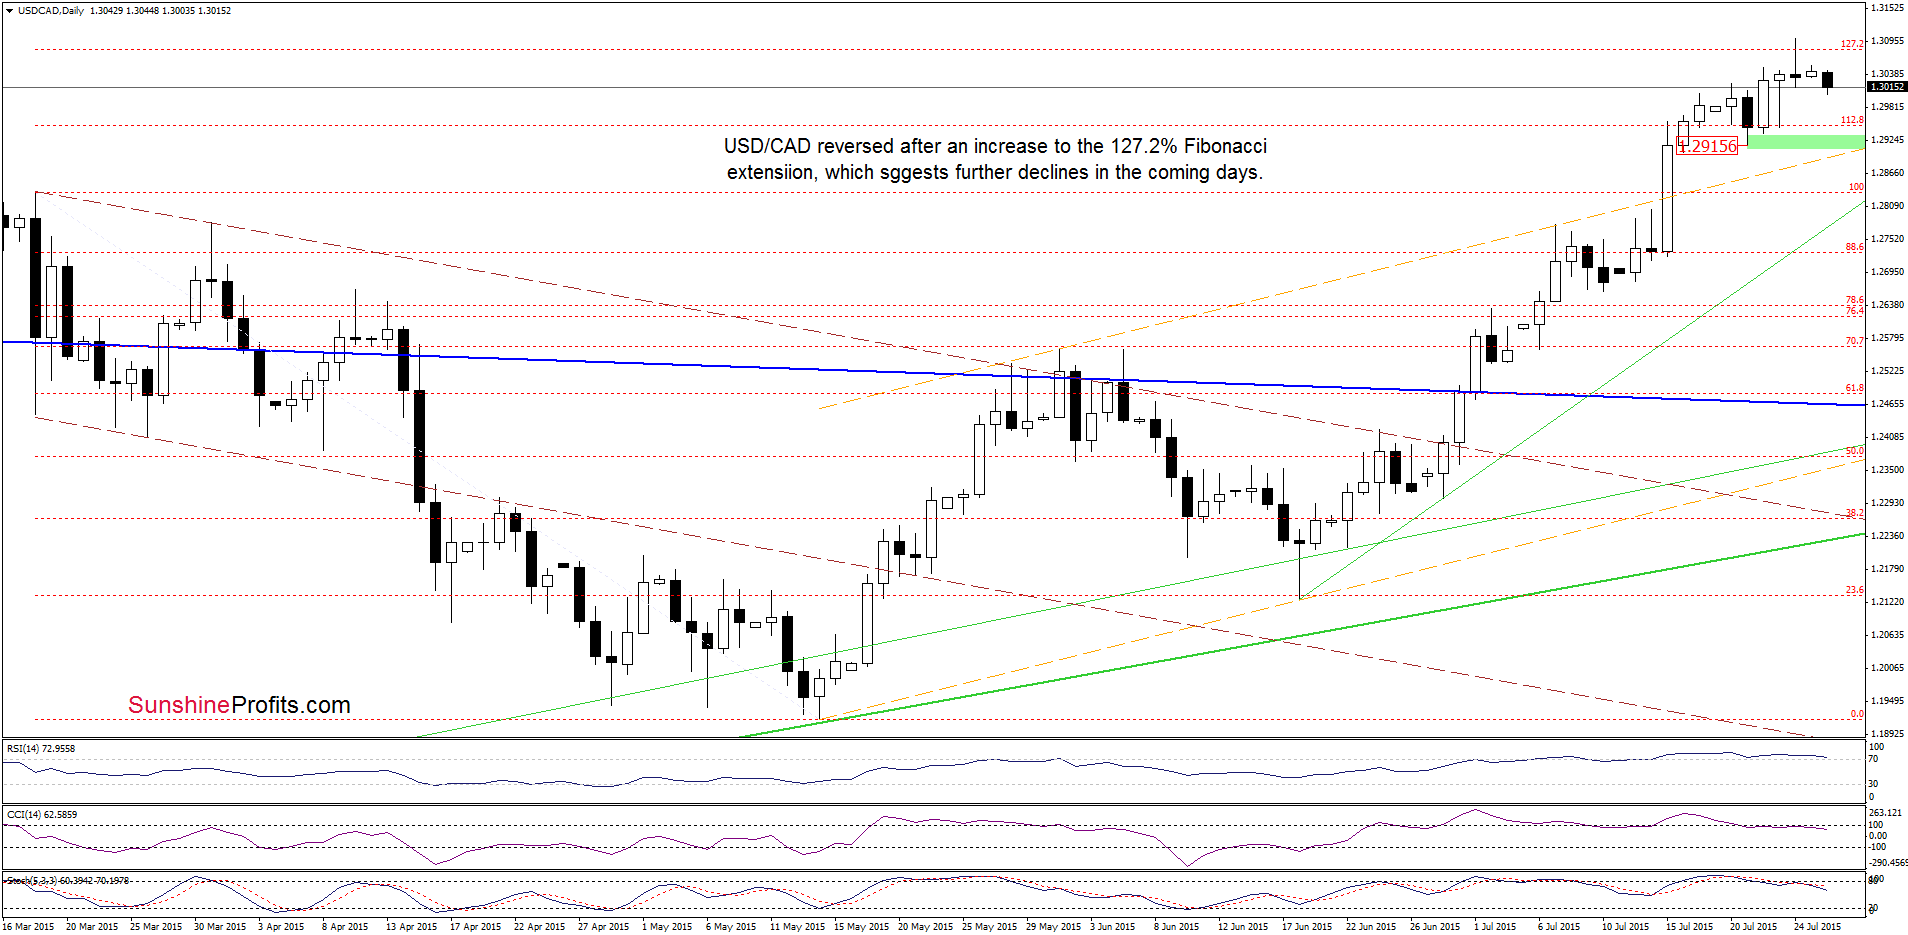
(…) USD/CAD reversed and came back above the psychological barrier of 1,300, which suggests further improvement and an increase to around 1.3078, where the 127.2% Fibonacci extension is.
Looking at the daily chart, we see that the situation developed in line with the above scenario and USD/CAD reached our upside target. Despite this improvement, the pair reversed, invalidating earlier breakout, which encouraged currency bears to act earlier today. Taking the above into account, and combining it with sell signals generated by the CCI and Stochastic Oscillator, it seems that lower values of USD/CAD in the coming week are more likely than not. If this is the case, and the pair extends losses, the initial downside target would be around 1.2915, where the bottom of the previous pullback is (marked with green).
Very short-term outlook: mixed with bearish bias
Short-term outlook: mixed with bearish bias
MT outlook: mixed with bearish bias
LT outlook: mixed
Trading position (short-term; our opinion): No positions are justified from the risk/reward perspective at the moment. We will keep you informed should anything change, or should we see a confirmation/invalidation of the above.
Thank you.
Nadia Simmons
Forex & Oil Trading Strategist
Przemyslaw Radomski, CFA
Founder, Editor-in-chief
Gold & Silver Trading Alerts
Forex Trading Alerts
Oil Investment Updates
Oil Trading Alerts

