

Although the USD Index slipped below 97, bullish jobless claims data supported the greenback, which resulted in a rebound and invalidation of earlier breakdown. This positive signal, in combination with the solid support area, triggered further improvement earlier today. What impact did this move have on our six currency pairs?
In our opinion the following forex trading positions are justified - summary:
- EUR/USD: short (stop-loss order at 1.1058)
- GBP/USD: none
- USD/JPY: none
- USD/CAD: none
- USD/CHF: none
- AUD/USD: none
Before we take a closer look at the current picture of our currency pairs, let’s examine the daily chart of the USD Index once again.
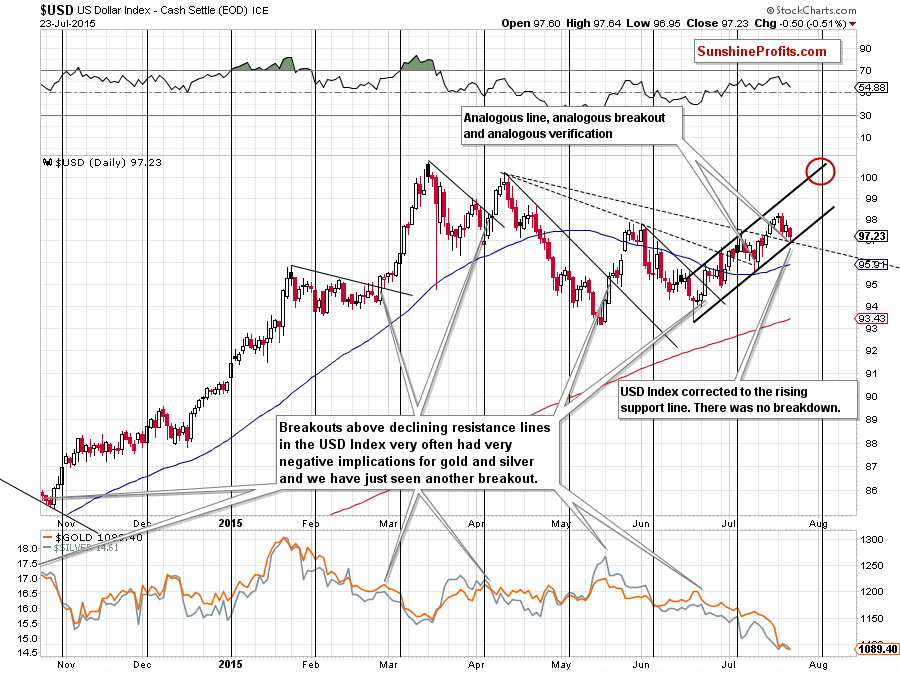
Looking at the daily chart, we see that the USD Index moved lower and re-tested not only the black dashed line (based on the Apr 13 and Jul 7 highs), but also the black rising line based on the Jun 18 and Jul 10 lows (which serves as an additional support at the moment). What impact did it have on the greenback? The USD Index bounced off this area and came back above 97, which suggests higher values of the index – similarly to what we saw in mid-Jul (back then, the dollar moved sharply higher after a drop to analogous lines). Therefore, if we see such price action and the U.S. dollar rebounds from here, we may see a rally even to around 100 in the coming week.
Having said that, let’s take a look at our currency pairs below.
EUR/USD
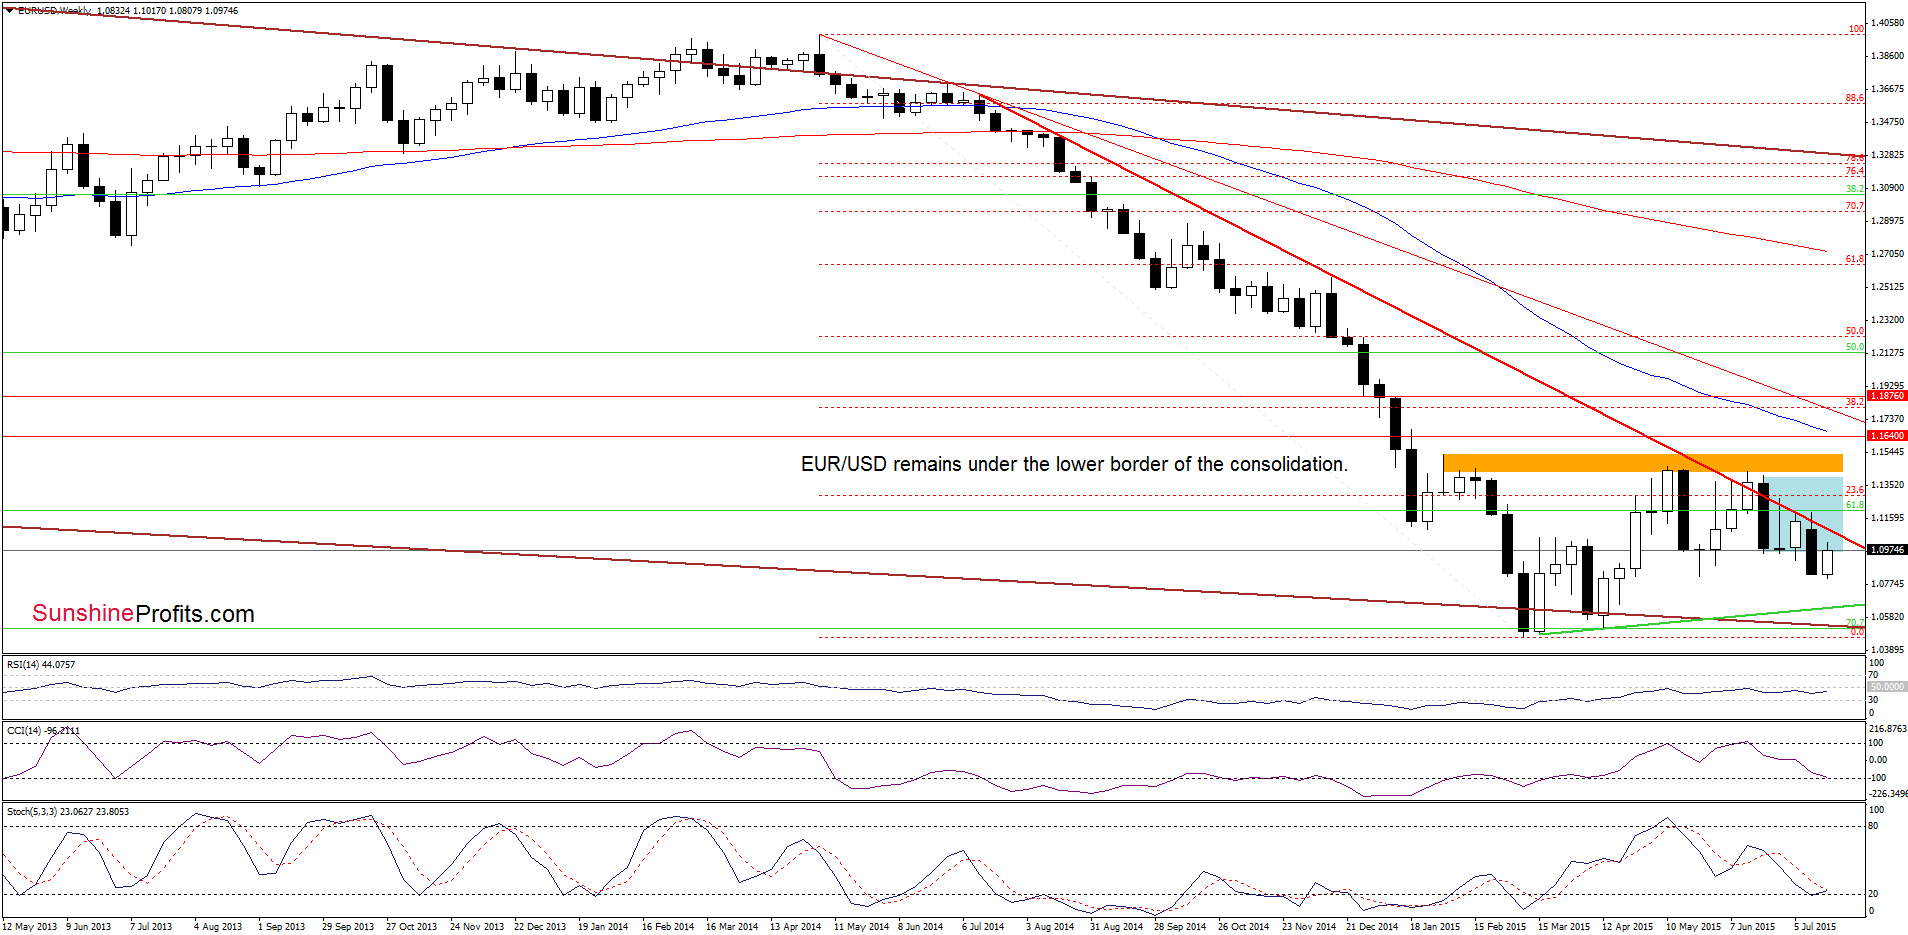
Although EUR/USD moved higher, the pair remains under the lower border of the blue consolidation, which suggests that another attempt to move lower is likely.
Will the daily chart give us more clues about future moves? Let’s find out.
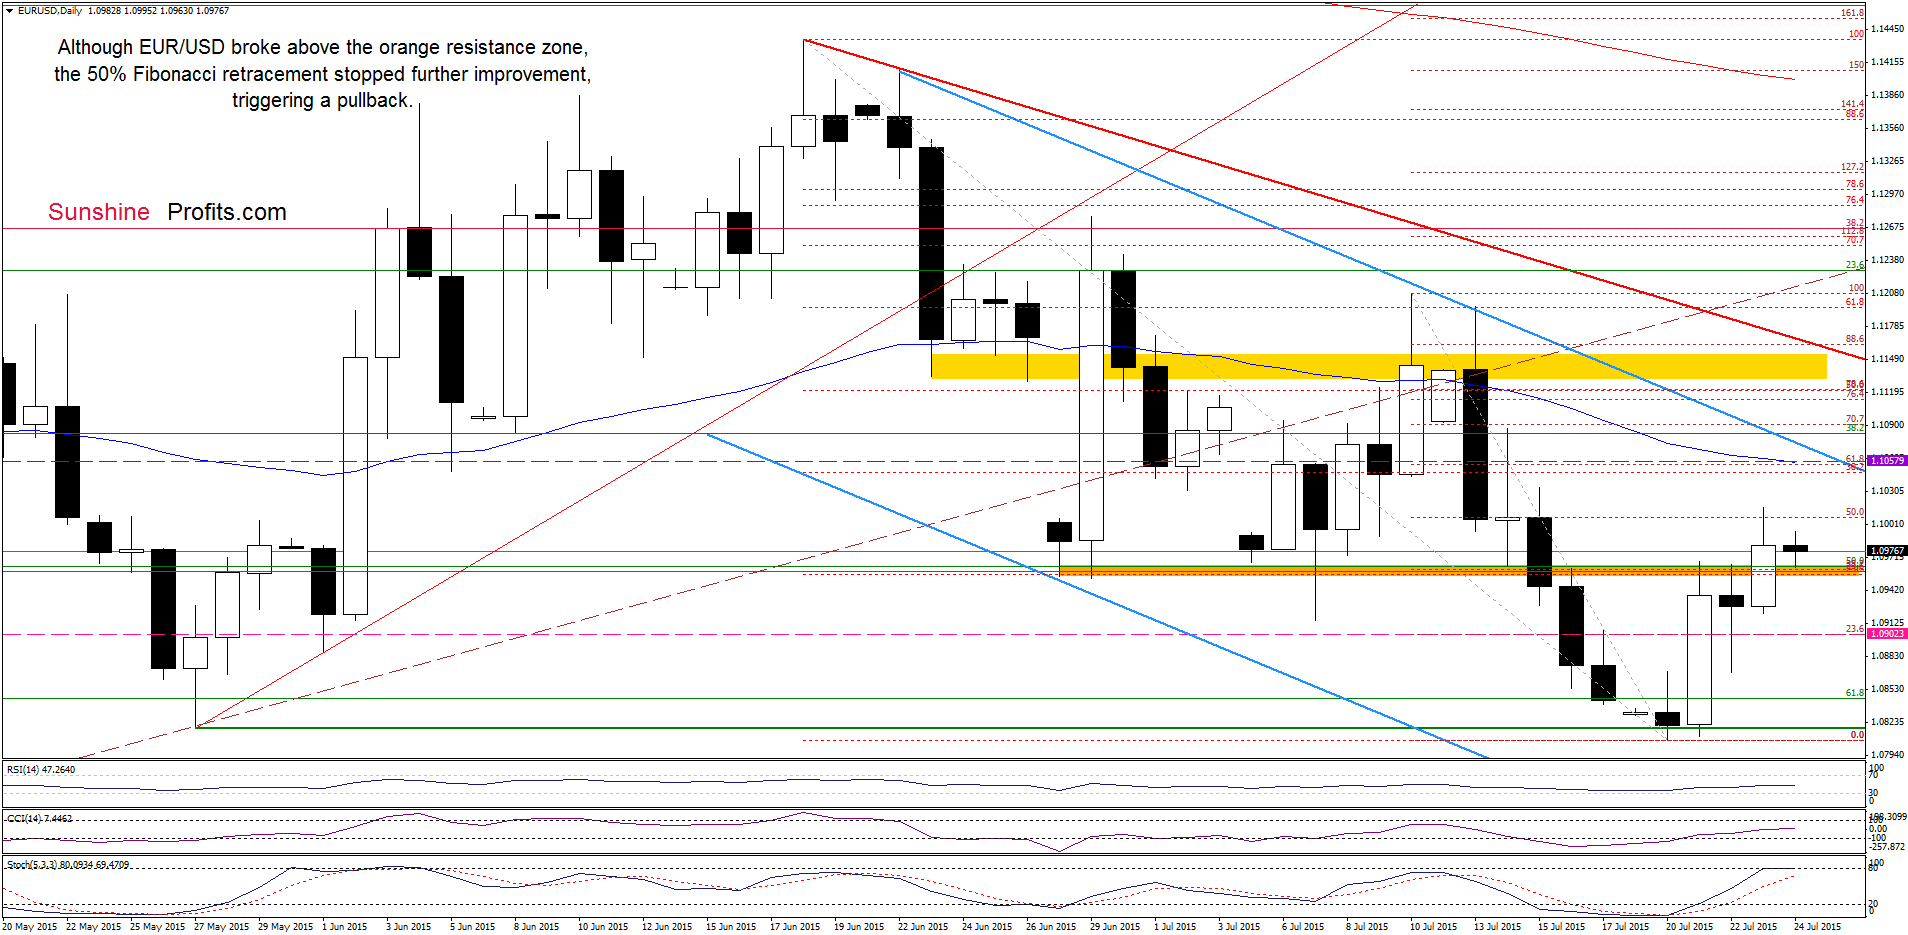
Looking at the daily chart, we see that although EUR/USD broke above the orange resistance zone, the 50% Fibonacci retracement (based on the recent downward move started on Jul 10) stopped further rally and triggered a pullback, which took the exchange rate to the previously-broken orange zone earlier today. What’s next? Taking into account the current situation in the USD Index, we believe that lower values of the exchange rate are ahead us. If this is the case, and the pair closes today’s session under the orange area, it would be a bearish signal, which will trigger further deterioration (and a test of the recent lows) in the coming days.
Very short-term outlook: bearish
Short-term outlook: mixed with bearish bias
MT outlook: mixed
LT outlook: mixed
Trading position (short-term; our opinion): Short positions with a stop-loss order at 1.1058 are justified from the risk/reward perspective at the moment. We will keep you informed should anything change, or should we see a confirmation/invalidation of the above.
GBP/USD
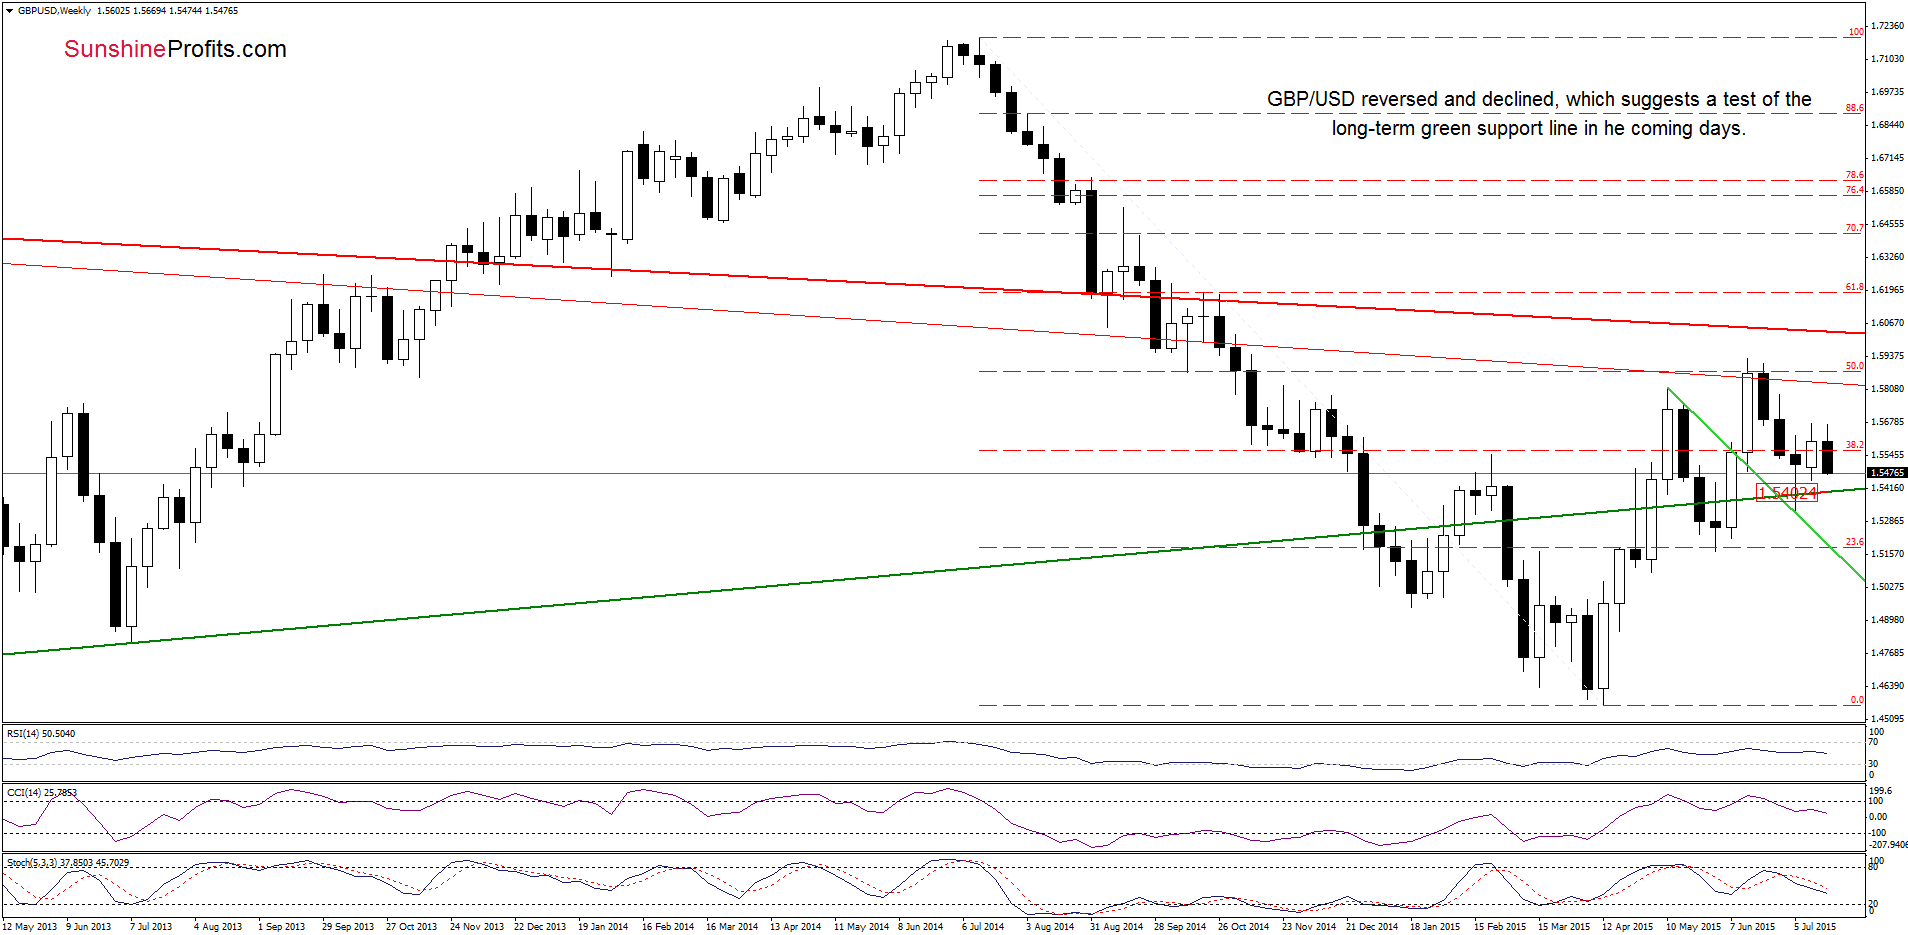
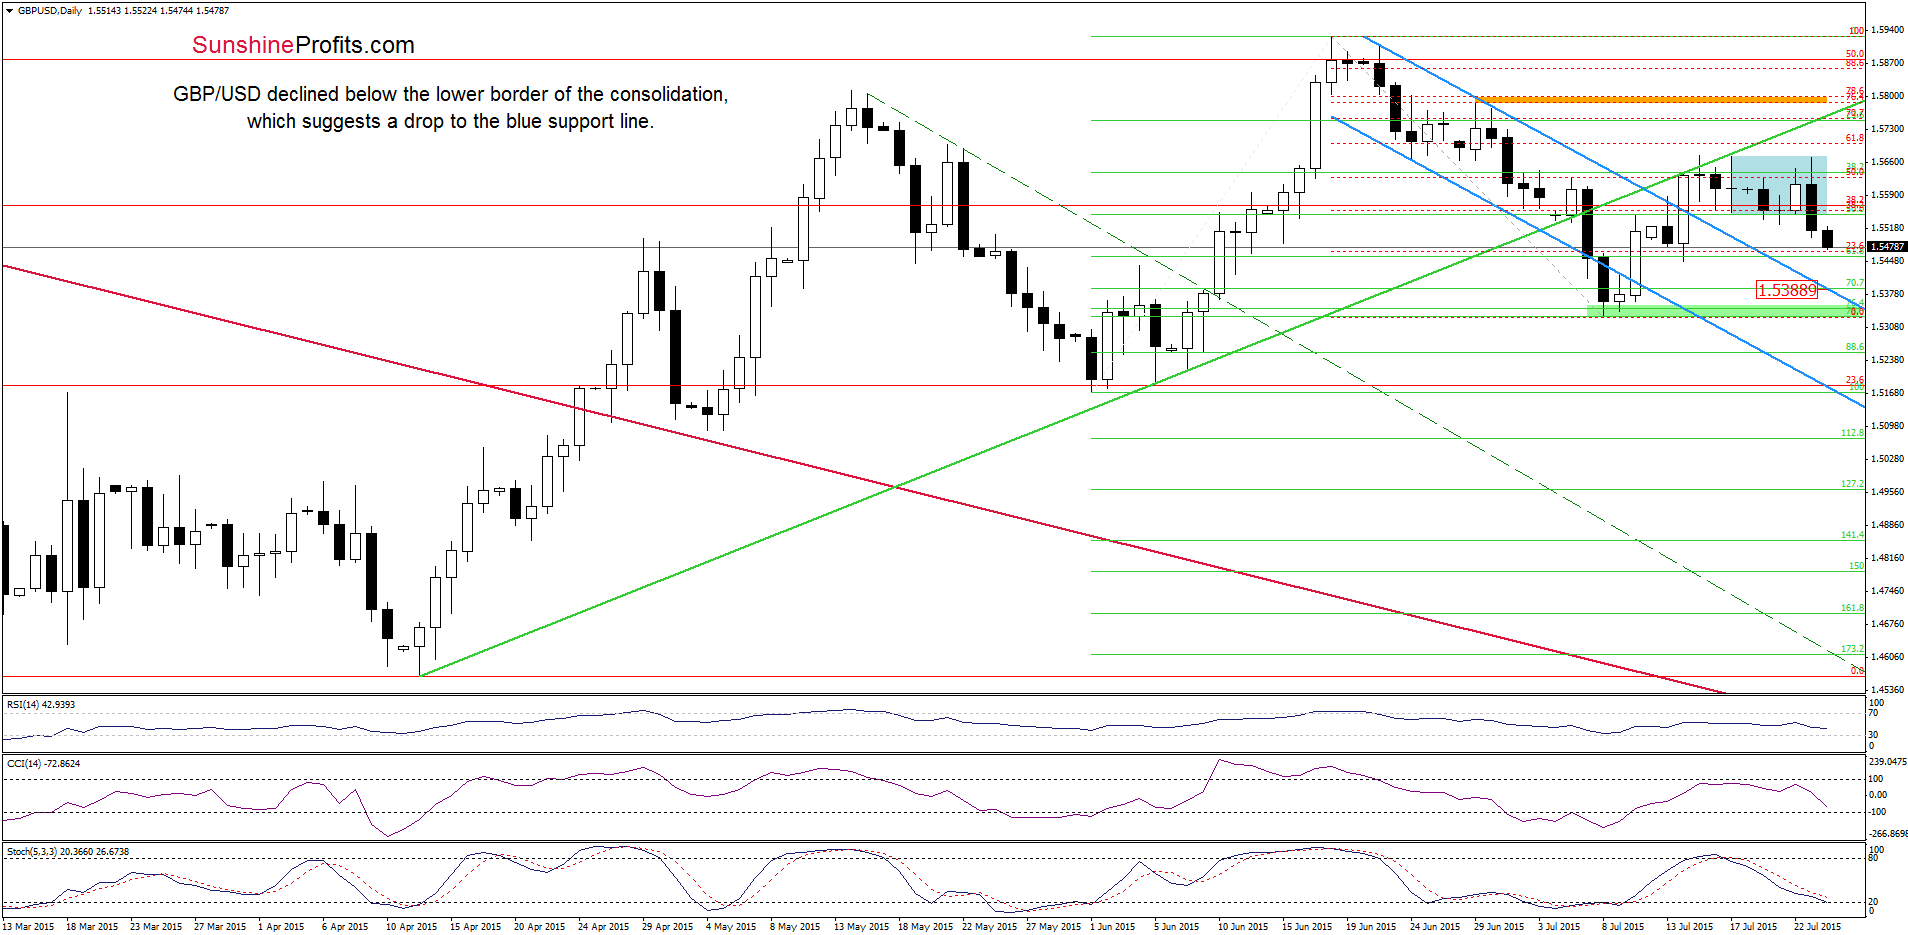
Looking at the daily chart, we see that GBP/USD moved sharply lower and dropped below the lower border of the blue consolidation, which means that we’ll likely see a decline to the previously-broken upper border of the declining blue trend channel (currently around 1.5389), which currently intersects the 70.7% Fibonacci retracement level. Nevertheless, please keep in mind that before we see GBP/USD at this downside target, currency bulls will have to break under the long-term green support line marked on the weekly chart (currently at 1.5402).
Very short-term outlook: bearish
Short-term outlook: mixed with bearish bias
MT outlook: mixed
LT outlook: mixed
Trading position (short-term; our opinion): No positions are justified from the risk/reward perspective at the moment. We will keep you informed should anything change, or should we see a confirmation/invalidation of the above.
USD/JPY
The situation in the medium term hasn’t changed much as USD/JPY is trading slightly below the June 2007 high. Today, we’ll focus on the very short-term picture.
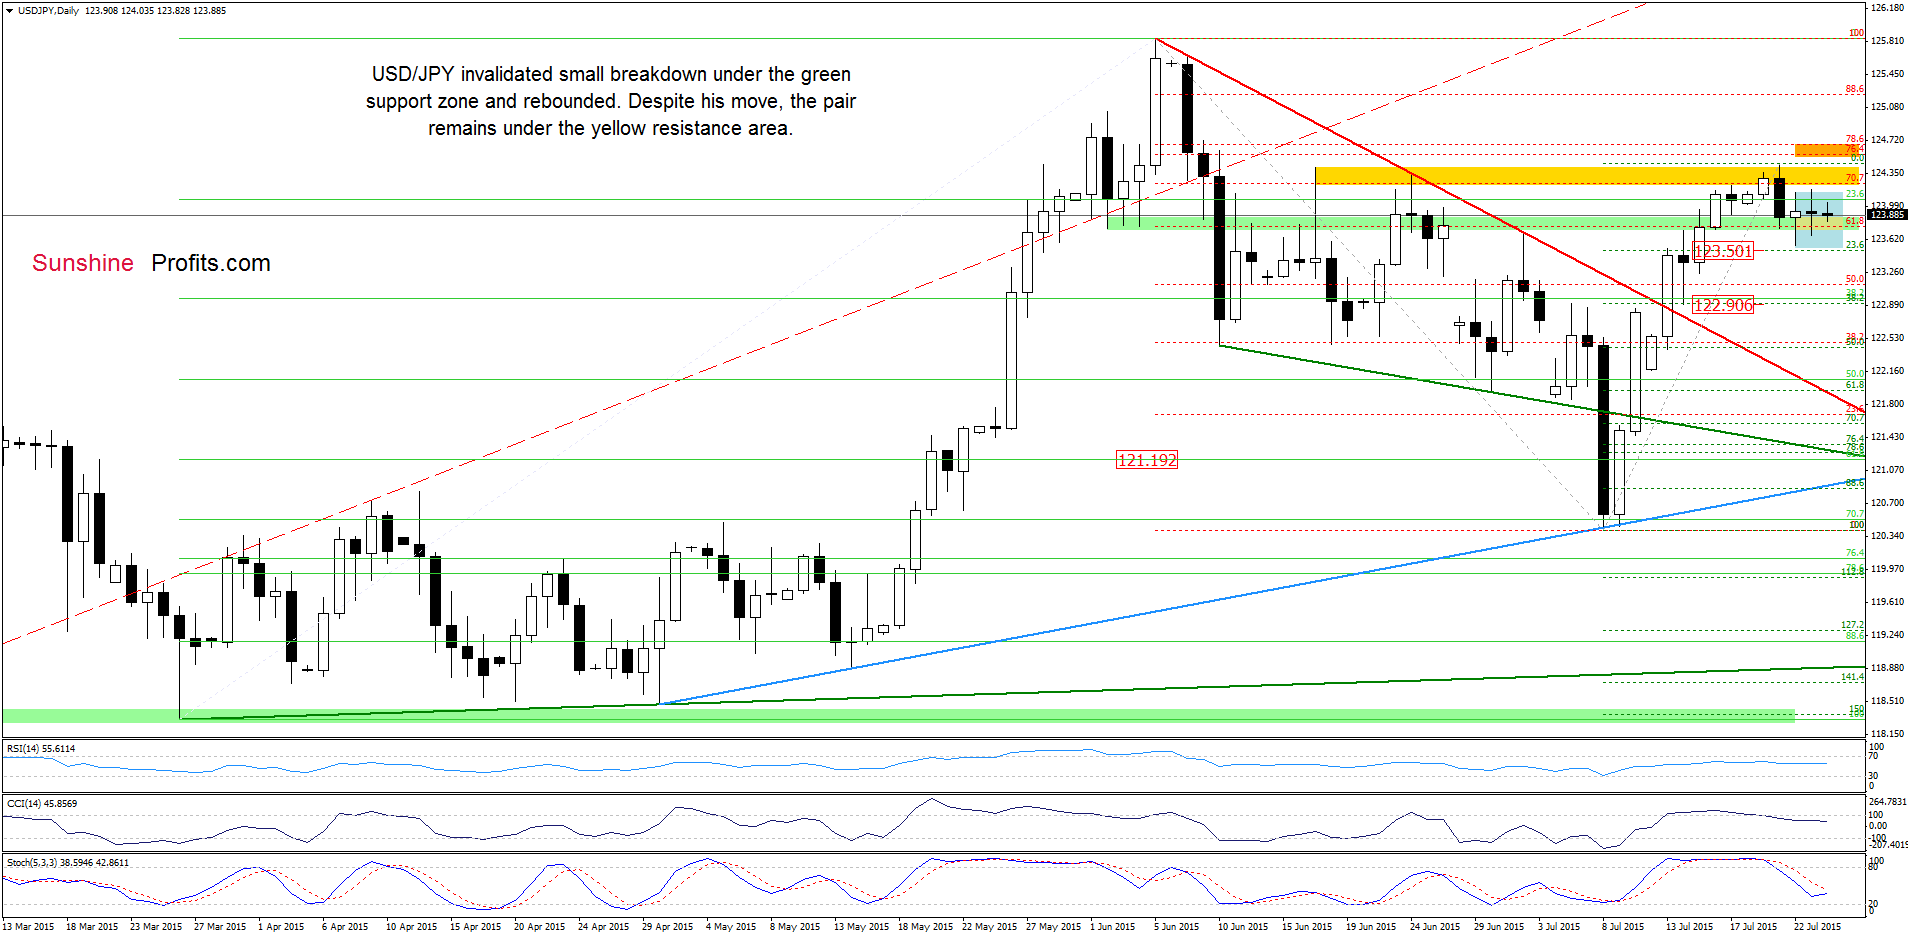
From today’s point of view, we see that the proximity to the 23.6% Fibonacci retracement encouraged currency bulls to act, which resulted in an invalidation of the breakdown under the green support zone. This is a positive signal, which suggests further improvement. Nevertheless, in our opinion, such price action will be likely only if we see a breakout above yellow and orange resistance zones. Until this time, short-lived moves in both directions should not surprise us.
Very short-term outlook: mixed
Short-term outlook: mixed
MT outlook: mixed
LT outlook: bullish
Trading position (short-term; our opinion): No positions are justified from the risk/reward perspective at the moment. We will keep you informed should anything change, or should we see a confirmation/invalidation of the above.
USD/CAD
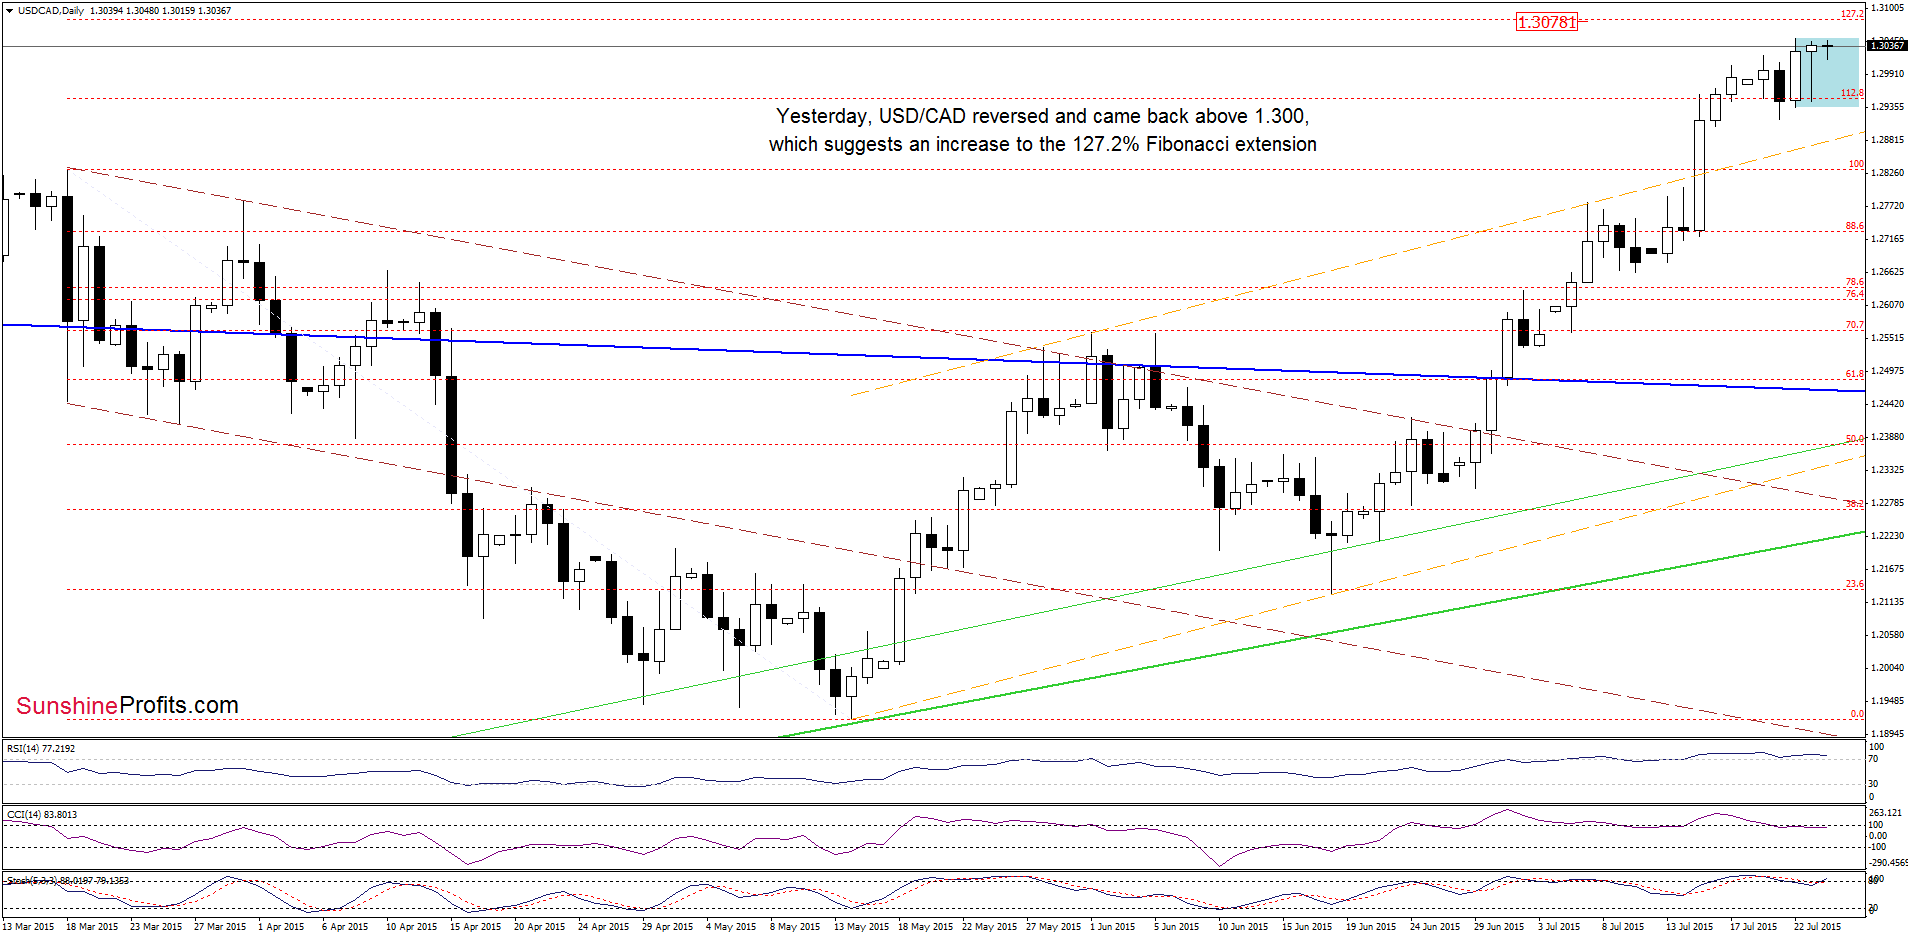
Yesterday, USD/CAD reversed and came back above the psychological barrier of 1,300, which suggests further improvement and an increase to around 1.3078, where the 127.2% Fibonacci extension is. But will we see such price action? Looking at the current position of the indicators, we see that the RSI remains above the level of 70, while the CCI generated a sell signal, which suggests that we may see a reversal and lower values of USD/CAD in the coming week.
Are there any other factors that could encourage currency bears to act? Let’s examine the weekly chart and find out.

From this perspective, we see that although USD/CAD remains above the previously-broken long-term red declining resistance line, the pair is trading under the Mar 2009 high, which serves as the nearest medium-term resistance. Therefore, we think that as long as the exchange rate remains below it further rally is questionable. Additionally, there are negative divergences between the RSI, CCI and USD/CAD (while the Stochastic Oscillator is overbought), which increases the probability of reversal in the coming week.
Very short-term outlook: mixed
Short-term outlook: mixed with bearish bias
MT outlook: mixed with bearish bias
LT outlook: mixed
Trading position (short-term; our opinion): No positions are justified from the risk/reward perspective at the moment. We will keep you informed should anything change, or should we see a confirmation/invalidation of the above.
USD/CHF
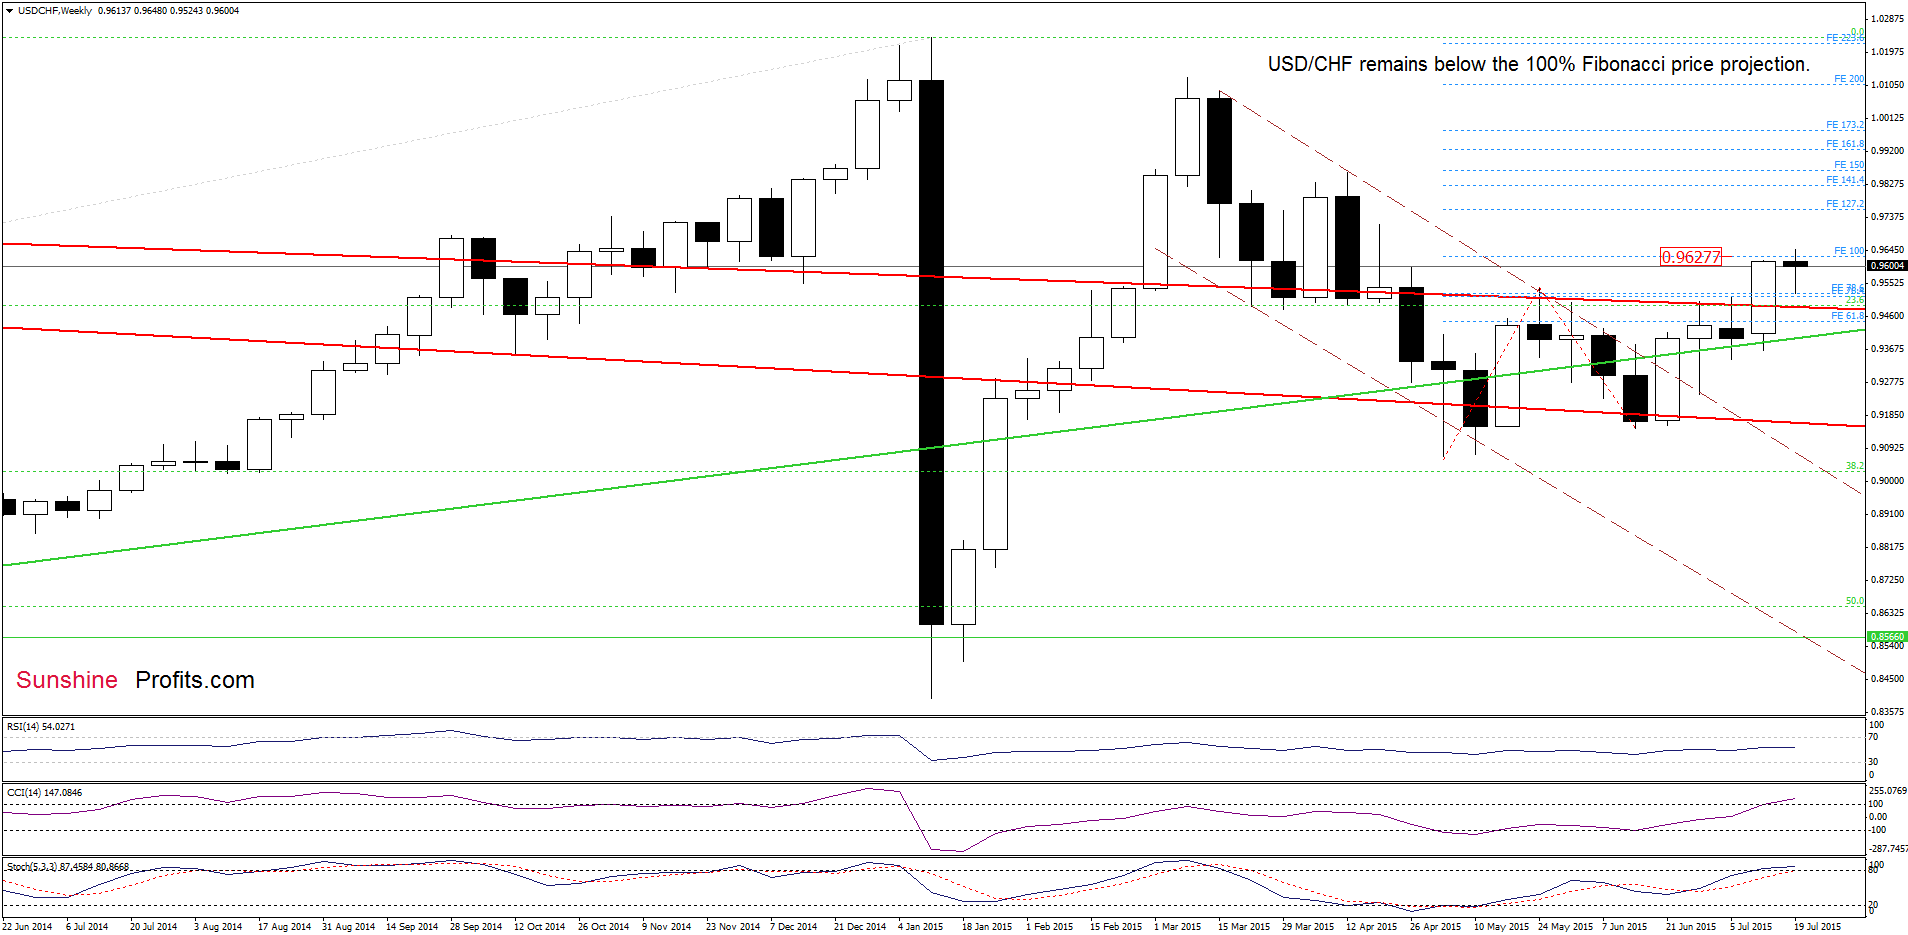
The situation in the medium term has deteriorated slightly as USD/CHF slipped under the 100% Fibonacci price projection (marked with blue). Nevertheless, the recent pullback as quite shallow – this suggests that we may see another attempt to move higher in the coming week.
Will the very short-term picture confirm this pro-growth scenario? Let’s examine the daily chart and find out.
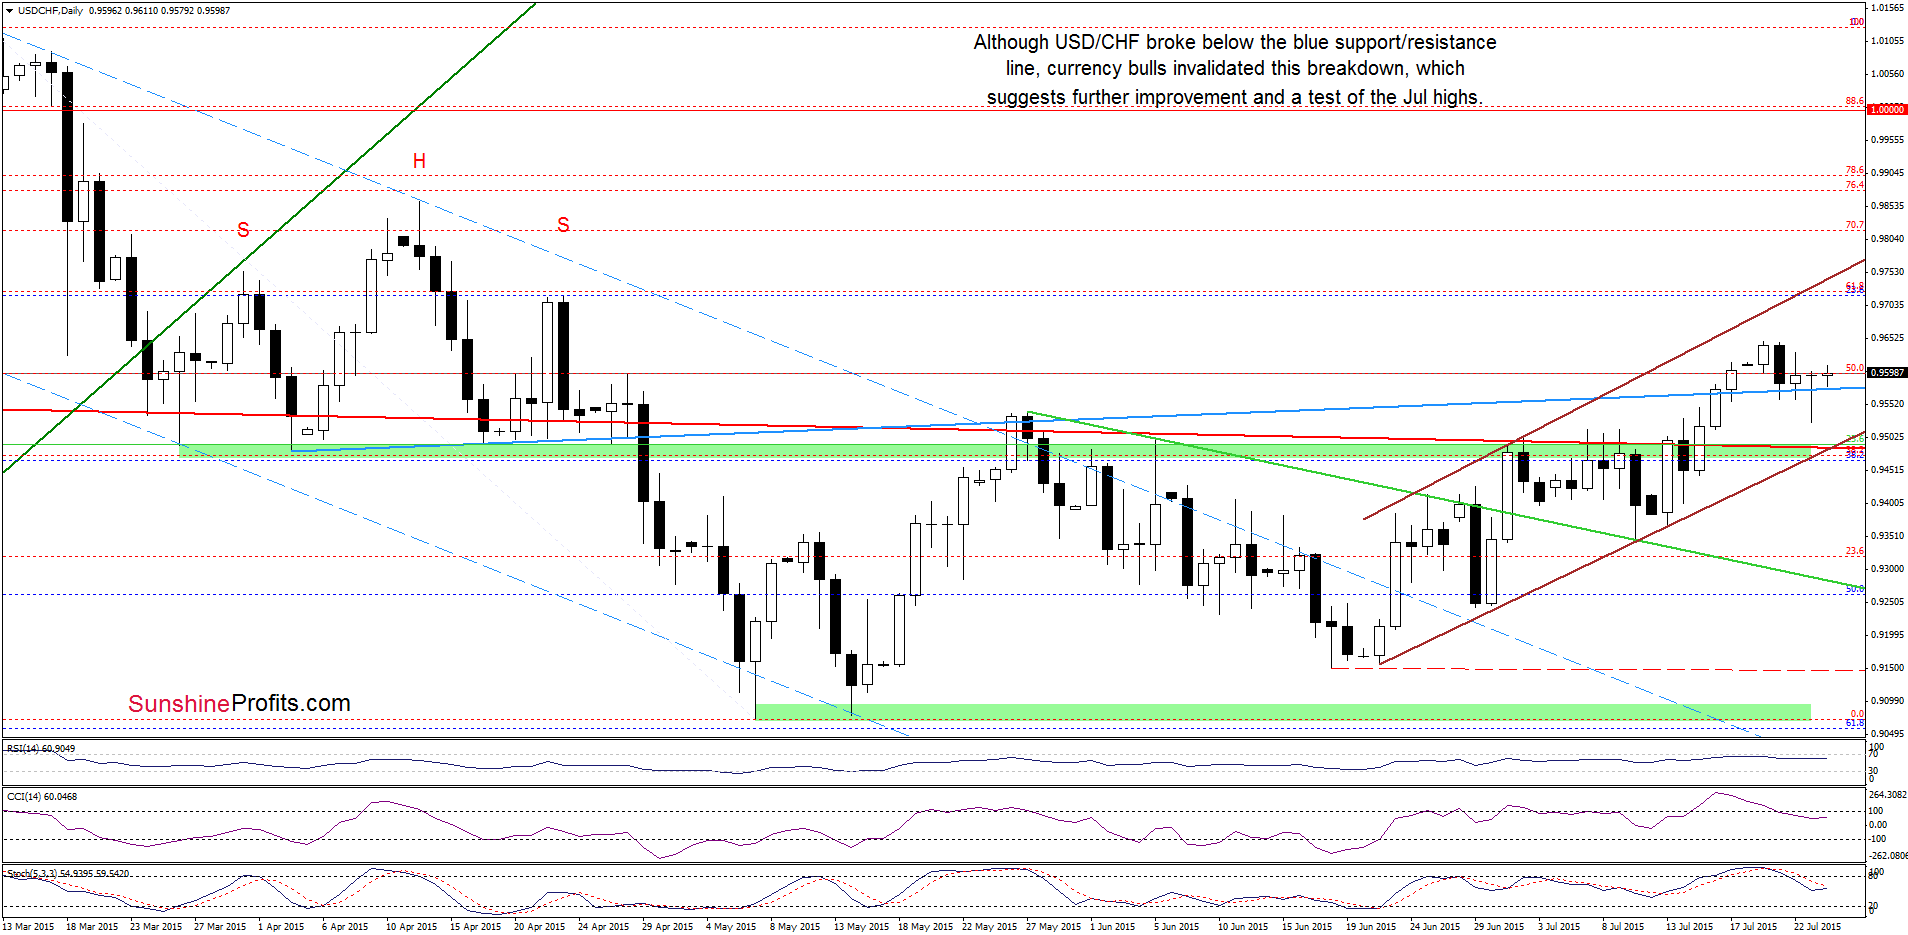
On the above chart, we see that currency bulls managed to stop their opponents and the pair rebounded, invalidating small breakdown under the blue line. Additionally, USD/CHF closed the day above this line, which is a positive signal that suggests further improvement. If this is the case, and the pair moves higher from here, we’ll likely see a test of the Jul highs in the coming days.
Very short-term outlook: mixed with bullish bias
Short-term outlook: mixed
MT outlook: mixed
LT outlook: mixed
Trading position (short-term; our opinion): No positions are justified from the risk/reward perspective at the moment. We will keep you informed should anything change, or should we see a confirmation/invalidation of the above.
AUD/USD
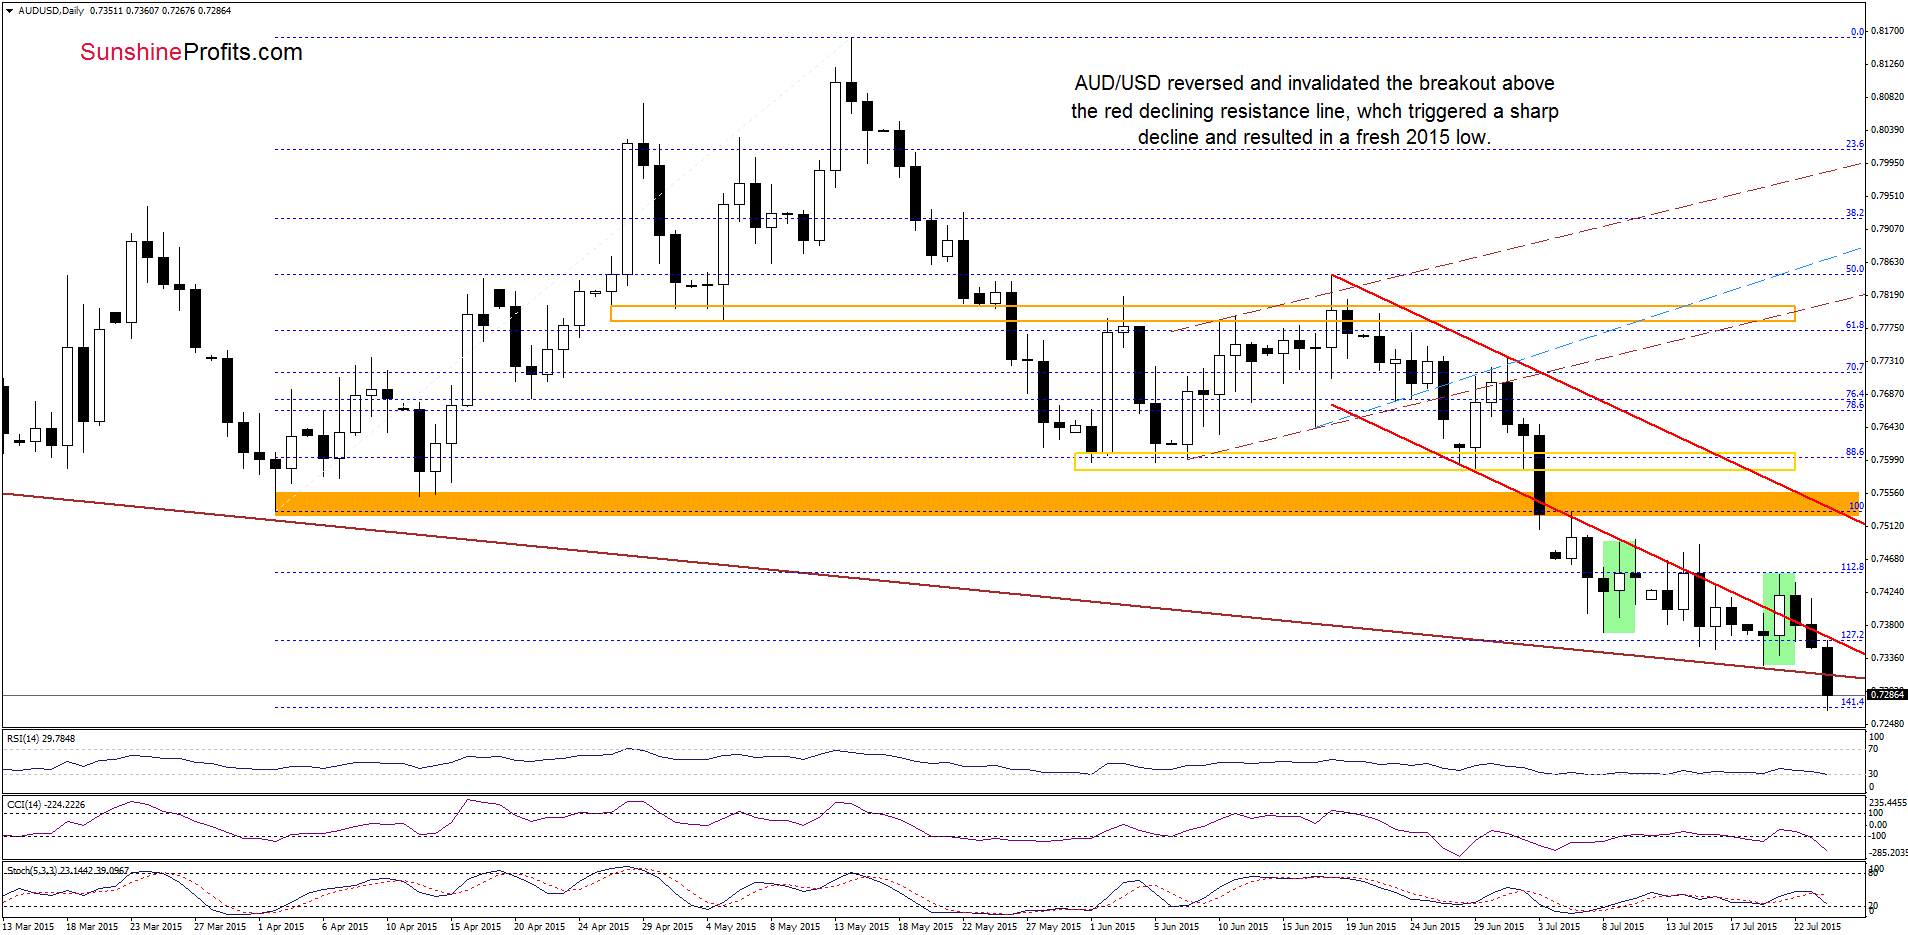
On Wednesday, we wrote the following:
The first thing that catches the eye on the daily chart is an invalidation of the breakdown below the red declining resistance line. But is this event as bullish as it seems at the first sight? No really, because when we take a closer look at the daily chart, we’ll notice that the current upswing is similar to the previous one (both marked with green), which doesn’t confirm currency bulls’ strength at the moment. Therefore, in our opinion, further improvement will be more reliable if we see an increase above the Jul 10 high of 0.7494. Until this time, another test of the red declining line should not surprise us.
As it turned out currency bulls didn’t manage to hold gained levels, which resulted in a reversal and a comeback below the red declining resistance line. This negative signal triggered further deterioration and AUD/USD broke below the medium-term brown support line earlier today. What’s next? We think that the best answer to this question will be the quote from our Forex Trading Alertt posted a week ago:
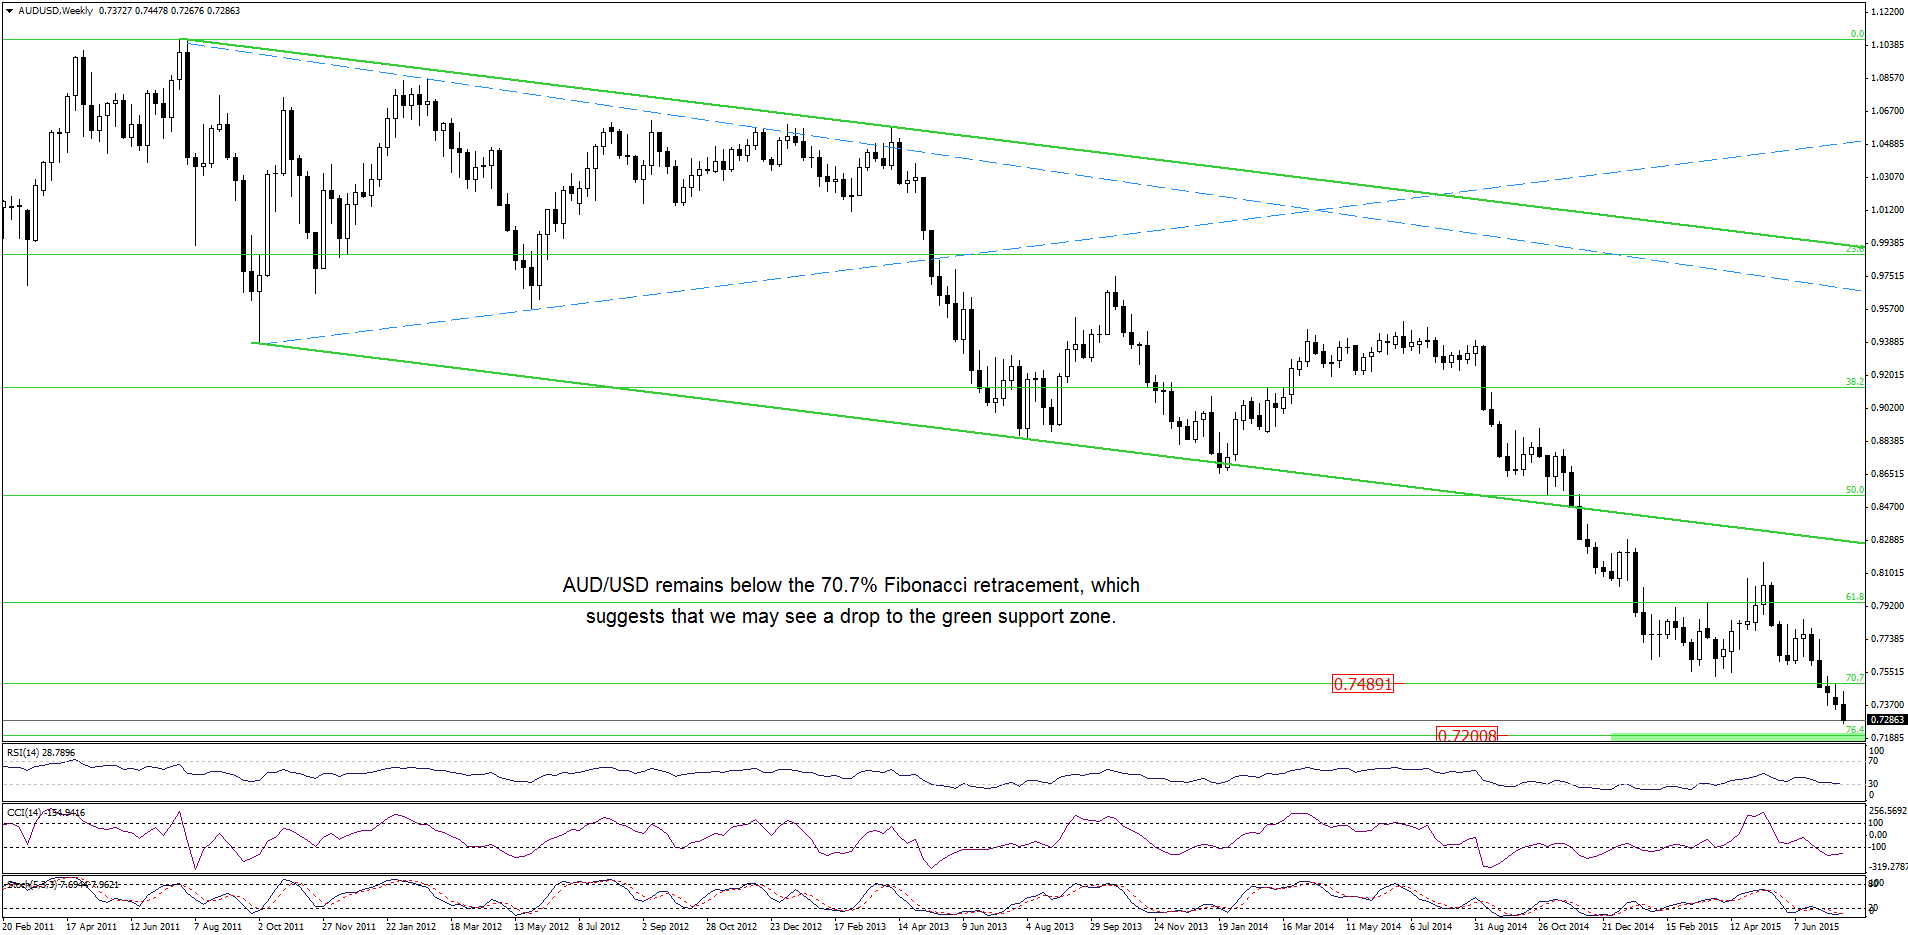
(…) if currency bears manage to push the exchange rate lower, we may see a decline even to (around 0.7097-0.7200, where the green support zone based on the 76.4% and 78.6% Fibonacci retracement levels (marked on the weekly chart) is.
Very short-term outlook: bearish
Short-term outlook: mixed with bearish bias
MT outlook: mixed
LT outlook: mixed
Trading position (short-term; our opinion): No positions are justified from the risk/reward perspective at the moment. We will keep you informed should anything change, or should we see a confirmation/invalidation of the above.
Thank you.
Nadia Simmons
Forex & Oil Trading Strategist
Przemyslaw Radomski, CFA
Founder, Editor-in-chief
Gold & Silver Trading Alerts
Forex Trading Alerts
Oil Investment Updates
Oil Trading Alerts

