

Yesterday’s sharp decline in the USD Index pushed AUD/USD higher and resulted in an invalidation of the breakdown below important resistance line. Earlier today, official data showed that Australia's consumer price index increased by 0.7% quarter-on-quarter, which gave the exchange rate an additional support. But is this rally as bullish as it seems at the first sight?
In our opinion the following forex trading positions are justified - summary:
- EUR/USD: short (stop-loss order at 1.1058)
- GBP/USD: none
- USD/JPY: none
- USD/CAD: none
- USD/CHF: none
- AUD/USD: none
EUR/USD
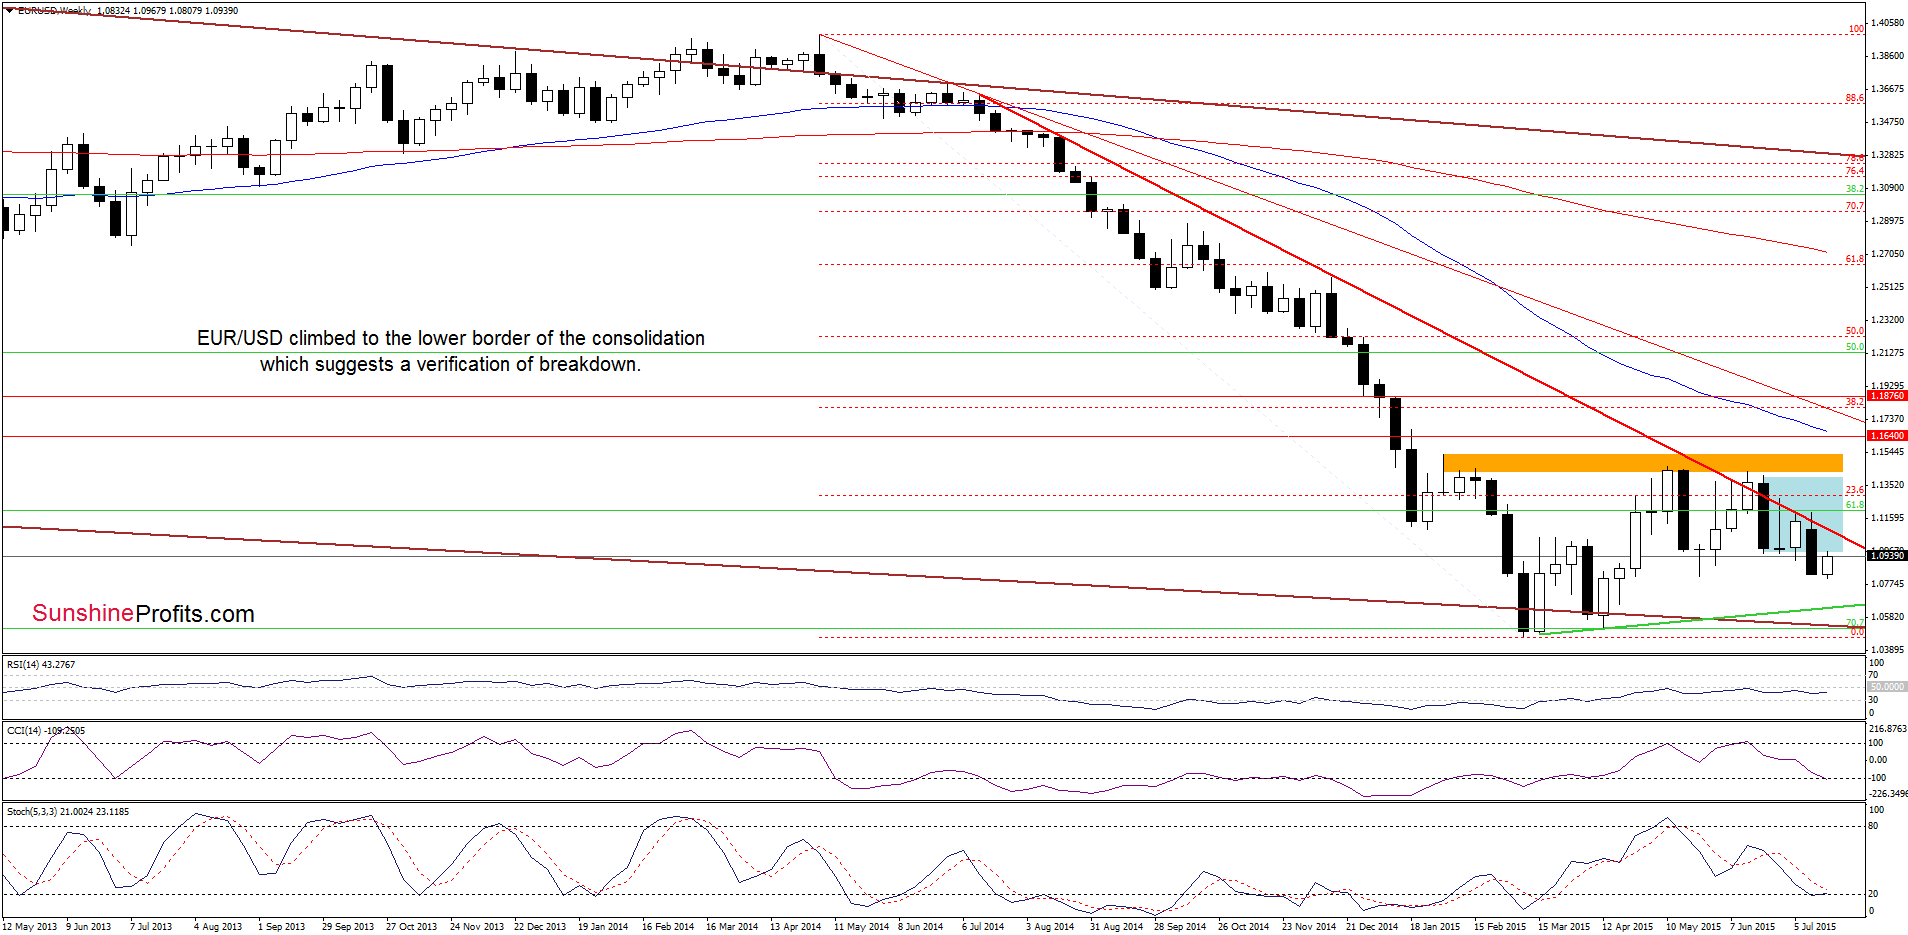
As you see on the weekly chart, EUR/USD reversed and climbed to the previously-broken lower border of the blue consolidation, which suggests that the current upswing may be just a verification of earlier breakdown.
Will the daily chart give us more clues? Let’s find out.
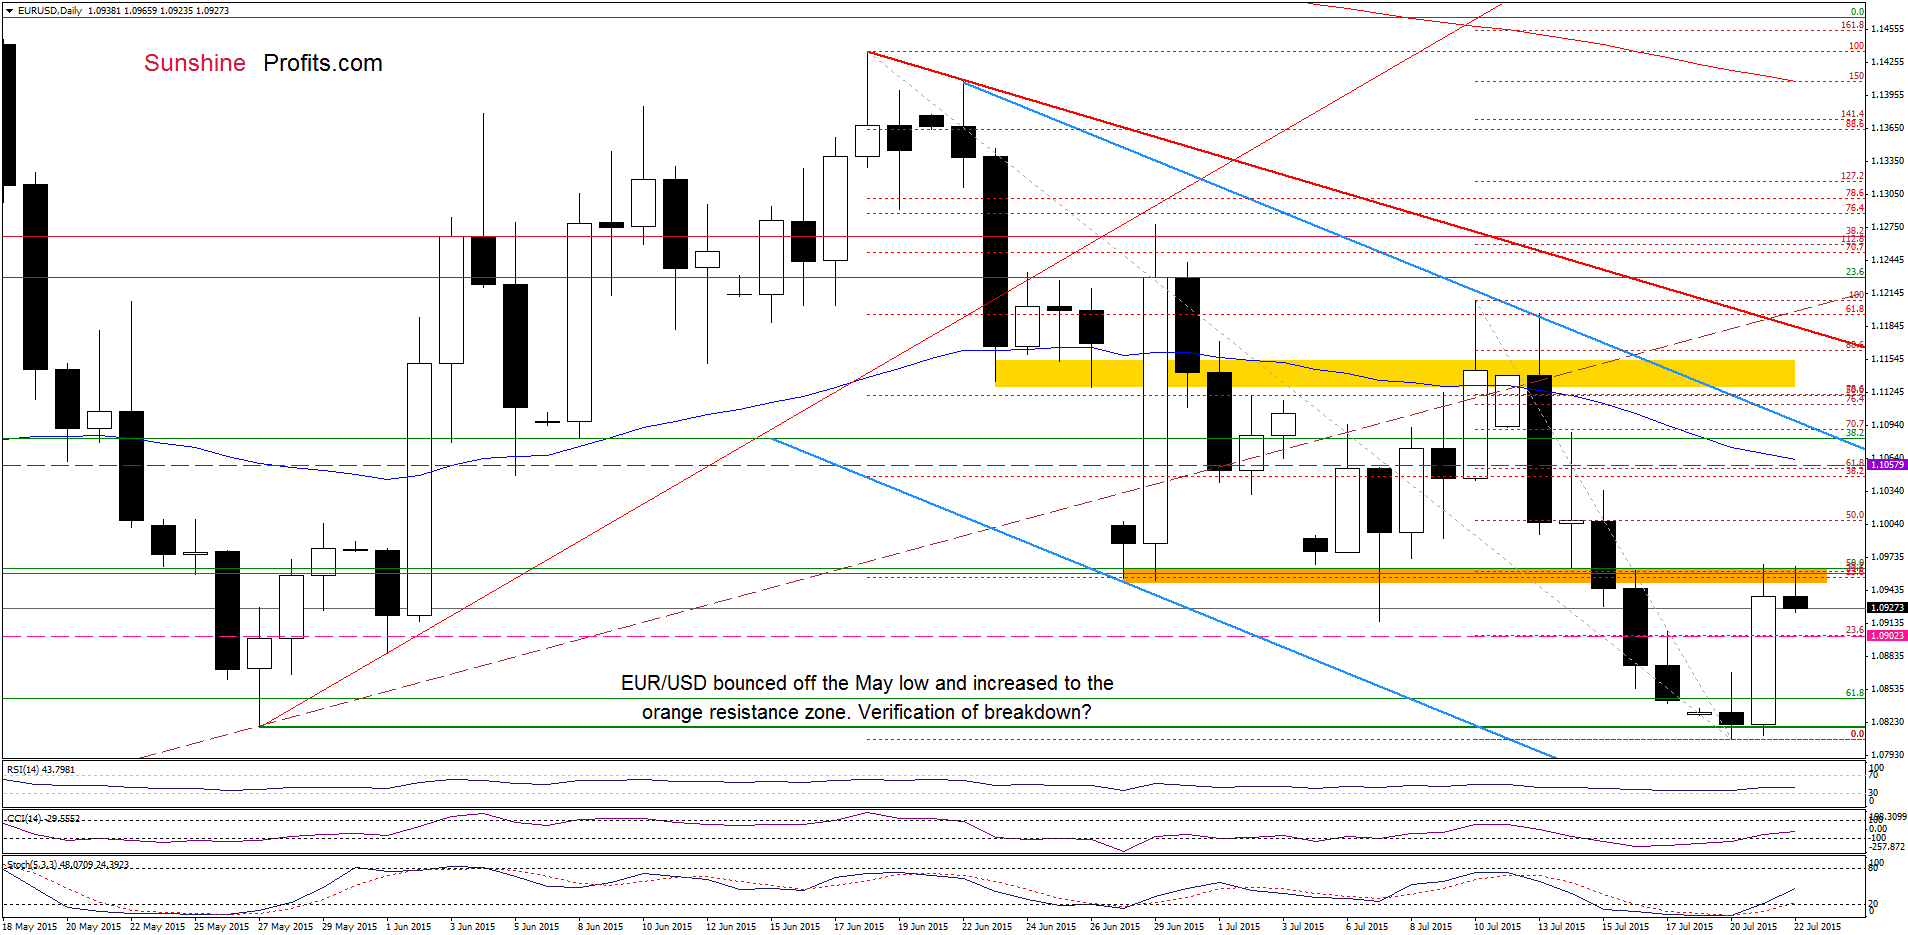
From this perspective, we see that EUR/USD bounced off the May low and invalidated the breakdown under the 61.8% Fibonacci retracement. This positive signal encouraged currency bulls to act, which resulted in a rally to the previously-broken orange resistance zone. Although the current position of the indicators suggests that currency bulls will likely try to push the pair higher, we should keep in mind that the orange area is reinforced by the 23.6% and 38.2% Fibonacci retracement levels (based on the entire Jun-Jul decline and the recent downward move started on Jul 10), which could trigger a pullback in the coming day(s). If we see such price action, and the exchange rate moves lower from here, it would mean that yesterday’s upswing was nothing more than a verification of the breakdown below the orange zone. In this case, EUR/USD will decline once again and we’ll see another test of the May low. At this point, it s also worth noting that yesterday’s move is much smaller than previous upward moves, which suggests lower values of the exchange rate. Nevertheless, if the pair closes the day above the resistance area, we’ll consider closing short positions because such improvement may translate to further rally and our stop loss order could be threatened.
Very short-term outlook: bearish
Short-term outlook: mixed with bearish bias
MT outlook: mixed
LT outlook: mixed
Trading position (short-term; our opinion): Short positions with a stop-loss order at 1.1058 are justified from the risk/reward perspective at the moment. We will keep you informed should anything change, or should we see a confirmation/invalidation of the above.
USD/JPY
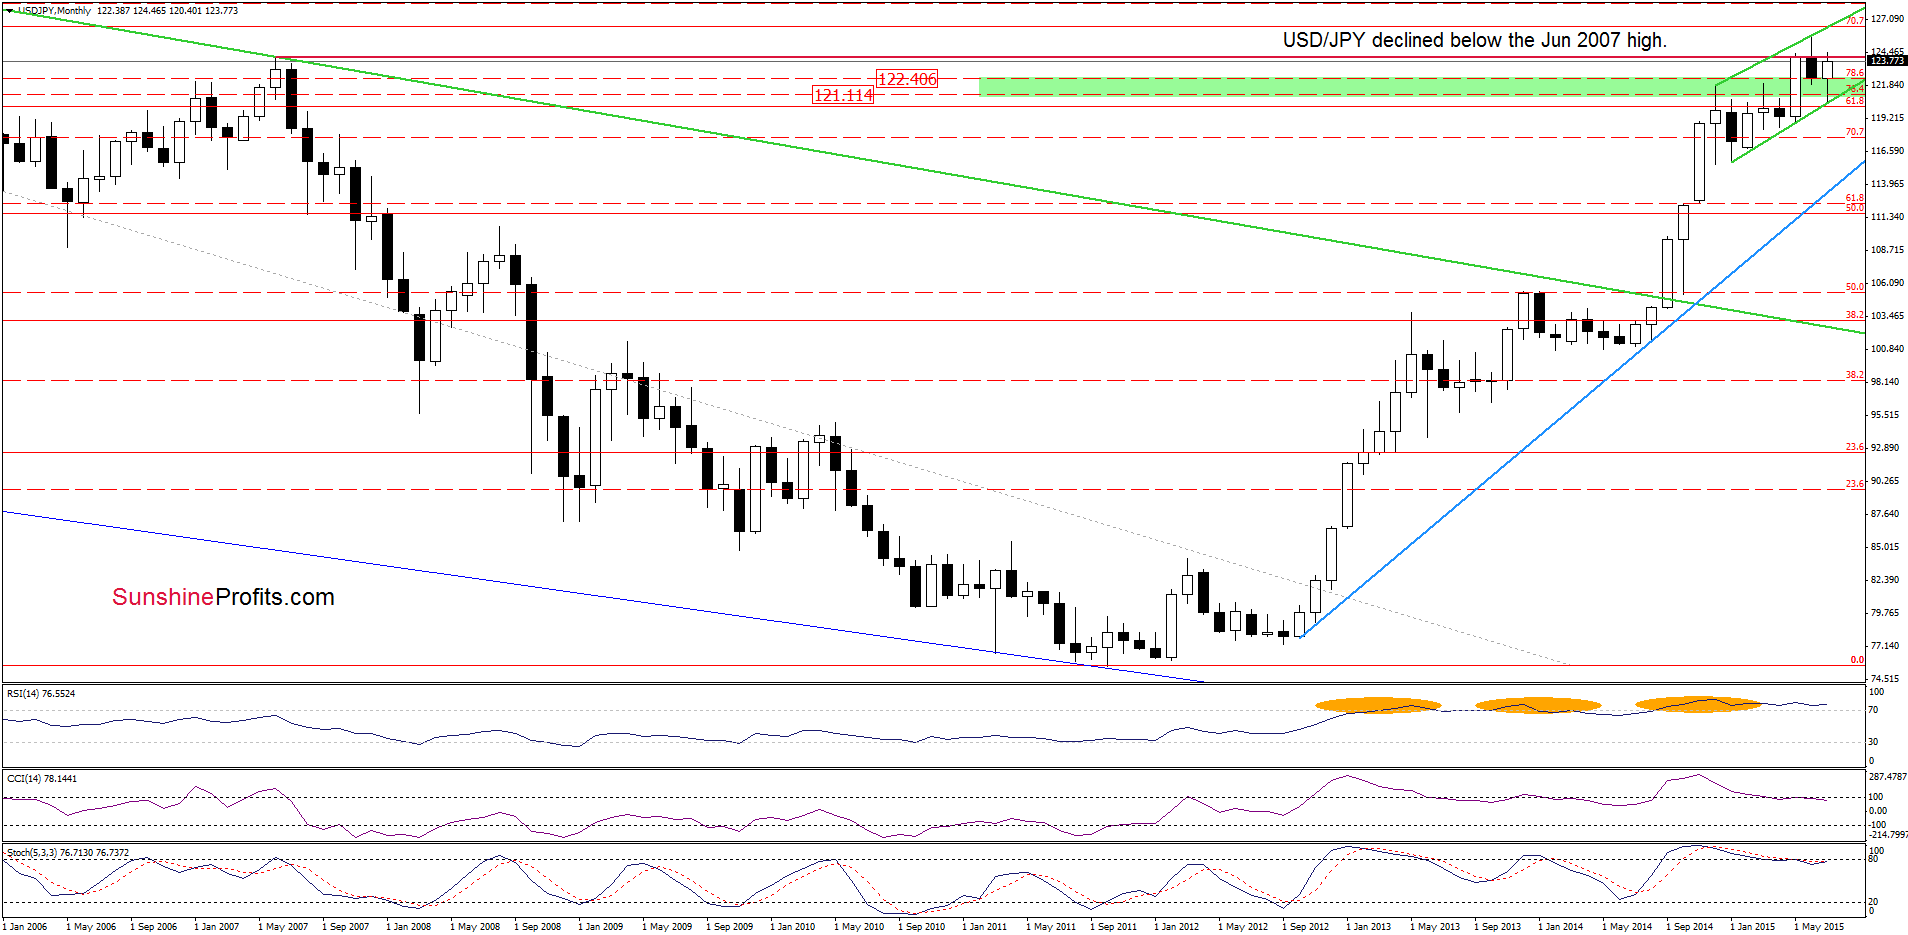
Looking at the above chart, we see that USD/JPY moved lower and dropped below the June 2007 high, invalidating earlier small breakout (a bearish signal). What impact did this decline have on the very short-term picture? Let’s check.
Quoting our Friday’s alert:
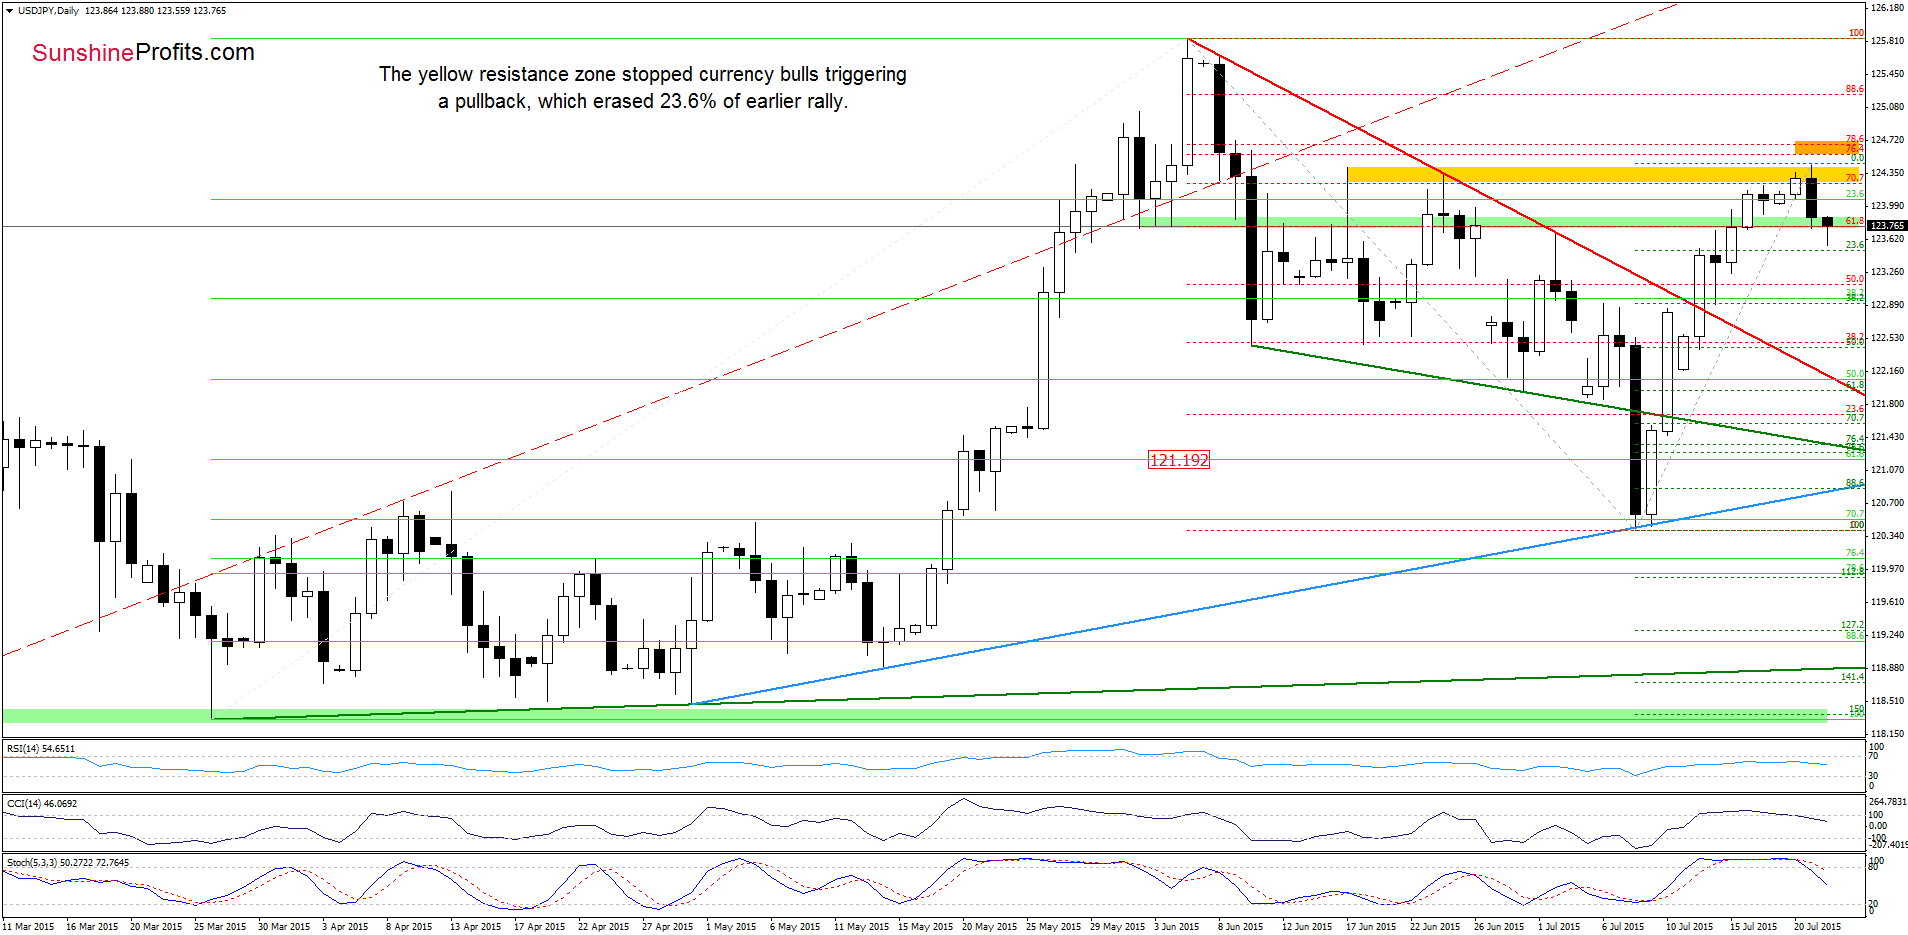
(…) USD/JPY remains under the yellow resistance area (based on the Jun 17and Jun 24 high) reinforced by the 70.7% Fibonacci retracement. Even if currency bulls manage to push the pair above it, we should keep in mind that slightly above this area are also the 76.4% and 78.6% Fibonacci retracement levels, which together could stop further rally. Taking this fact into account, and combining it with the medium-term resistance level (the Jun 2007 high of 124.13) and the position of daily indicators (the CCI and Stochastic Oscillator are overbought and close to generating sell signals), it seems that reversal is just around the corner.
From today’s point of view, we see that currency bears pushed the exchange rate lower as we had expected. With this downswing, USD/JPY erased almost 23.6% of earlier rally and declined below the green support zone. This is a negative signal, which in combination with sell signals generated by the indicators suggests further deterioration. If this is the case, and the pair closes the day under the 23.6% Fibonacci retracement (at 123.50), we may see a decline to around 122.90, where the 38.2% Fibonacci retracement and the Jul 14 low are.
Very short-term outlook: mixed with bearish bias
Short-term outlook: mixed
MT outlook: mixed
LT outlook: bullish
Trading position (short-term; our opinion): No positions are justified from the risk/reward perspective at the moment. We will keep you informed should anything change, or should we see a confirmation/invalidation of the above.
AUD/USD
The situation in the medium term hasn’t changed much as AUD/USD remains under the previously-broken 70.7% Fibonacci retracement. Today, we’ll focus on the very short-term changes.
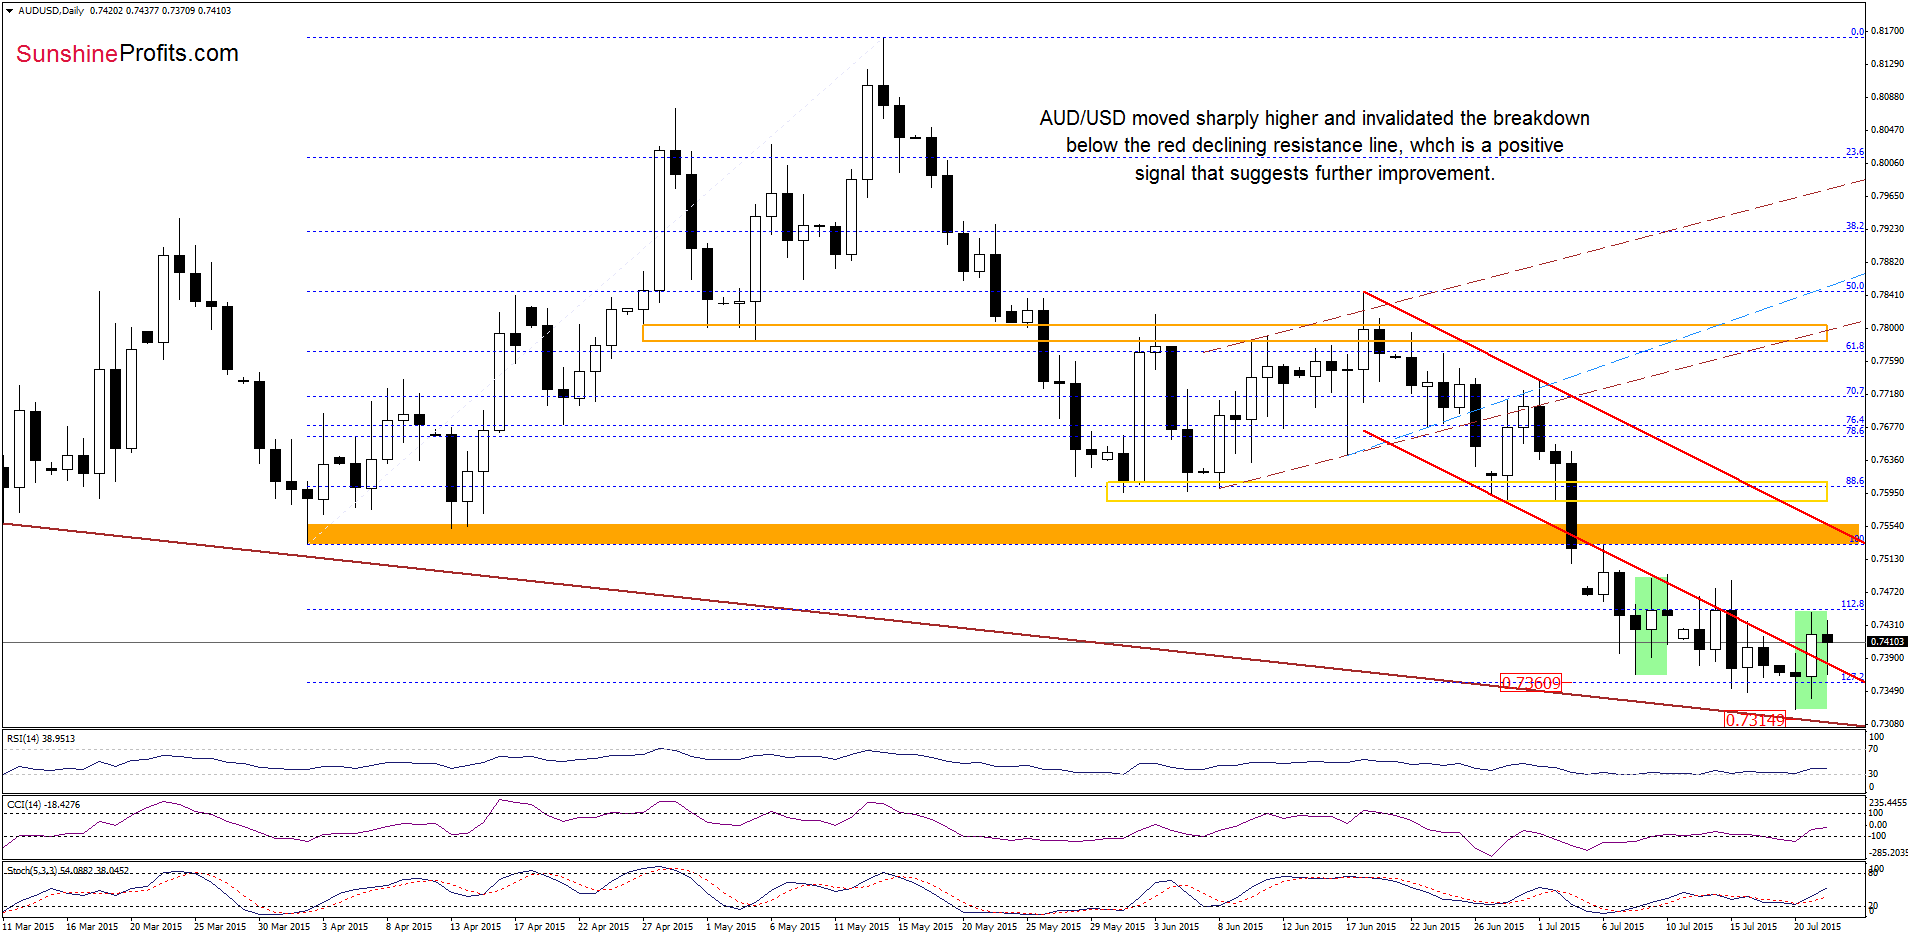
The first thing that catches the eye on the daily chart is an invalidation of the breakdown below the red declining resistance line. But is this event as bullish as it seems at the first sight? No really, because when we take a closer look at the daily chart, we’ll notice that the current upswing is similar to the previous one (both marked with green), which doesn’t confirm currency bulls’ strength at the moment. Therefore, in our opinion, further improvement will be more reliable if we see an increase above the Jul 10 high of 0.7494. Until this time, another test of the red declining line should not surprise us.
Very short-term outlook: mixed
Short-term outlook: mixed
MT outlook: mixed
LT outlook: mixed
Trading position (short-term; our opinion): No positions are justified from the risk/reward perspective at the moment. We will keep you informed should anything change, or should we see a confirmation/invalidation of the above.
Thank you.
Nadia Simmons
Forex & Oil Trading Strategist
Przemyslaw Radomski, CFA
Founder, Editor-in-chief
Gold & Silver Trading Alerts
Forex Trading Alerts
Oil Investment Updates
Oil Trading Alerts

