

After three-week shutdown Greek banks were opened, which pushed the common currency higher against the greenback. But did this move change anything in the short-term picture of the EUR/USD pair?
In our opinion the following forex trading positions are justified - summary:
- EUR/USD: short (stop-loss order at 1.1058)
- GBP/USD: none
- USD/JPY: none
- USD/CAD: none
- USD/CHF: none
- AUD/USD: none
EUR/USD
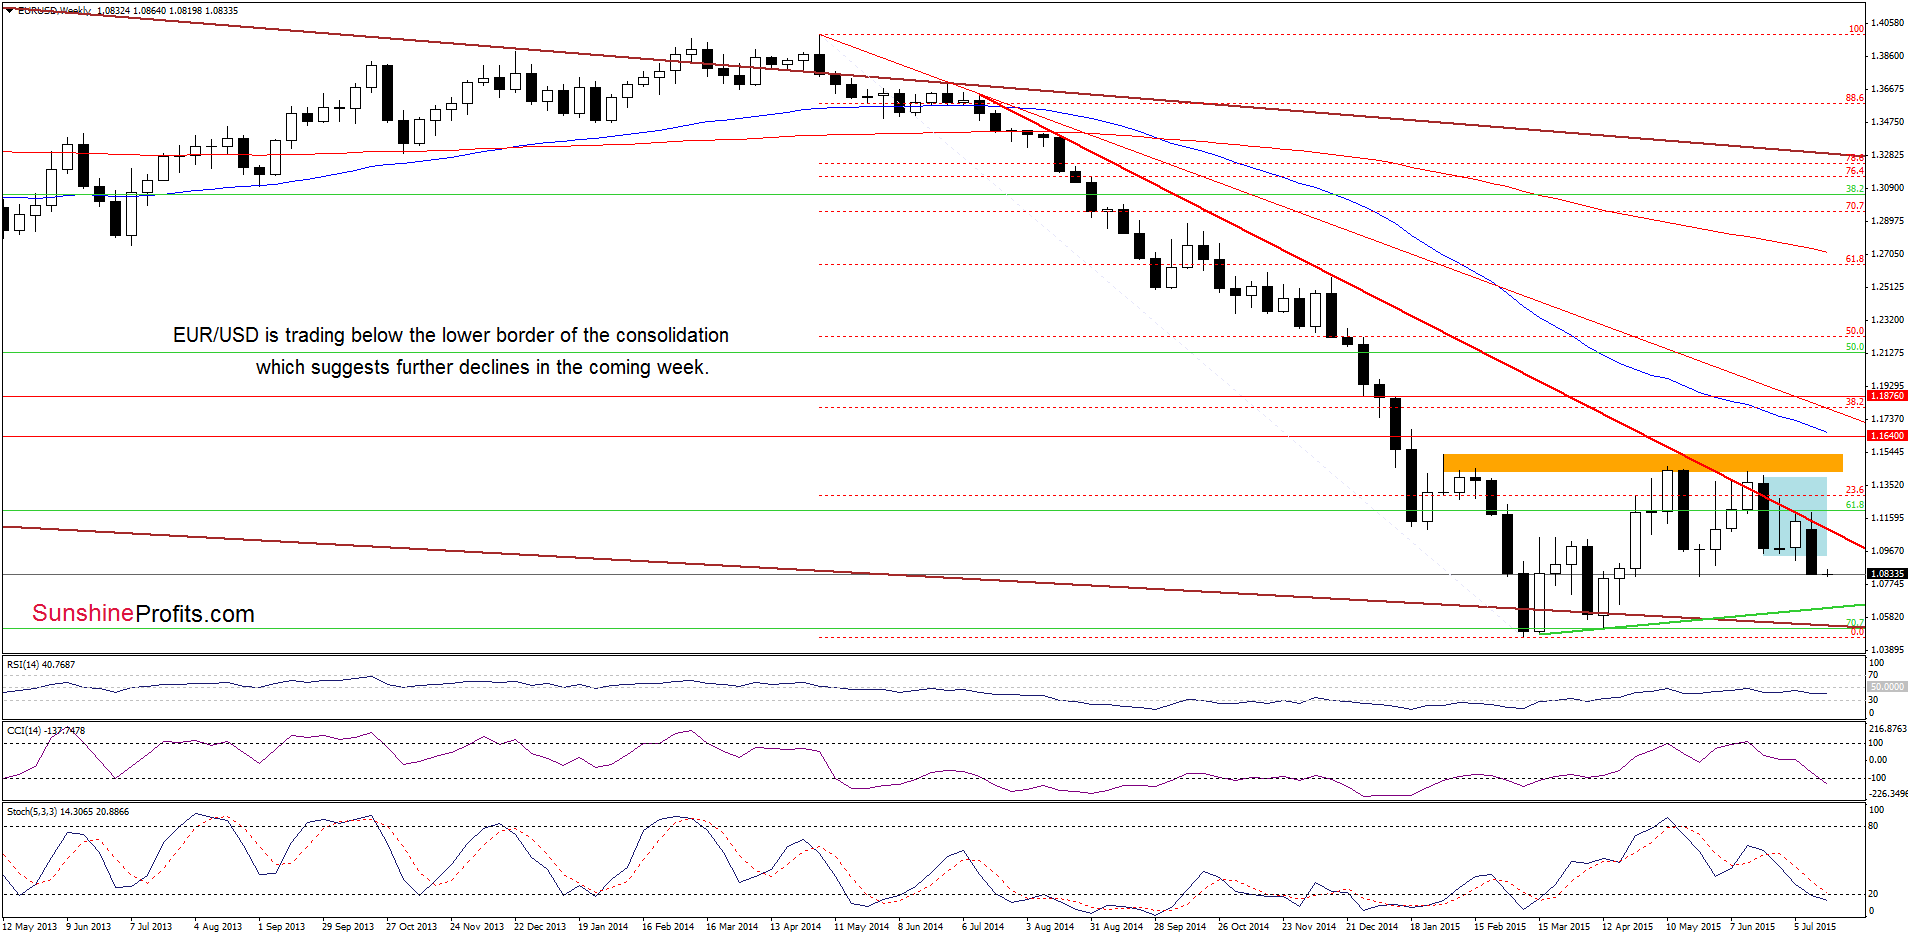
From today’s point of view, we see that the situation in the medium term hasn’t changed much as EUR/USD is trading under the previously-broken lower border of the blue consolidation, which suggests further deterioration.
Having said that, let’s focus on the very short-term changes.
On Friday, we wrote the following:
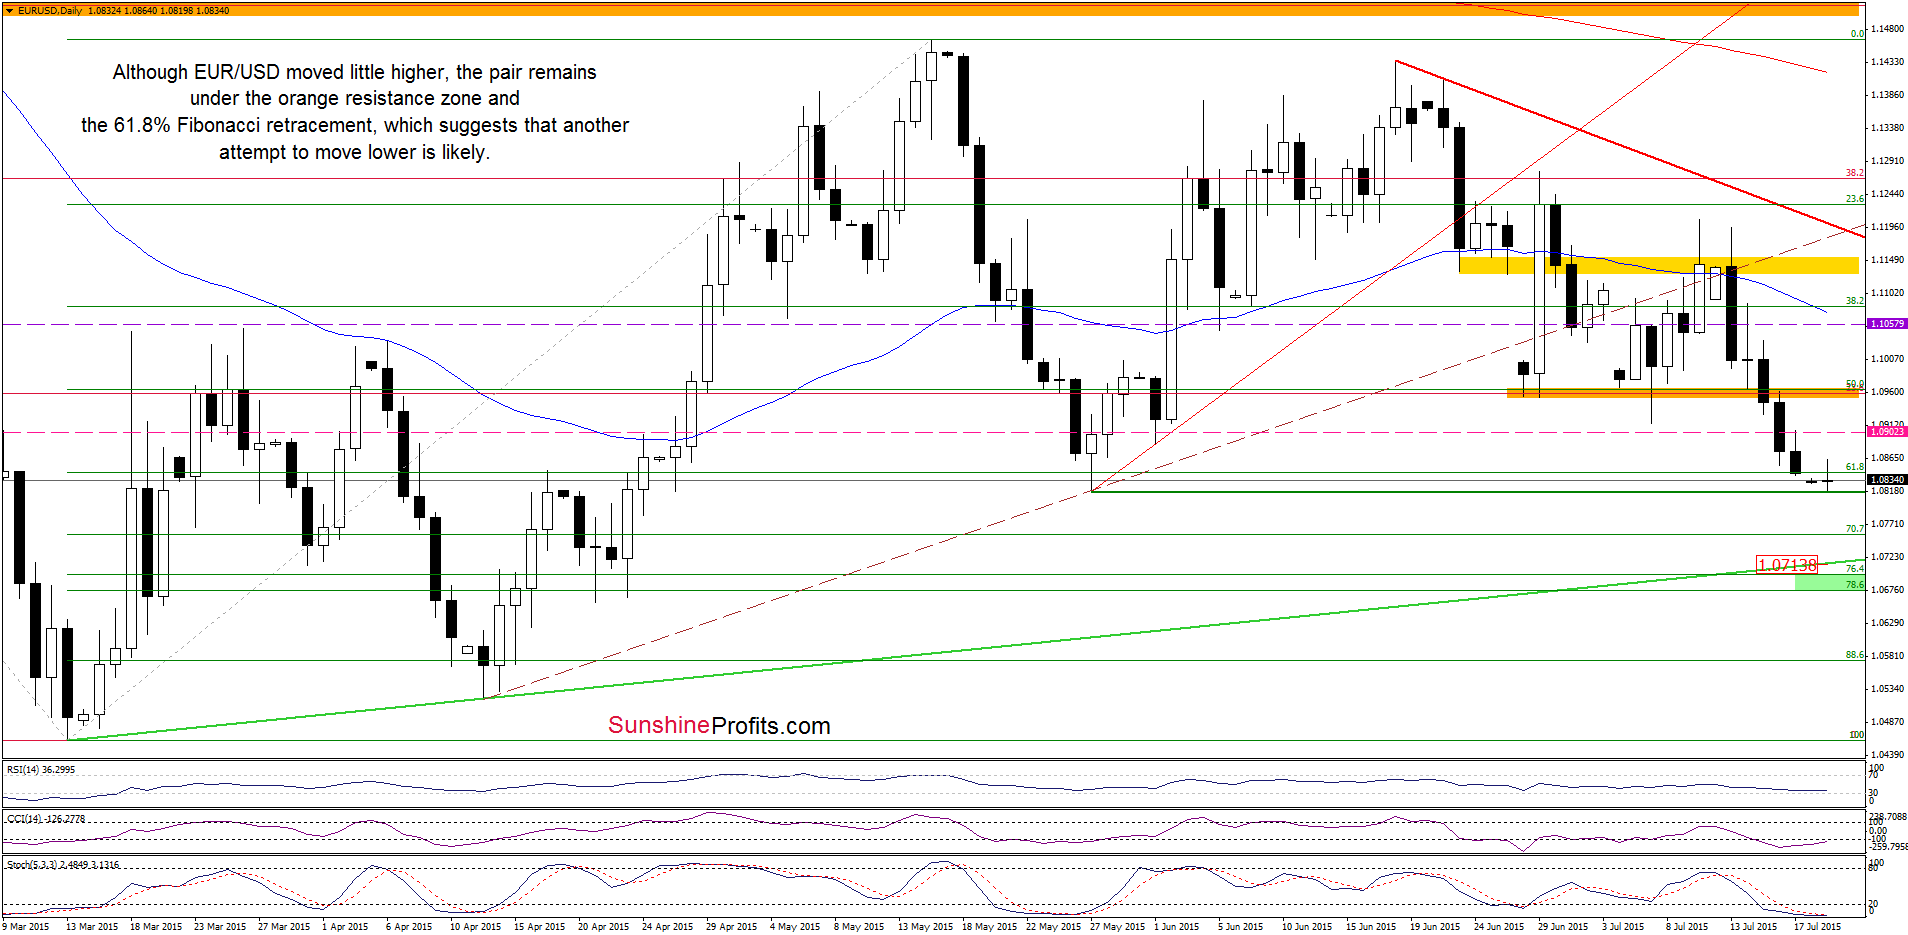
(…) EUR/USD remains under the previous lows (the orange resistance zone), which suggests that we’ll see a test of the May low and the 61.8% Fibonacci retracement.
On the daily chart, we see that the situation developed in line with the above scenario and EUR/USD reached our initial downside target earlier today. Although this support level encouraged currency bulls to act (which resulted in a small rebound), the exchange rate is trading under the orange resistance zone and also below the 61.8% Fibonacci retracement, which suggests that another test of the May low is more likely than not. What’s next? If this support is broken, we may see a decline to the medium-term green support line (currently around 1.0713) or even to 1.0676-1.0698, where the green support zone (created by the 76.4% and 78.6% Fibonacci retracement levels) is.
Very short-term outlook: bearish
Short-term outlook: mixed with bearish bias
MT outlook: mixed
LT outlook: mixed
Trading position (short-term; our opinion): Short positions with a stop-loss order at 1.1058 are justified from the risk/reward perspective at the moment. We will keep you informed should anything change, or should we see a confirmation/invalidation of the above.
GBP/USD
Quoting our last commentary on this currency pair:
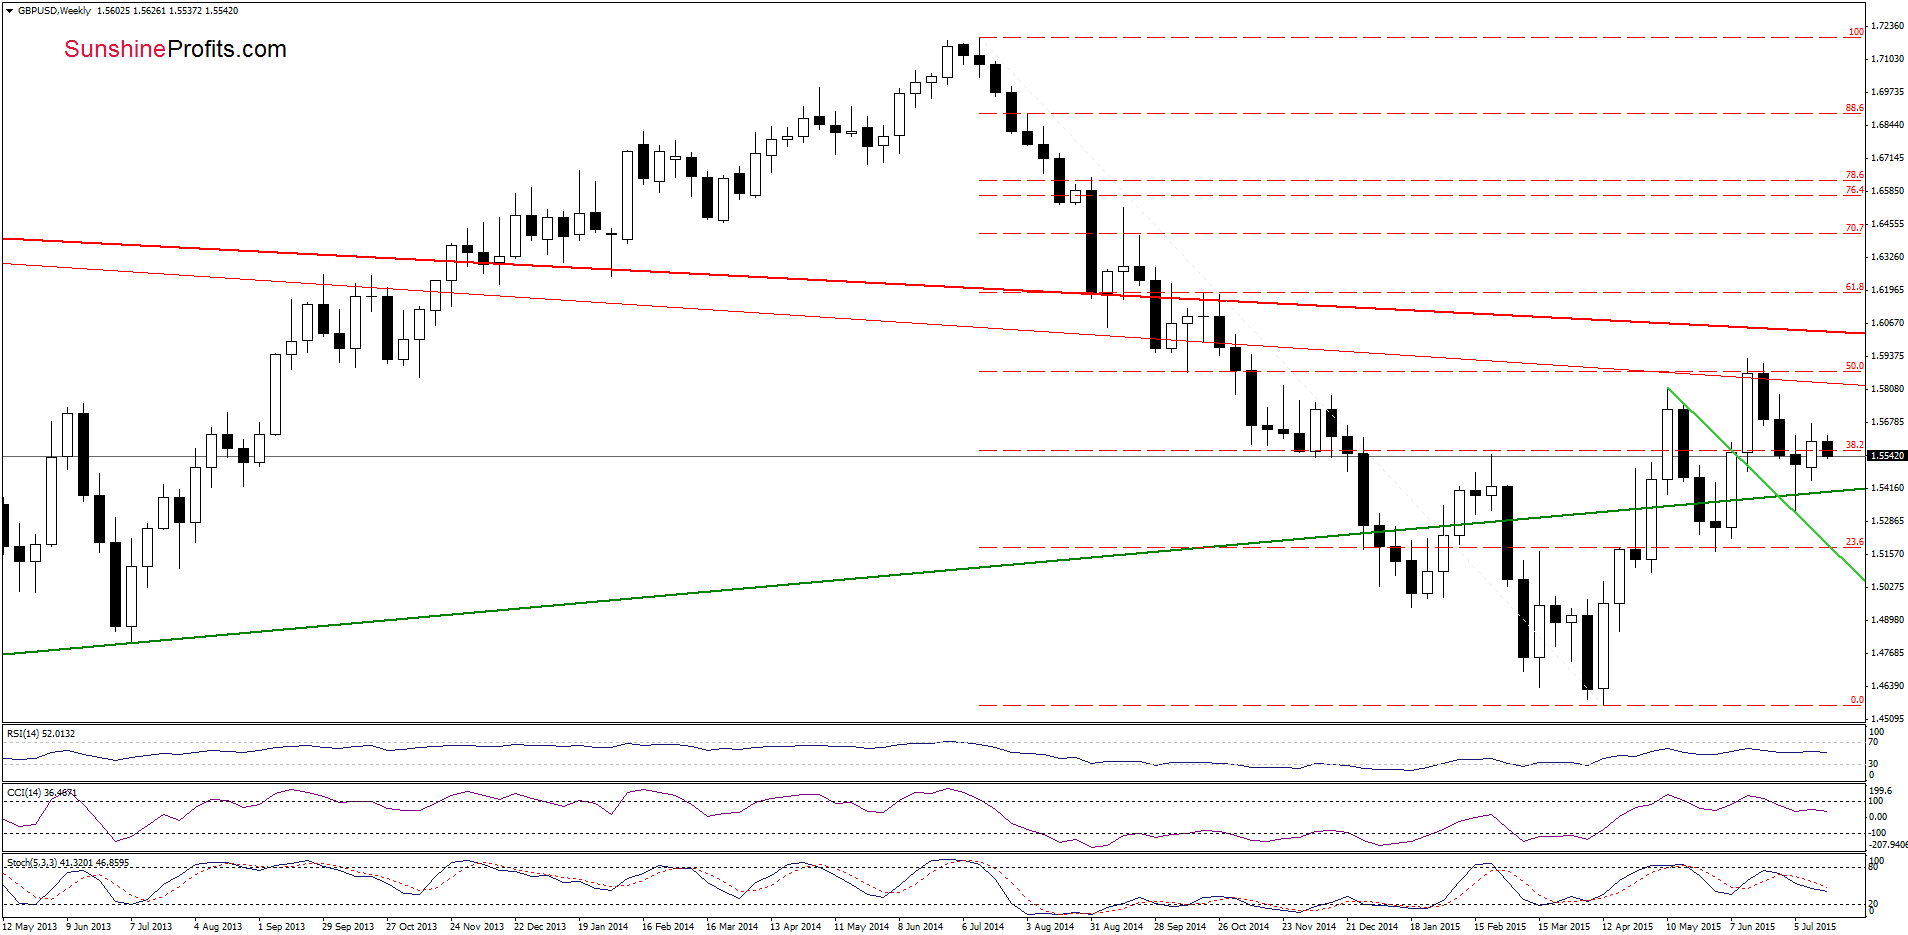
(…) the exchange rate is trading under the medium-term green line (it serves as resistance now). Therefore, (…) taking into account the current position of the indicators (the CCI reached the level of 100, while the Stochastic Oscillator is very close to generating a sell signal), it seems that reversal in the coming day(s) should not surprise us. If we see such price action and GBP/USD moves lower from here, it would be a negative signal, which will suggest that the current upward move is just a verification of the breakdown below the medium-term green resistance line.
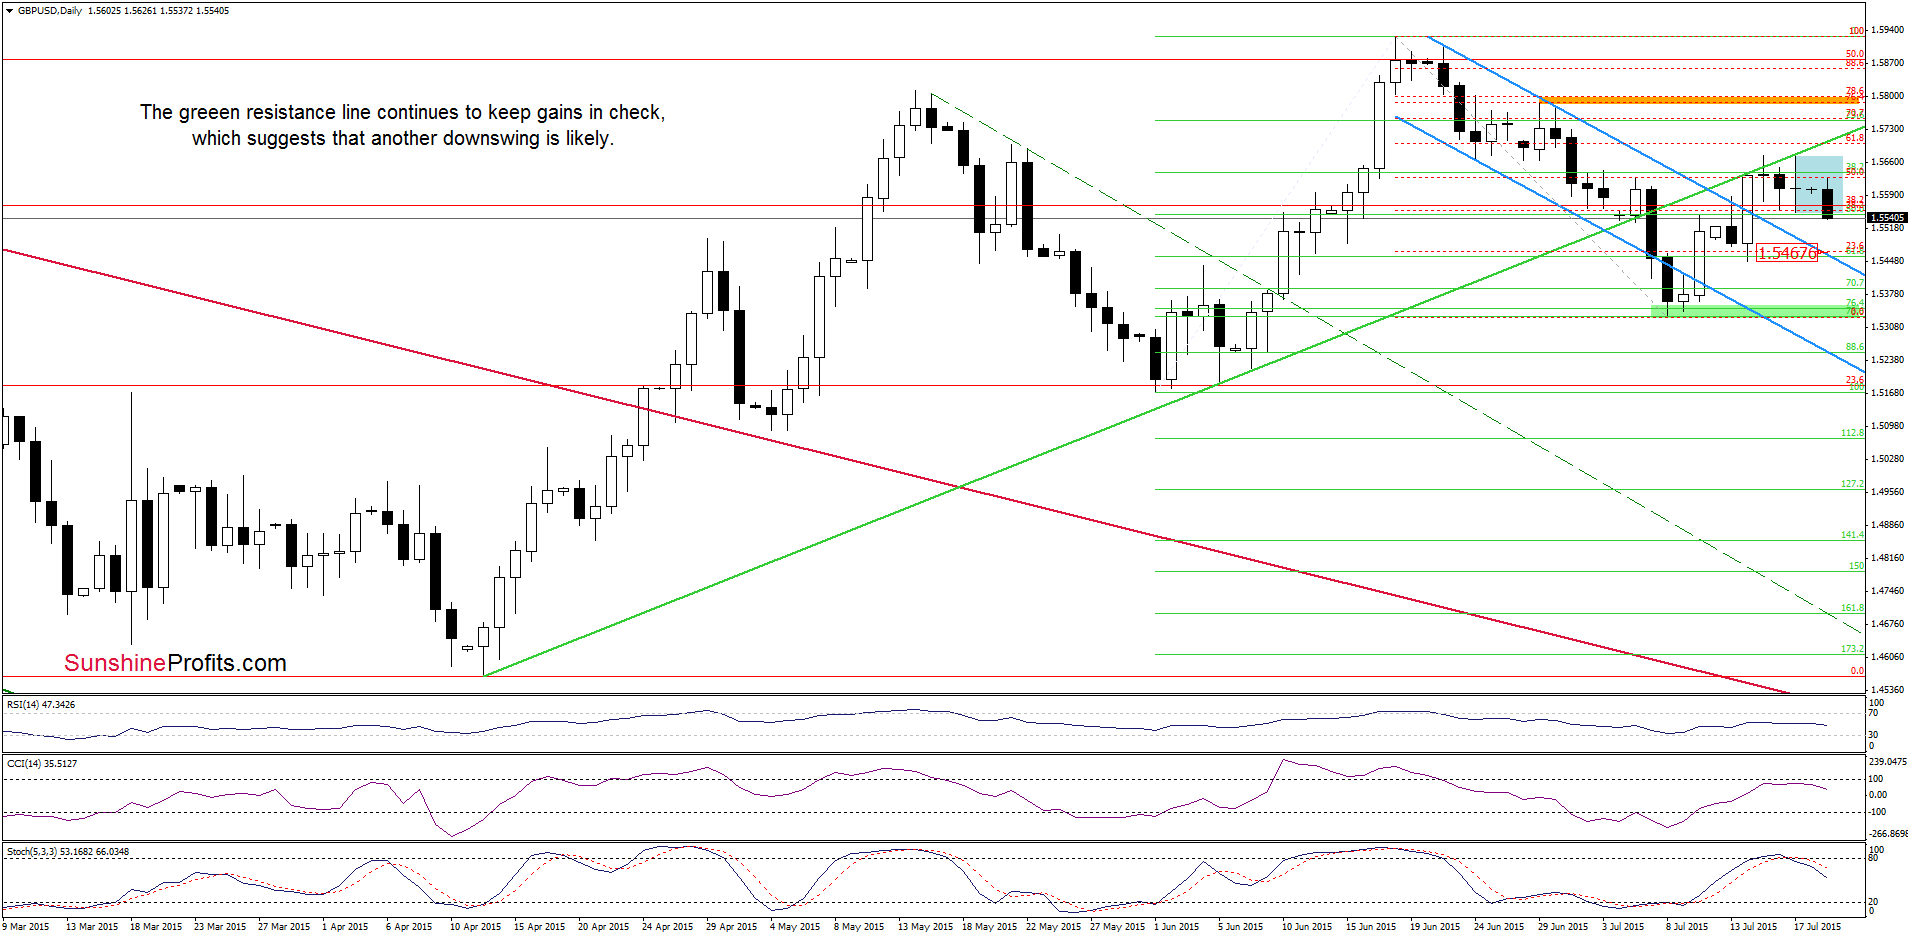
Looking at the daily chart, we see that currency bears pushed the exchange rate lower (as we had expected), which resulted in a drop to the lower border of the blue consolidation. If it is broken, GBP/USD will extend losses and we’ll likely see a decline to the previously-broken upper border of the declining blue trend channel (currently around 1.5467) in the coming days.
Very short-term outlook: mixed with bearish bias
Short-term outlook: mixed
MT outlook: mixed
LT outlook: mixed
Trading position (short-term; our opinion): No positions are justified from the risk/reward perspective at the moment. We will keep you informed should anything change, or should we see a confirmation/invalidation of the above.
AUD/USD
Quoting our Friday's Forex Trading Alert:
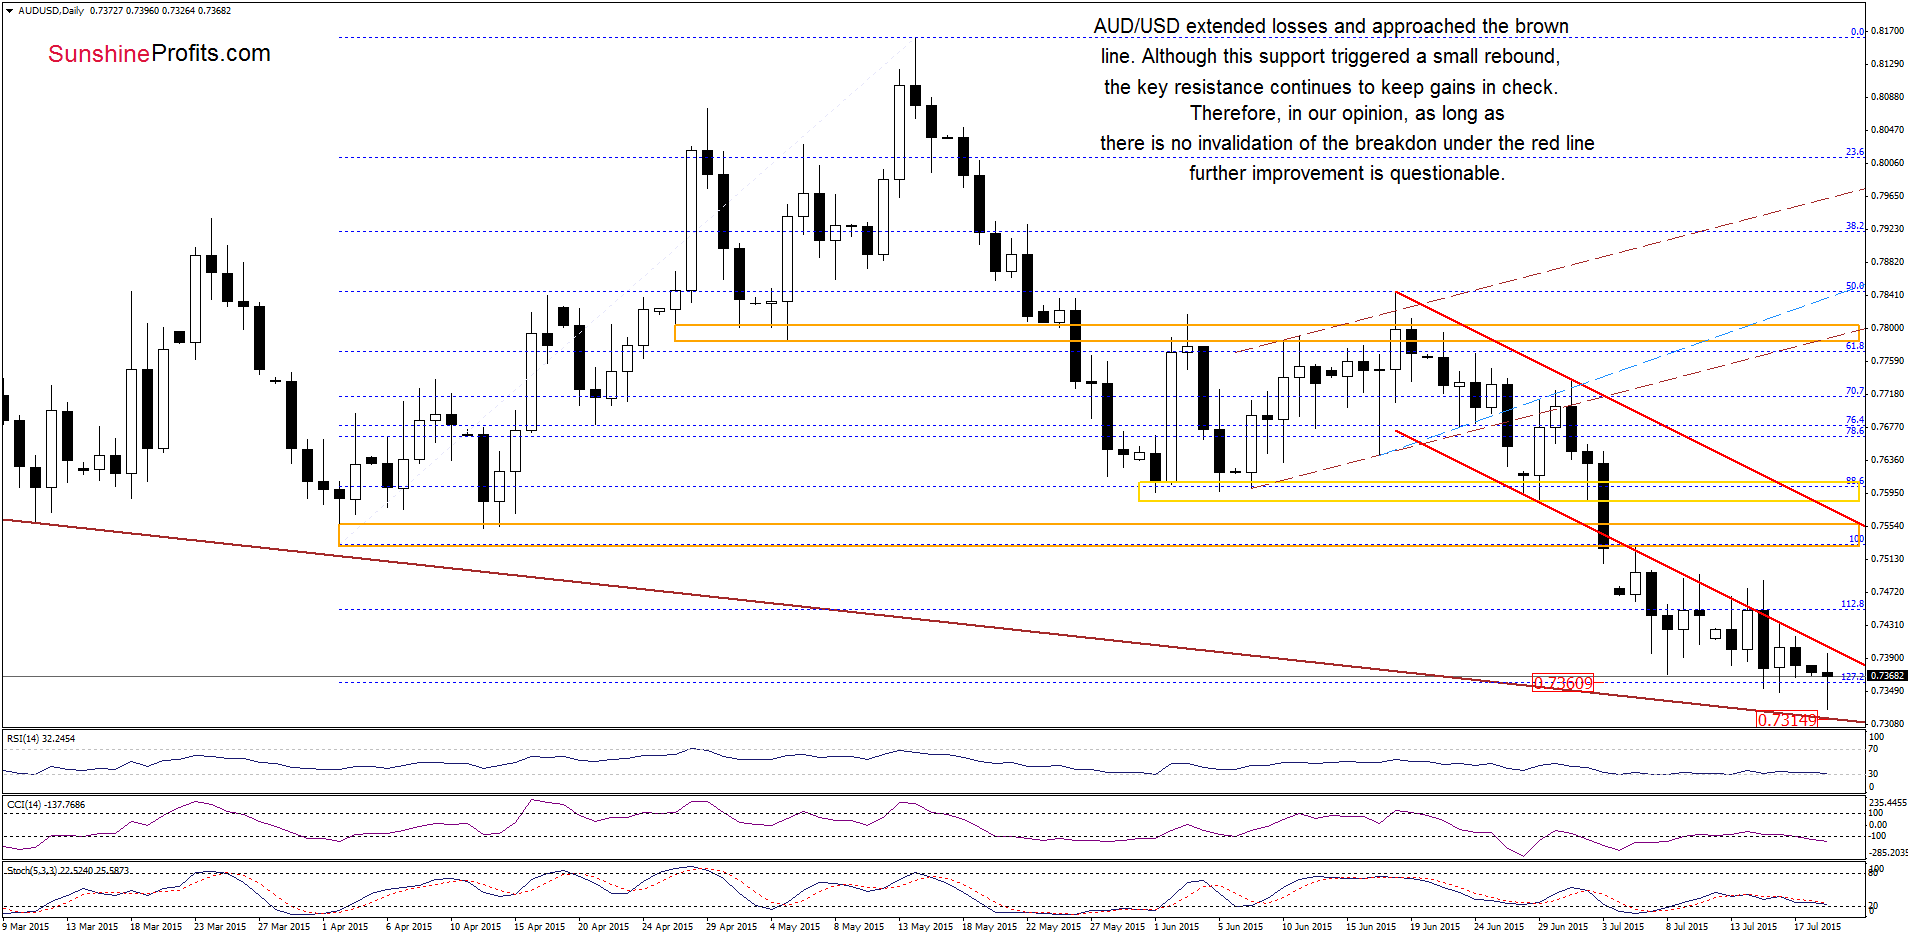
(…) we maintain our assumption that as long as there is no invalidation of the breakdown below the red declining resistance line another pullback is likely. How low could the pair go? If today’s low is broken, the next target would be around 0.7320 where the brown support line is.
Earlier today, AUD/USD extended losses and hit a fresh 2015 low, approaching our downside target. Although this support triggered a rebound, the exchange rate remains under the key resistance line, which means that as long as there is no invalidation of the breakdown below it another pullback is likely. If this is the case, and the pair moves lower from here, we’ll see another test of the medium-term brown support line (currently around 0.7315).
What could happen if currency bears manage to push the exchange rate lower? Let’s examine the weekly chart and find out.
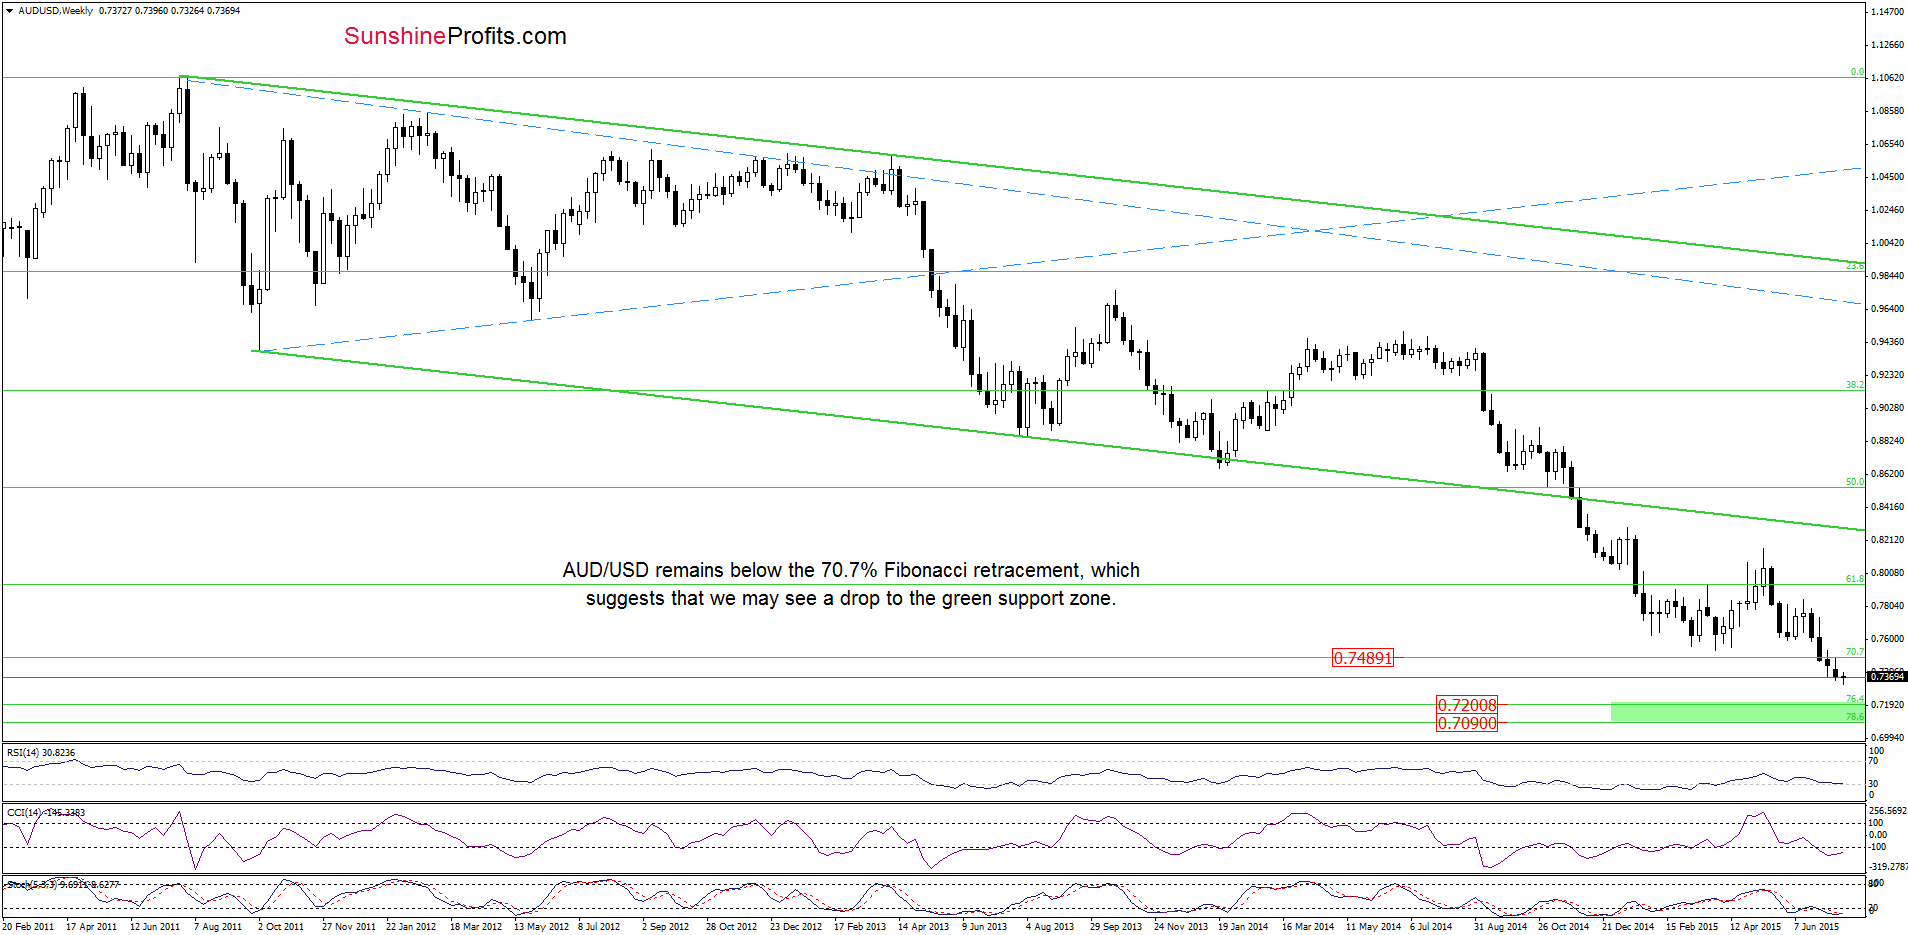
On the above chart, we see that AUD/USD is trading under the 70.7% Fibonacci retracement, which suggests that we may see a decline even to (around 0.7097-0.7200, where the green support zone based on the 76.4% and 78.6% Fibonacci retracement levels (marked on the weekly chart) is.
Very short-term outlook: mixed with bearish bias
Short-term outlook: mixed
MT outlook: mixed
LT outlook: mixed
Trading position (short-term; our opinion): No positions are justified from the risk/reward perspective at the moment. We will keep you informed should anything change, or should we see a confirmation/invalidation of the above.
Thank you.
Nadia Simmons
Forex & Oil Trading Strategist
Przemyslaw Radomski, CFA
Founder, Editor-in-chief
Gold & Silver Trading Alerts
Forex Trading Alerts
Oil Investment Updates
Oil Trading Alerts

