

Today’s industry data showed that Australia's new home sales dropped by 2.3% in the previous month, which pushed AUD/USD below the support line. Despite this deterioration, the exchange rate reversed and climbed to yesterday’s high. Will we see further rally?
In our opinion the following forex trading positions are justified - summary:
EUR/USD
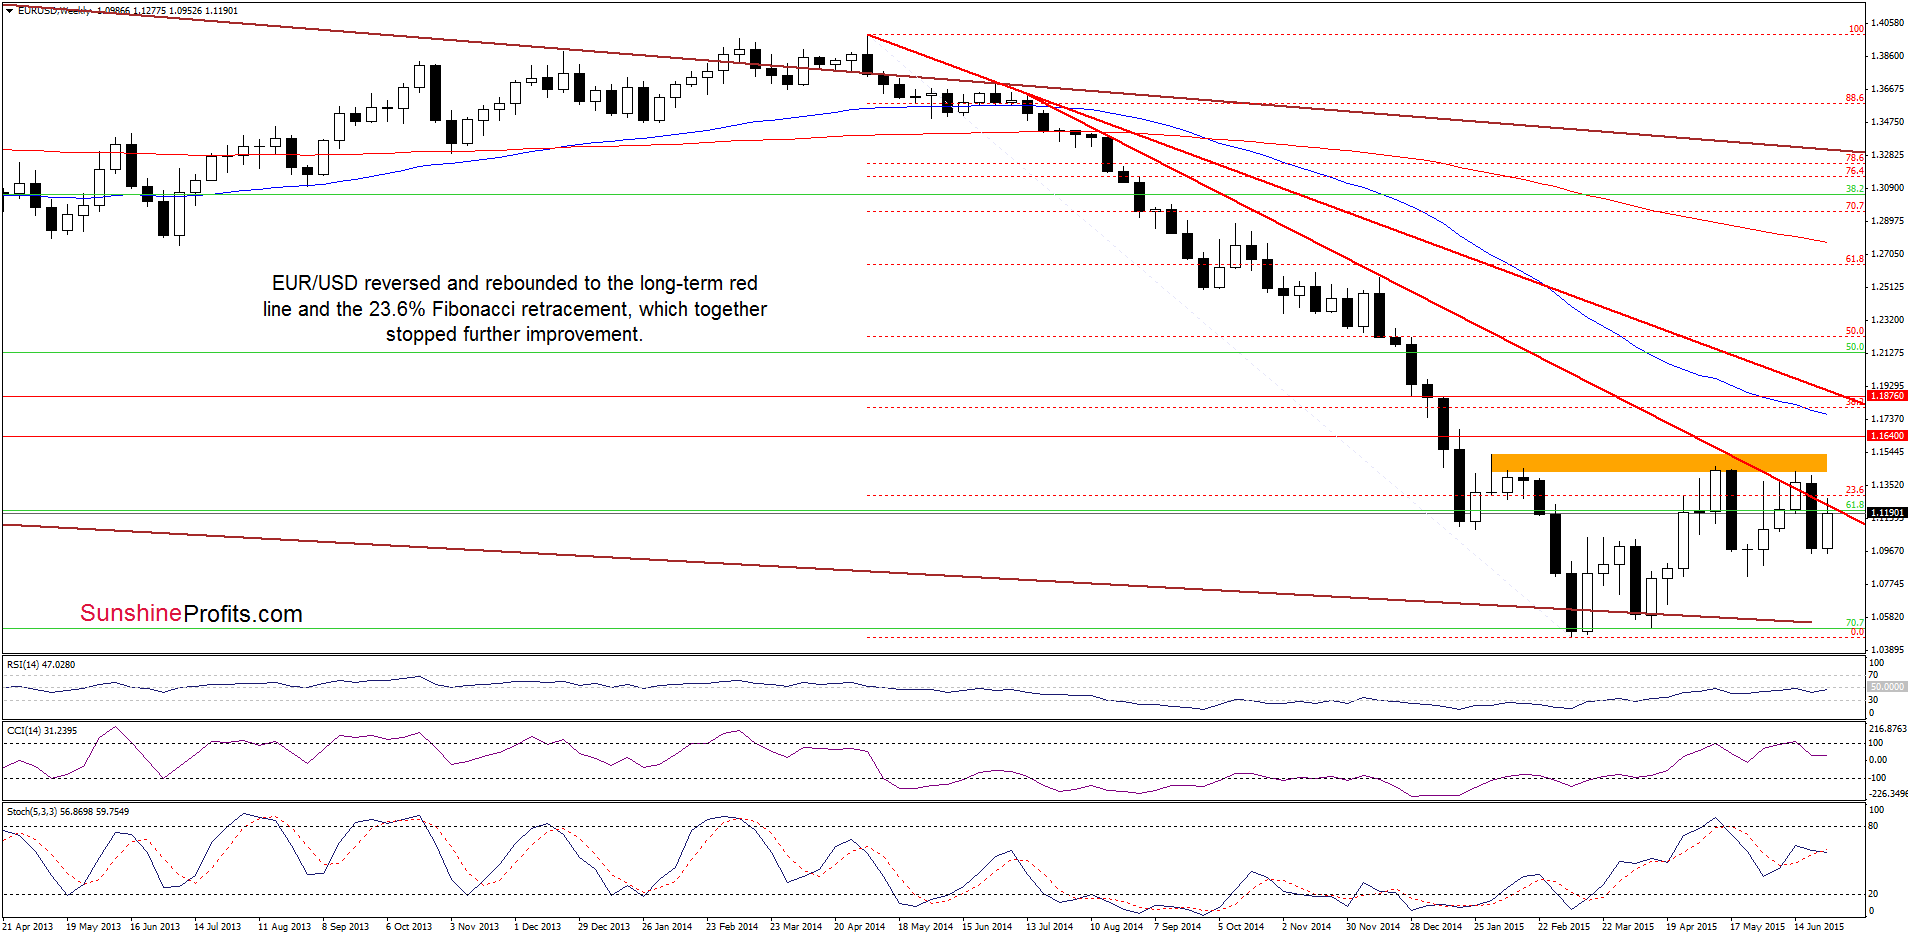
Looking at the weekly chart, we see that although EUR/USD extended gains, the pair remains under the long-term red declining line and the 23.6% Fibonacci retracement. Yesterday, this resistance area stopped the rally, which suggests that as long as there is no comeback above it we won’t see a test of the orange resistance zone and a pullback from here should not surprise us.
What can we infer from the very short-term picture? Let’s examine the daily chart and find out.
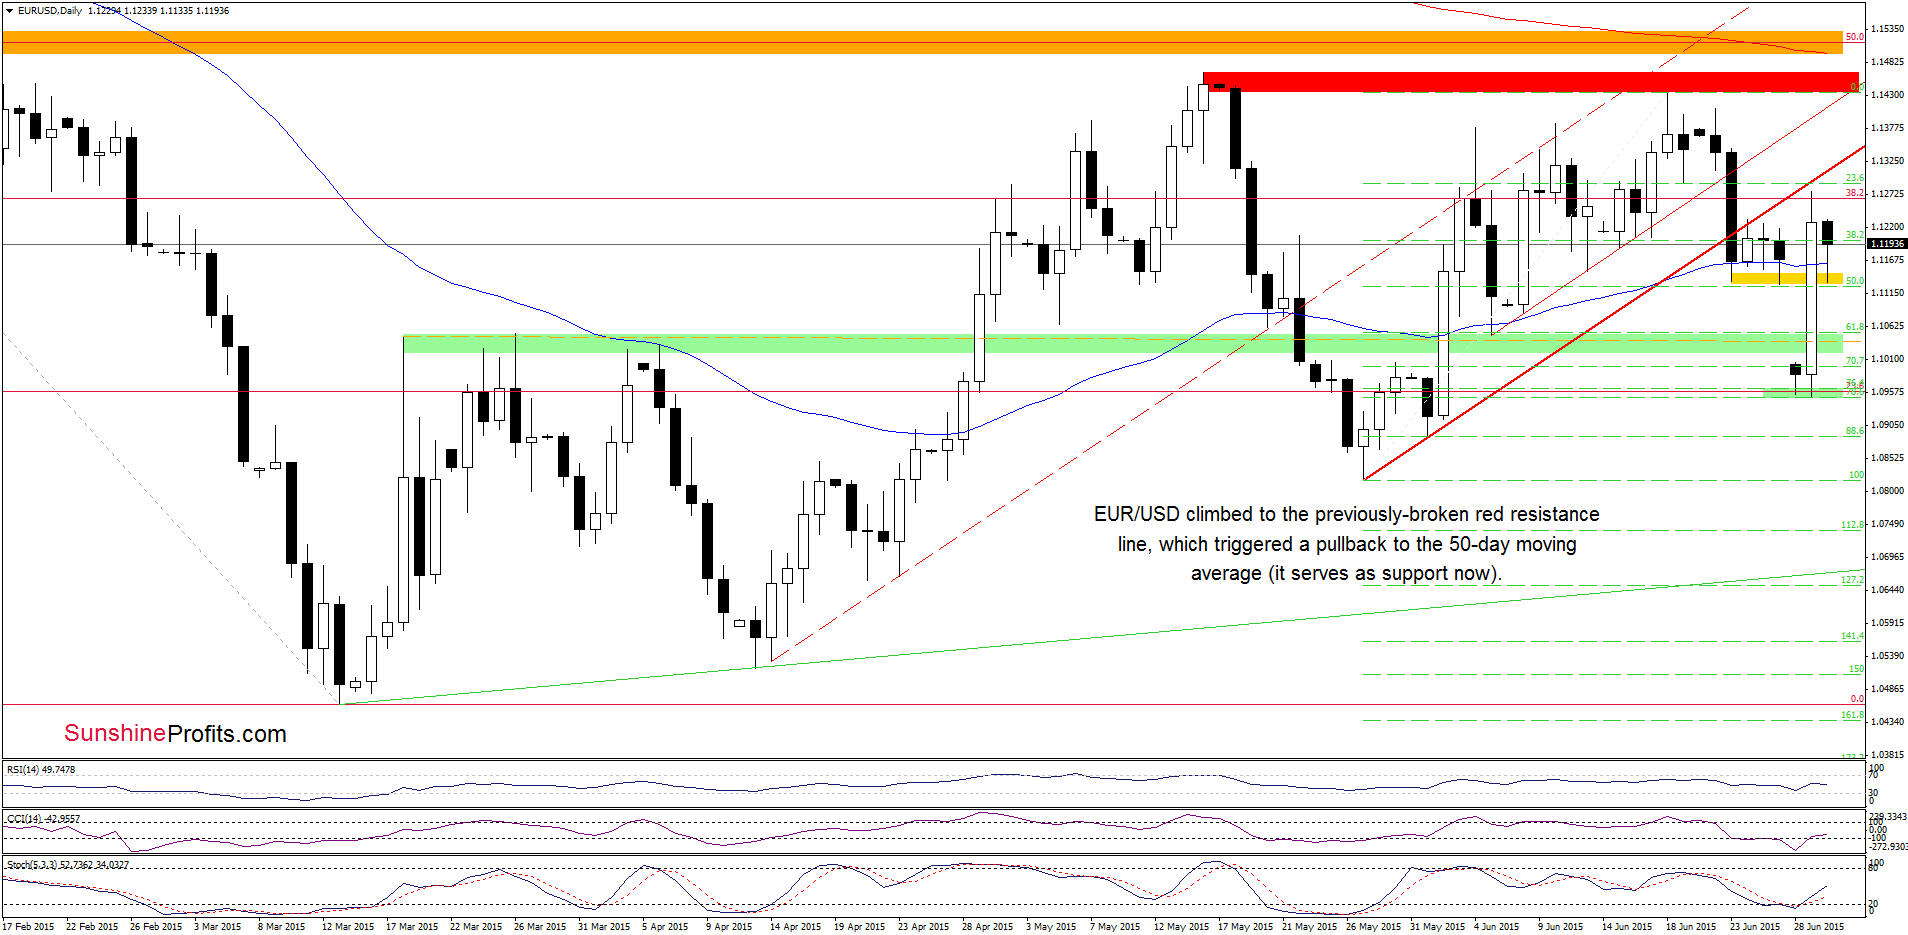
Yesterday, the exchange rate climbed to the previously-broken red line, but as you see on the daily chart, this solid resistance withstood the buying pressure and triggered a pullback – similarly to what we saw in the previous week. With today’s downswing EUR/USD slipped to the 50-day moving average and last week’s lows (they serve as the nearest support at the moment), which encouraged currency bulls to act and resulted in a rebound. What’s next? Taking into account buy signals generated by the indicators, we think that the pair will move higher once again, and we’ll see another test of the red resistance line in the coming day(s). Nevertheless, as long as there is no invalidation of the breakdown below this line, further improvement is questionable.
Very short-term outlook: mixed with bullish bias
Short-term outlook: mixed
MT outlook: mixed
LT outlook: mixed
Trading position (short-term; our opinion): No positions are justified from the risk/reward perspective at the moment. We will keep you informed should anything change, or should we see a confirmation/invalidation of the above.
GBP/USD
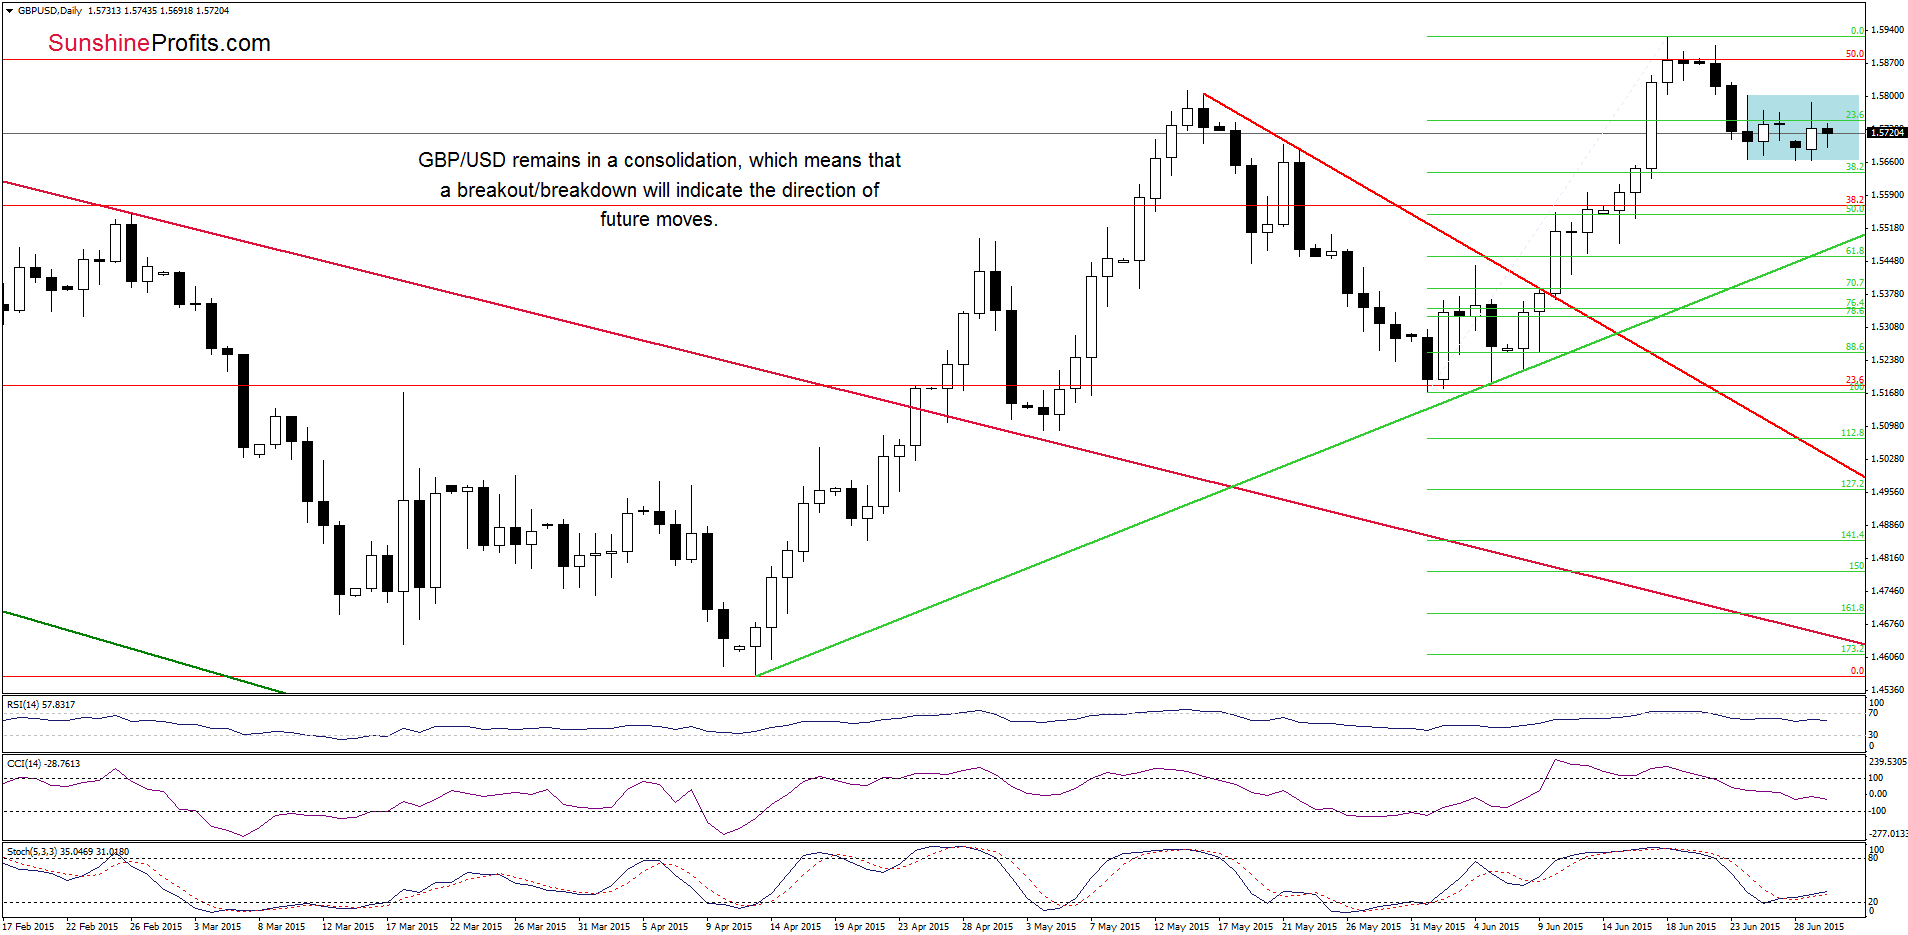
On the daily chart, we see that GBP/USD is trading in a consolidation (marked with blue), which makes the very short-term picture a bit unclear. However, taking into account buy signal generated by the Stochastic Oscillator, it seems that currency bulls will try to push the pair higher. If this is the case, and the exchange rate breaks above the upper line of the formation (around 1.5801), we’ll see a test of the June high.
Are there any medium-term factors that could hinder the realization of the above scenario? Let’s check the weekly chart.
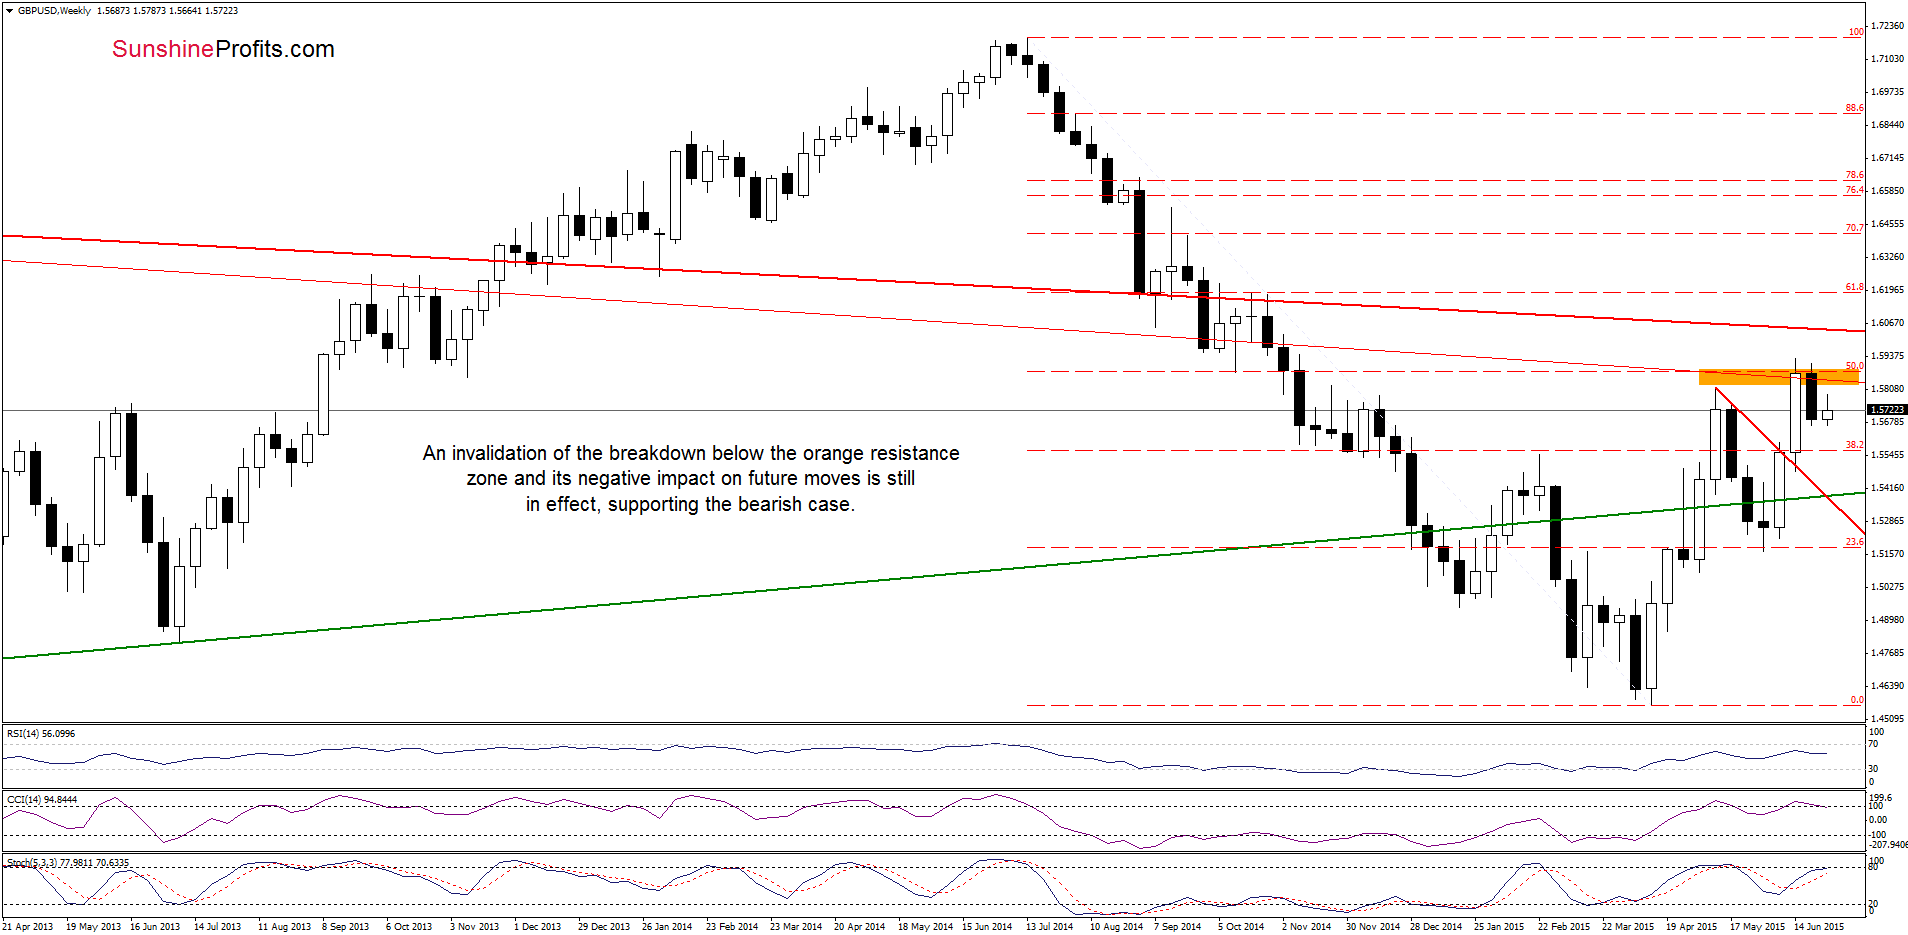
From today’s point of view we see that although GBP/USD rebounded earlier this week, the space for further increases seems limited as the previously-broken orange resistance zone (created by the 50% Fibonacci retracement and the red resistance line based on the previous highs) is quite close. Therefore, in our opinion, a sizable upward move will be likely only if we see a breakout above this area.
Very short-term outlook: mixed
Short-term outlook: mixed
MT outlook: mixed
LT outlook: mixed
Trading position (short-term; our opinion): No positions are justified from the risk/reward perspective at the moment. We will keep you informed should anything change, or should we see a confirmation/invalidation of the above.
AUD/USD
On Friday, we wrote the following:
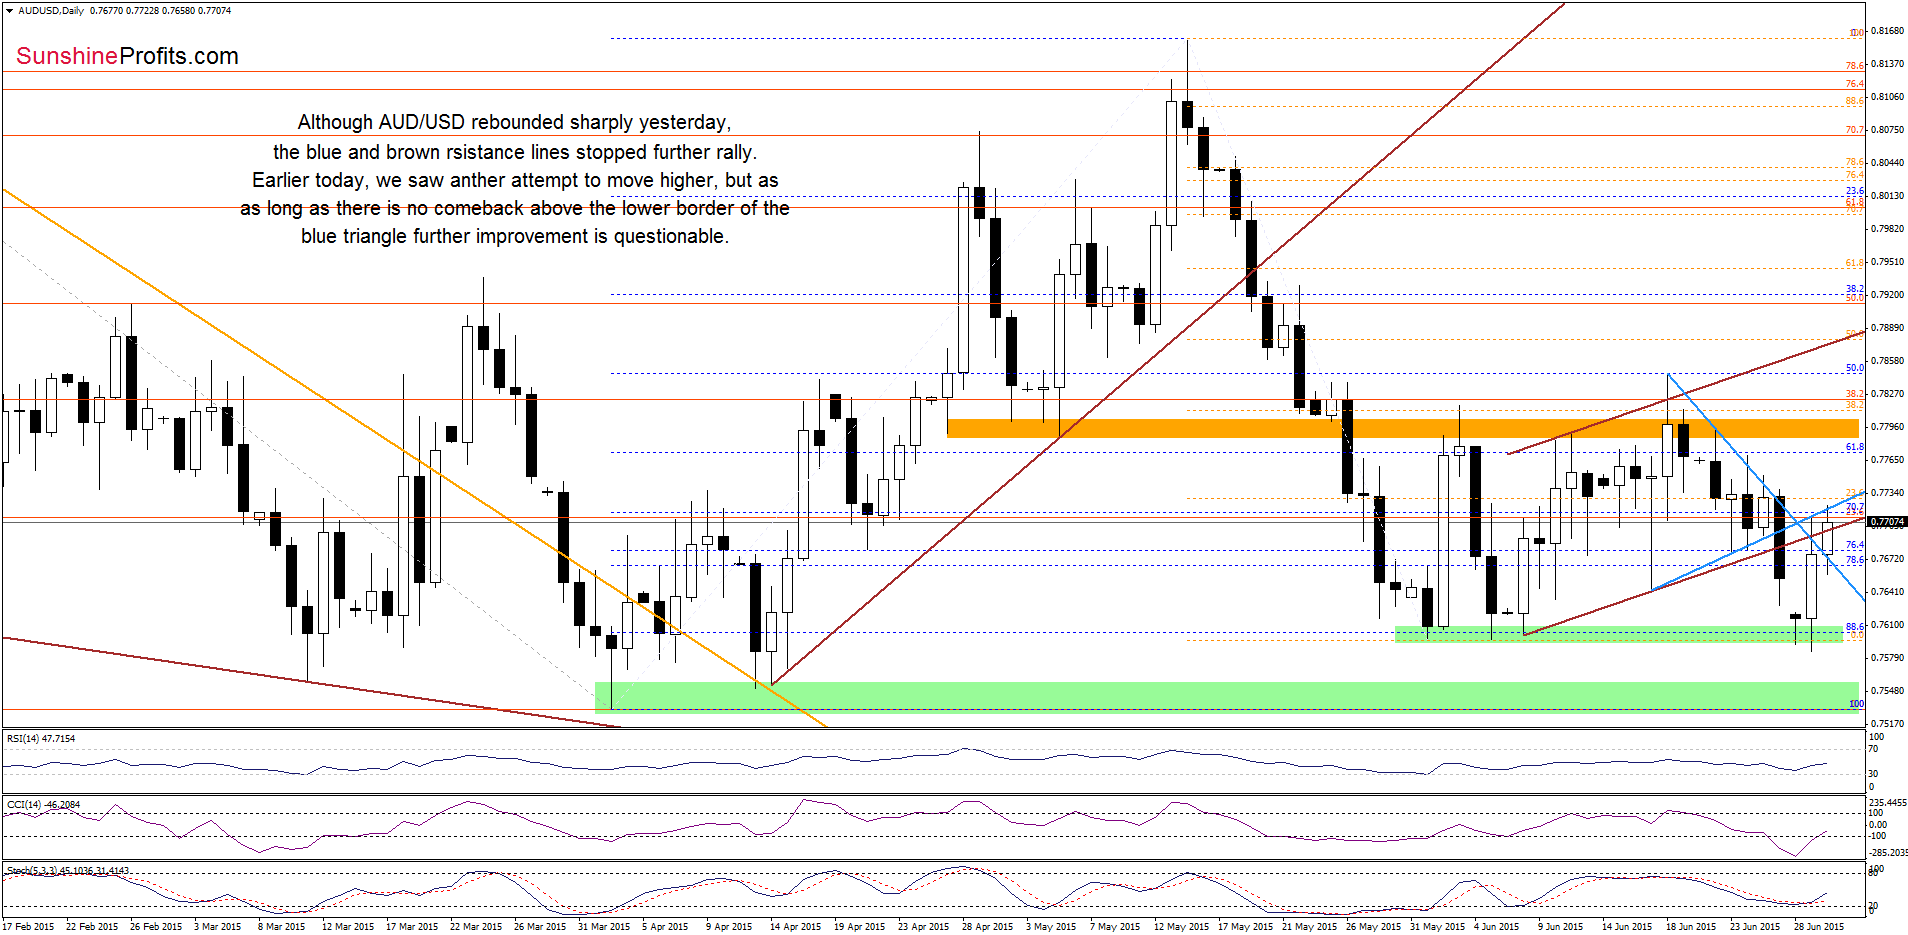
(…) a sharp decline (…) took the exchange rate (…) below the brown support line (the lower line of the rising trend channel). This is a bearish signal, which suggests further deterioration and a test of the green support zone created by the recent lows.
Looking at the daily chart, we see that the situation developed in line with the above scenario and AUD/USD reached our downside target yesterday. As you see on the chart, this soli support encouraged currency bulls to act, which resulted in a sharp rebound to the previously-broken lines. Despite this improvement, the brown and blue resistance lines withstood the buying pressure, triggering a pullback. Nevertheless, earlier today, the exchange rate moved higher once again, reaching the lower border of the triangle. What’s next? Taking into account buy signals generated by the indicators, we think that currency bulls will try to push the pair higher in the coming day(s). However, in our opinion, further rally will be more likely (and reliable) if we see a daily close above these resistance lines.
Having said that, let’s take a closer look at the weekly chart.
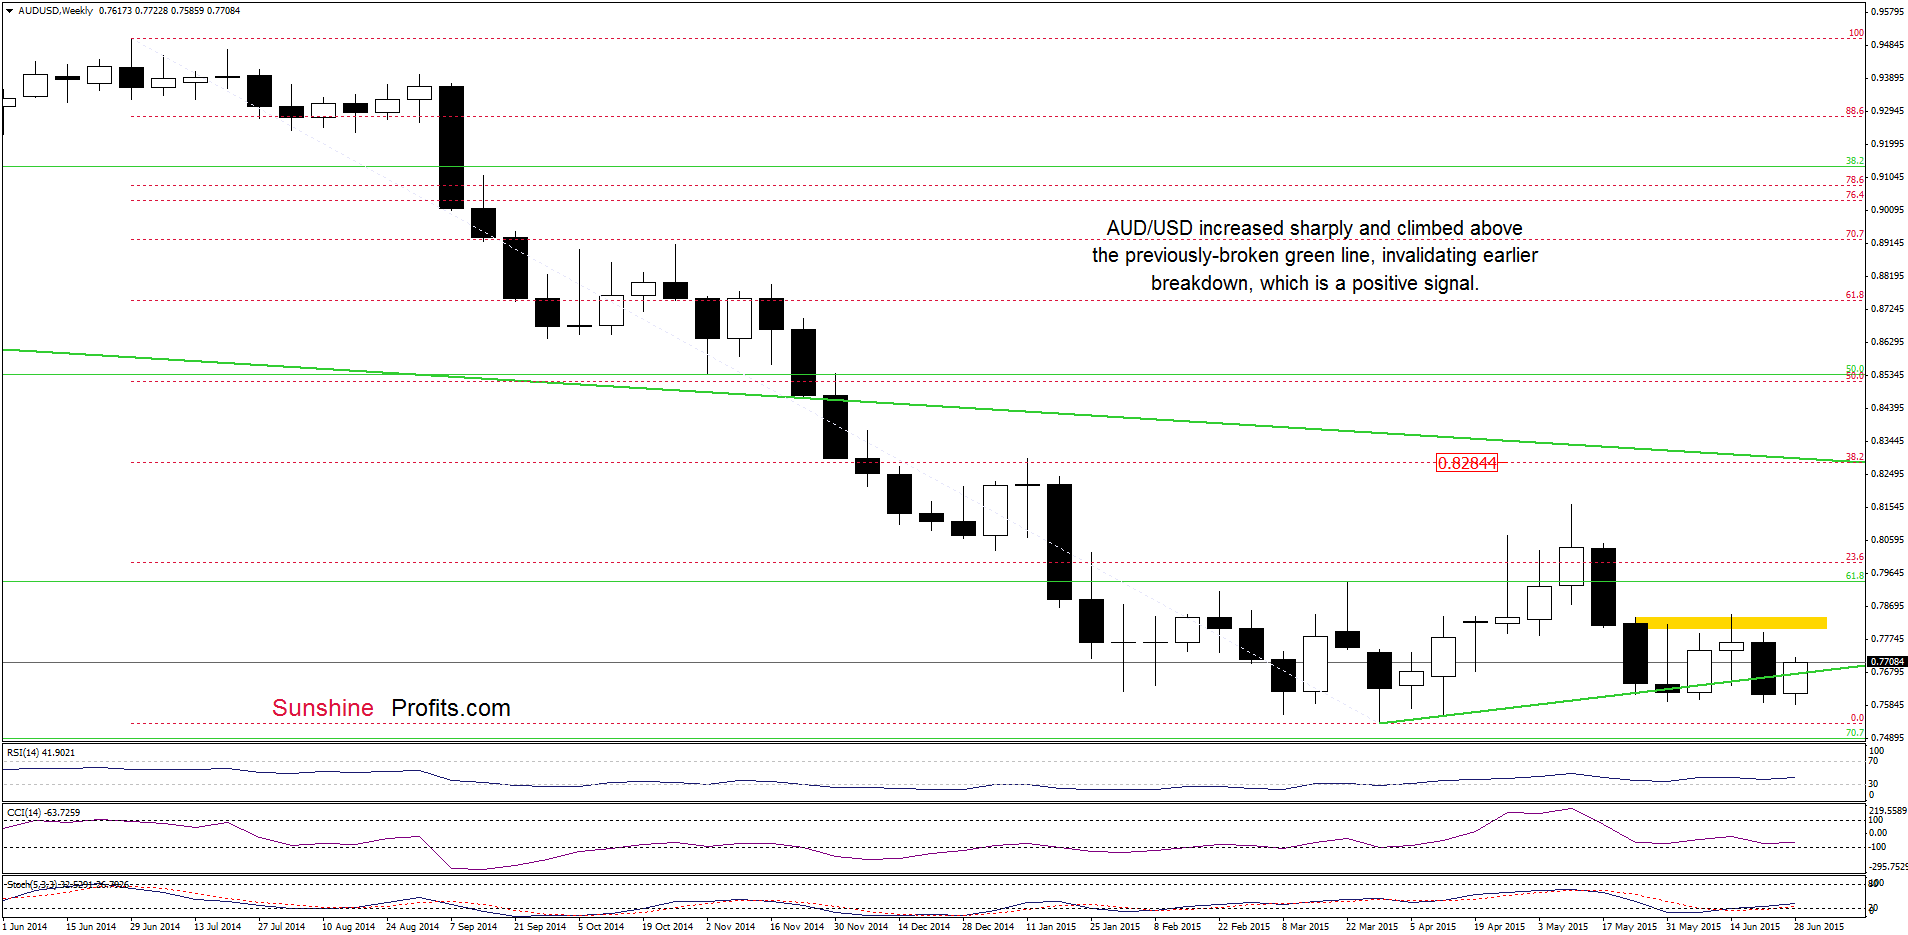
The first thing that catches the eye on the above chart is an invalidation of the breakdown below the green support line. This is a positive sign, which suggests further improvement – especially when we factor in a buy signal generated by the Stochastic Oscillator. If this is the case, and AUD/USD moves higher from here, the initial upside target for currency bulls would be the orange resistance zone created by the previous highs.
Very short-term outlook: mixed with bullish bias
Short-term outlook: mixed with bullish bias
MT outlook: mixed with bullish bias
LT outlook: mixed
Trading position (short-term; our opinion): No positions are justified from the risk/reward perspective at the moment. We will keep you informed should anything change, or should we see a confirmation/invalidation of the above.
Thank you.
Nadia Simmons
Forex & Oil Trading Strategist
Przemyslaw Radomski, CFA
Founder, Editor-in-chief
Gold & Silver Trading Alerts
Forex Trading Alerts
Oil Investment Updates
Oil Trading Alerts

