

On Saturday, Greece broke off negotiations with creditors and Prime Minister Alexis Tsipras called for a referendum on whether to accept the terms proposed by lenders for extending the country’s bailout, which triggered deposit outflows over the weekend. As a result, yesterday, the Greek government ordered an emergency bank shutdown and the central bank moved to impose capital controls. What impact did these circumstances have on currency market?
In our opinion the following forex trading positions are justified - summary:
EUR/USD
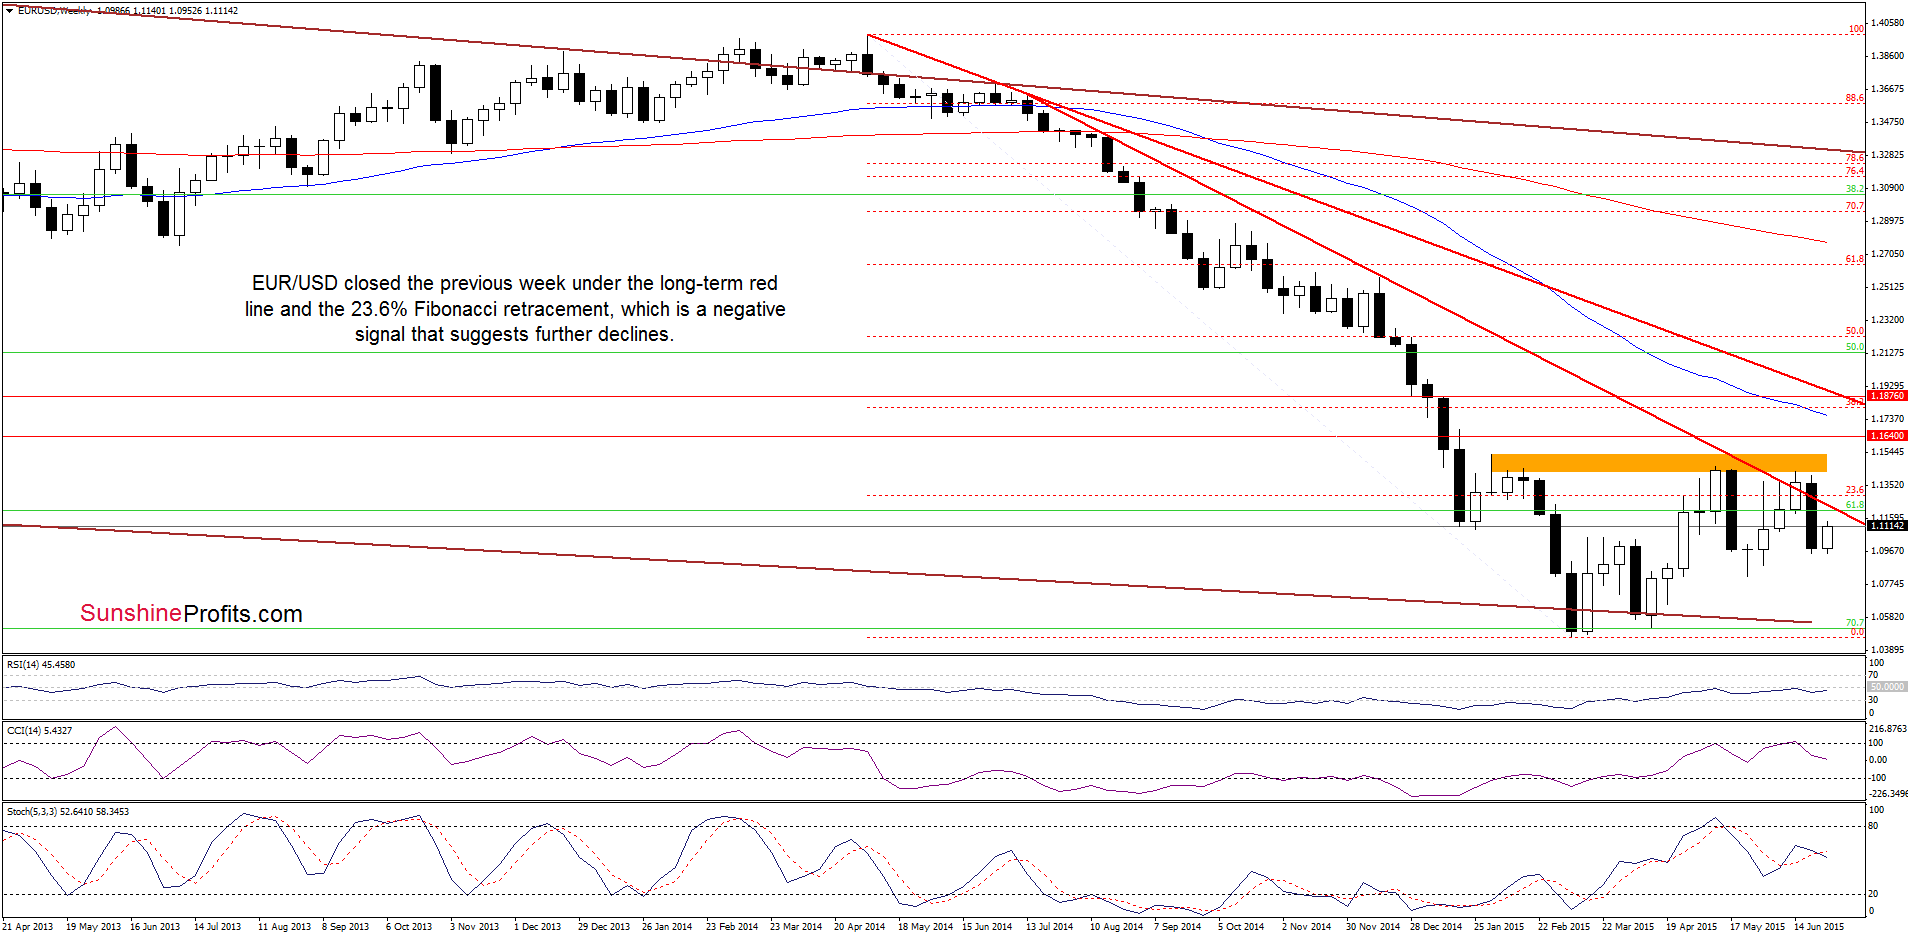
As you see on the weekly chart, although EUR/USD rebounded, the pair closed the previous week under the long-term red declining line and the 23.6% Fibonacci retracement, which is a negative signal that suggests further deterioration in the coming week.
Can we infer something more from the very short-term picture? Let’s examine the daily chart and find out.
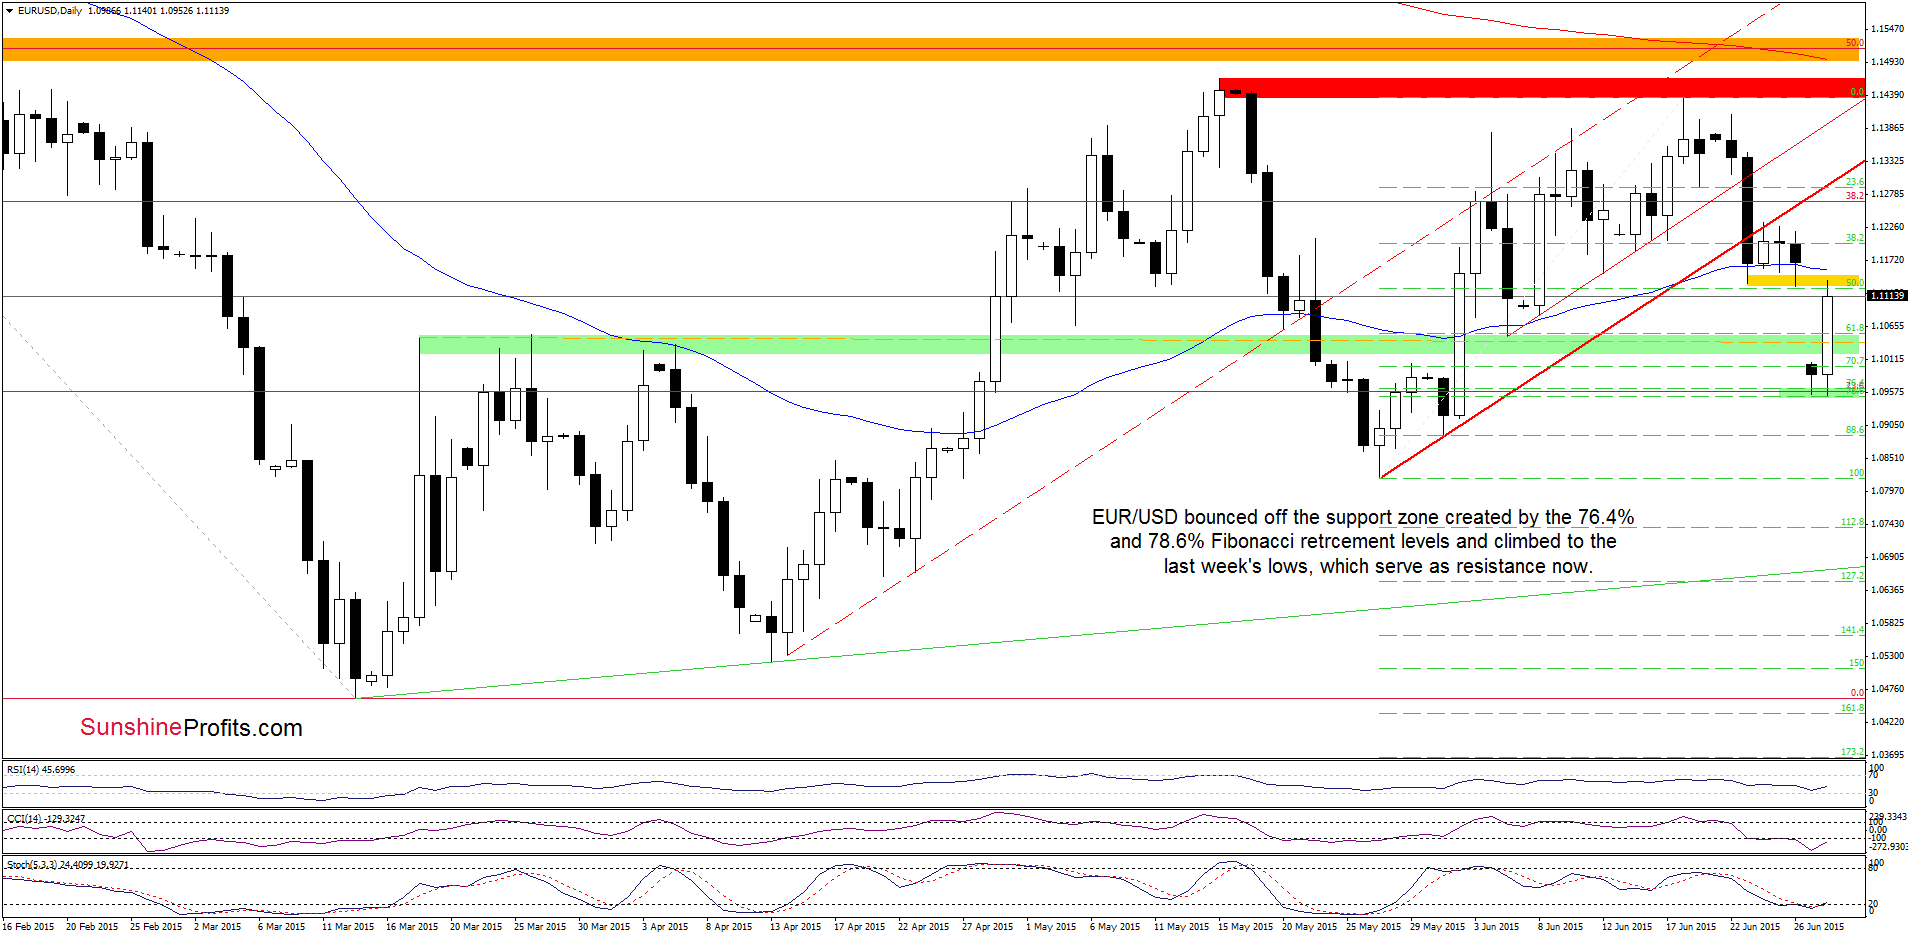
From this perspective, we see that the exchange rate opened this week well below the previous week’s low. However, the support zone created by the 76.4% and 78.6% Fibonacci retracement levels encouraged currency bulls to act, which resulted in a sharp rebound. With this upswing, EUR/USD climbed to the last week’s lows, which serve as resistance at the moment. Additionally, they are reinforced by the 50-day moving average, which suggests that as long as we don’t see an invalidation of the breakdown below them another pullback is likely. Nevertheless, looking at the current position of the indicators, it seems that currency bulls will try to push the pair higher in the coming days.
Very short-term outlook: mixed
Short-term outlook: mixed
MT outlook: mixed
LT outlook: mixed
Trading position (short-term; our opinion): No positions are justified from the risk/reward perspective at the moment. We will keep you informed should anything change, or should we see a confirmation/invalidation of the above.
USD/CAD
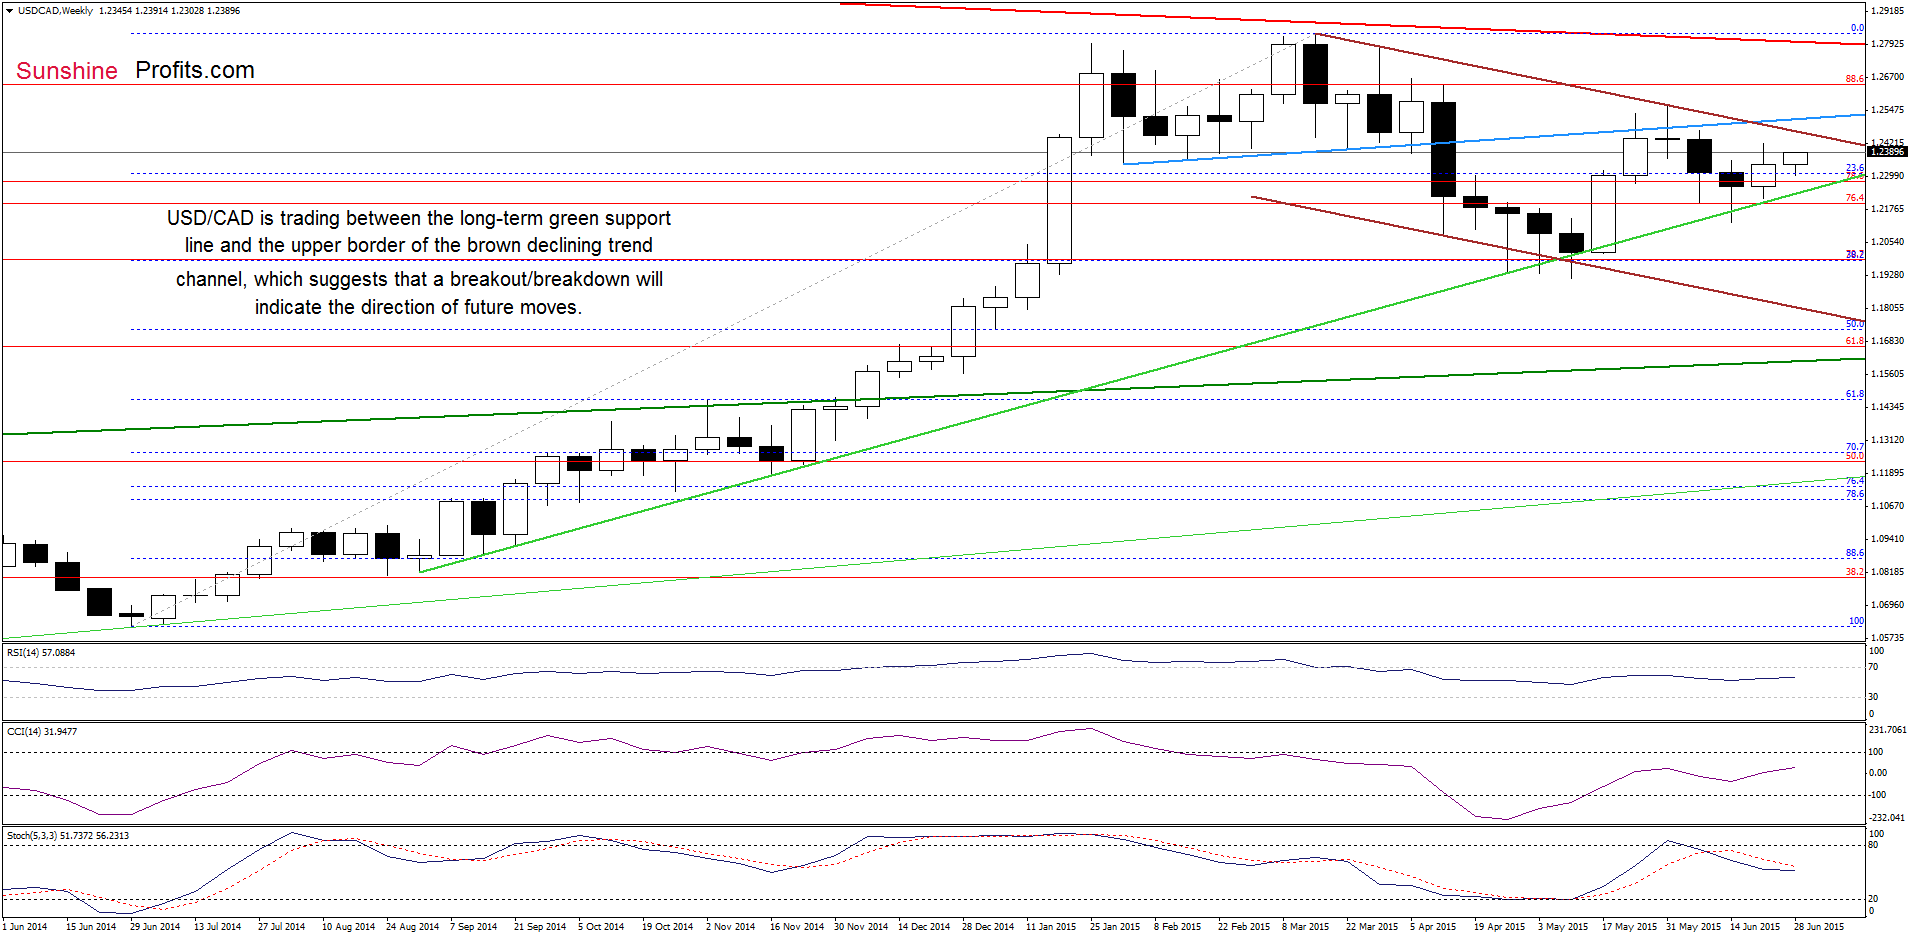
From today’s point of view we see that the situation in the medium term hasn’t changed much as USD/CAD is trading between the long-term green support line and the upper border of the brown declining trend channel. This suggests that a breakout/breakdown will indicate the direction of future moves.
Will the daily chart give us more clues? Let’s take a closer look and find out.
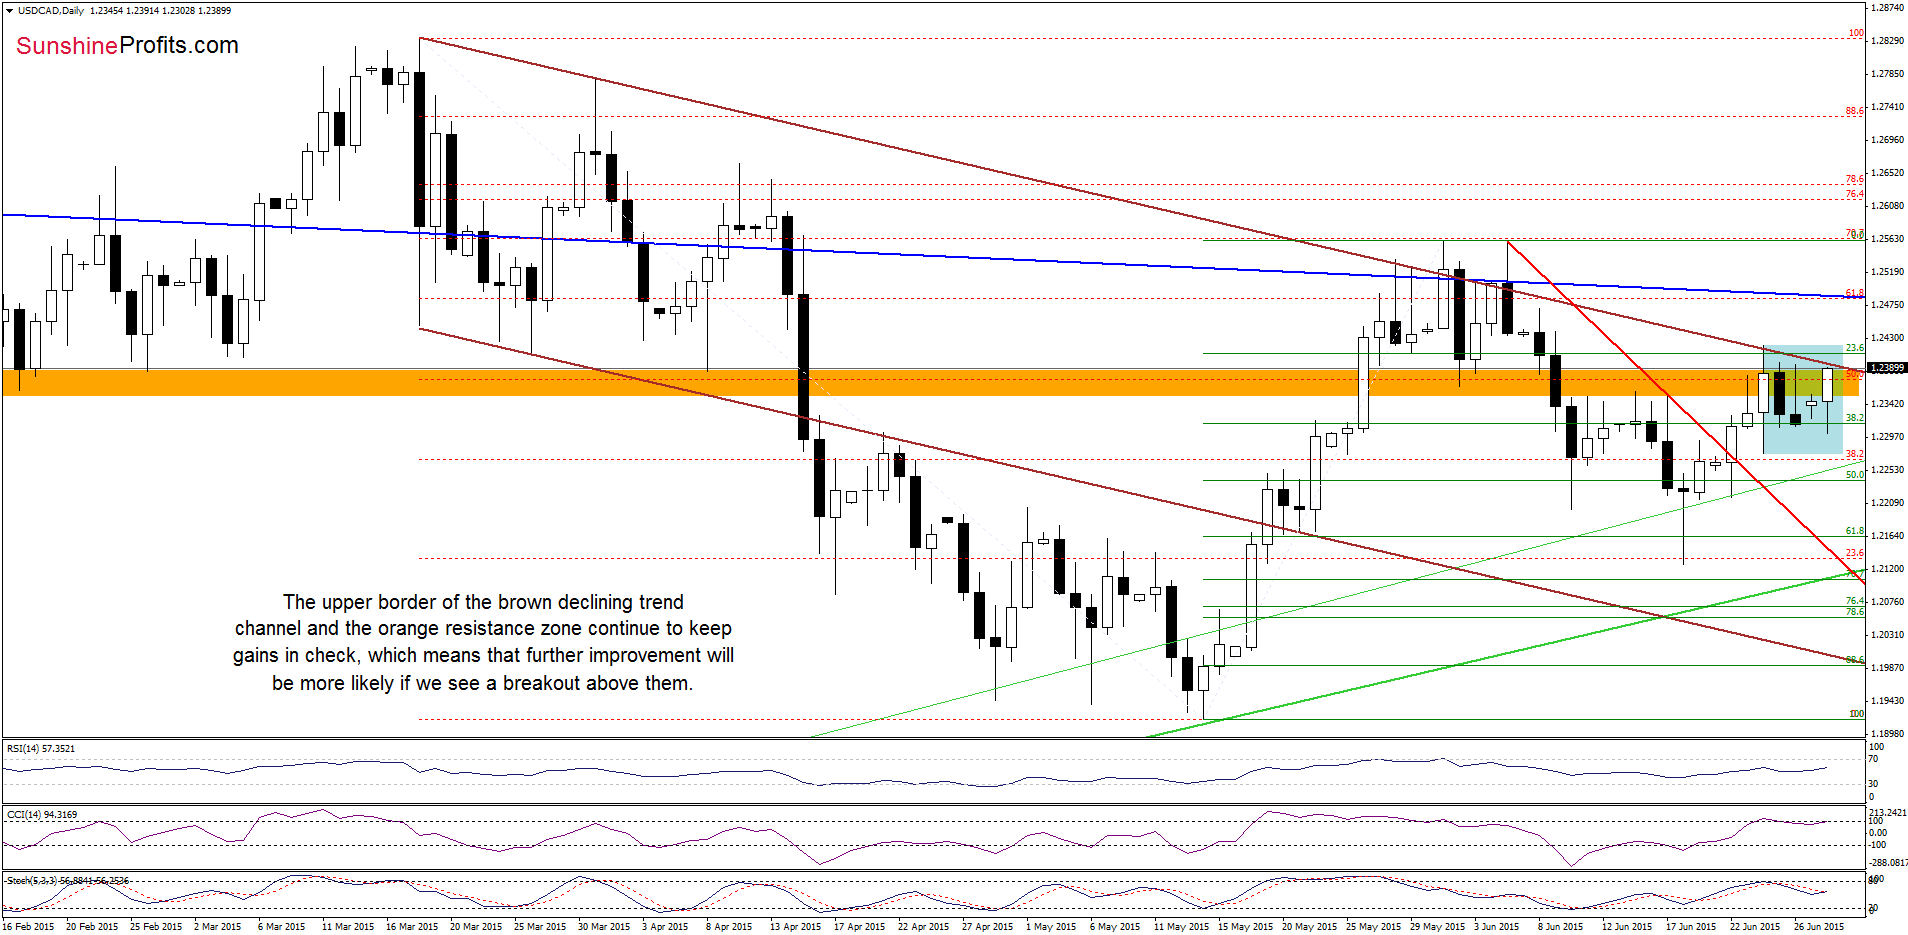
Earlier today, USD/CAD moved sharply higher and climbed above the orange resistance zone, approaching the upper border of the brown declining trend channel once again. In the previous week, this solid resistance was strong enough to stop currency bulls and trigger pullbacks, which suggests that we could see similar price action in the coming day. If this is the case, the exchange rate will reverse and test the lower border of the blue consolidation.
Finishing today’s commentary on this currency pair, please keep in mind that as long as there is no breakout above this major resistance line further rally is not likely to be seen (especially when we take into account the position of the indicators).
Very short-term outlook: mixed with bearish bias
Short-term outlook: mixed
MT outlook: mixed
LT outlook: mixed
Trading position (short-term; our opinion): No positions are justified from the risk/reward perspective at the moment. We will keep you informed should anything change, or should we see a confirmation/invalidation of the above.
USD/CHF
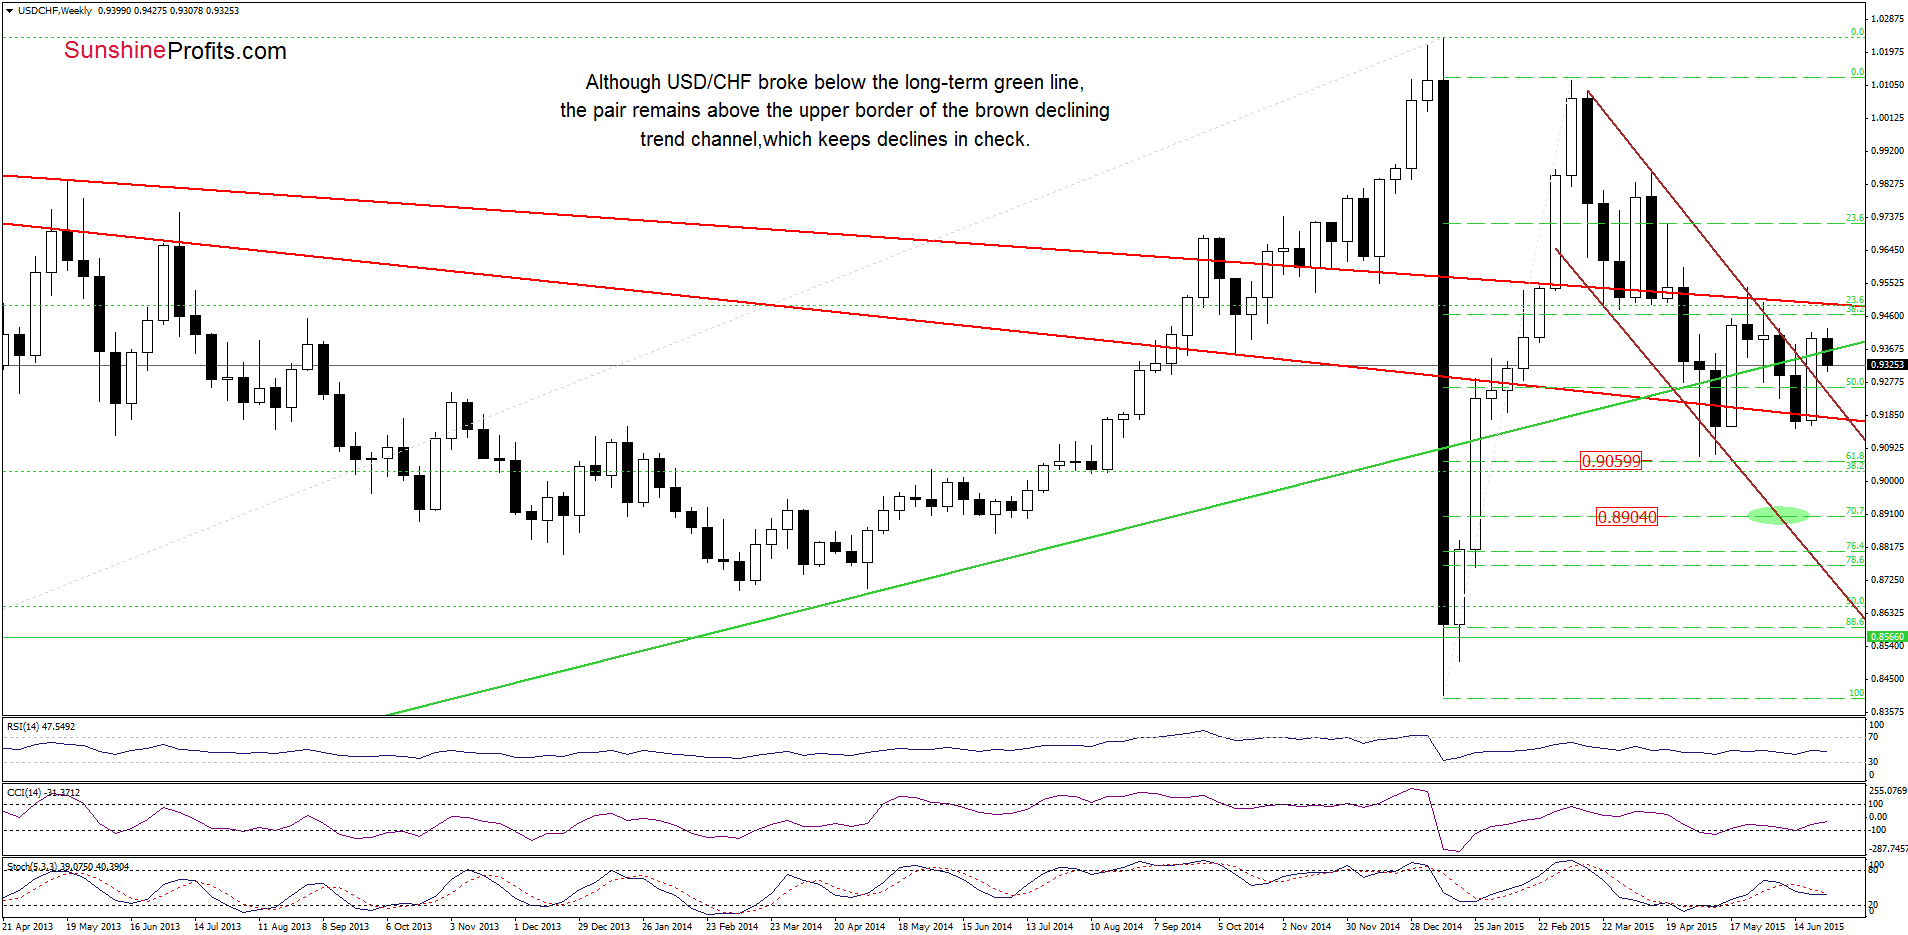
The medium-term picture has deteriorated as USD/CHF pulled back and slipped under the long-term green line, invalidating earlier breakout. Although this is a negative signal that suggests further deterioration, the pair remains above the previously-broken upper border of the brown declining trend channel, which serves as the nearest support (currently around 0.9241). Nevertheless, if the exchange rate extends losses and breaks below it, this would be a bearish signal that will likely trigger a drop to the long-term red support line in the following week.
How did this drop affect the very short-term picture? Let’s check.
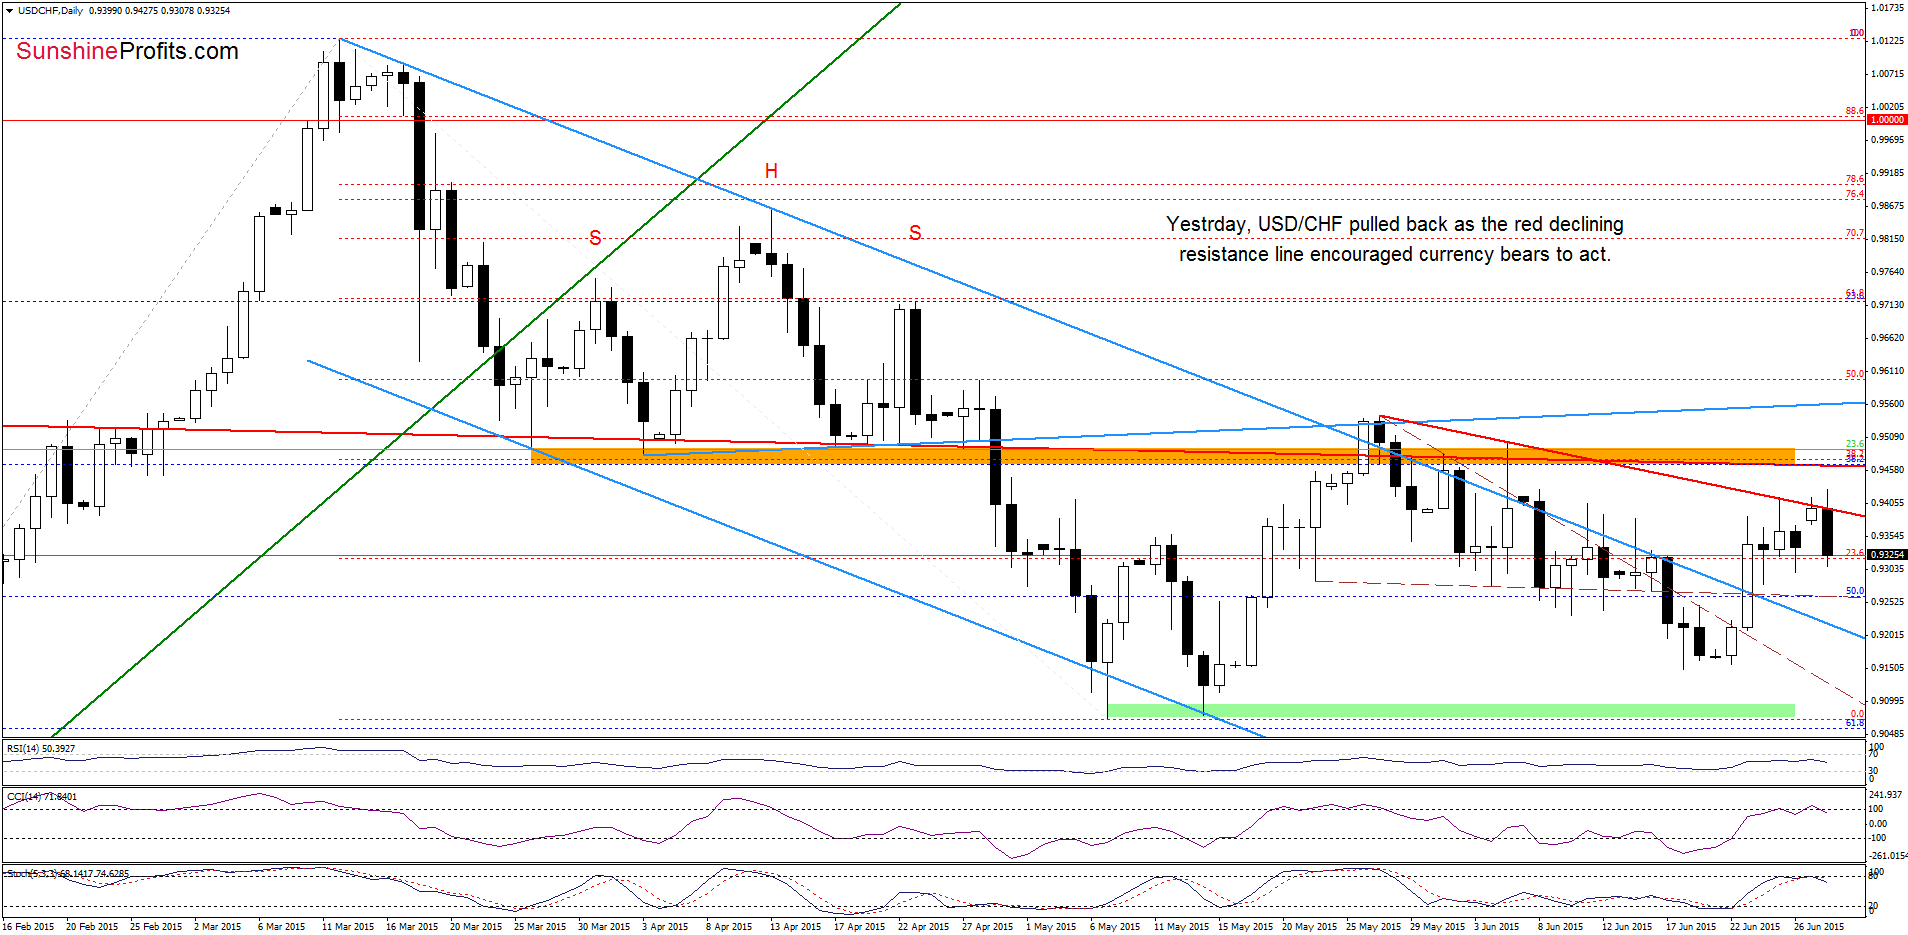
As you see on the daily chart, USD/CHF climbed above the red resistance line (based on the May 27 and June5 highs) earlier today, but this improvement was only very temporary and the pair invalidated this small breakout very quickly. This negative signal triggered further deterioration and approached the pair to Friday’s low. Additionally, the CCI and Stochastic Oscillator generated sell signals, which in combination with the medium-term picture suggests lower values of the exchange rate. If this is the case, and the pair moves lower from here, the downside target for currency bears would be around 0.9222, where the previously-broken upper border of the blue declining trend channel currently is.
Very short-term outlook: mixed with bearish bias
Short-term outlook: mixed
MT outlook: mixed
LT outlook: mixed
Trading position (short-term; our opinion): No positions are justified from the risk/reward perspective at the moment. We will keep you informed should anything change, or should we see a confirmation/invalidation of the above.
Thank you.
Nadia Simmons
Forex & Oil Trading Strategist
Przemyslaw Radomski, CFA
Founder, Editor-in-chief
Gold & Silver Trading Alerts
Forex Trading Alerts
Oil Investment Updates
Oil Trading Alerts

