

Earlier today, the Swiss National Bank Chairman Thomas Jordan warned that the Swiss currency was overvalued and added that the bank will continue to weaken it by intervening in currency markets. As a result, USD/CHF moved sharply higher, reaching a short-term resistance. Will we see a breakout in the coming days?
In our opinion the following forex trading positions are justified - summary:
EUR/USD
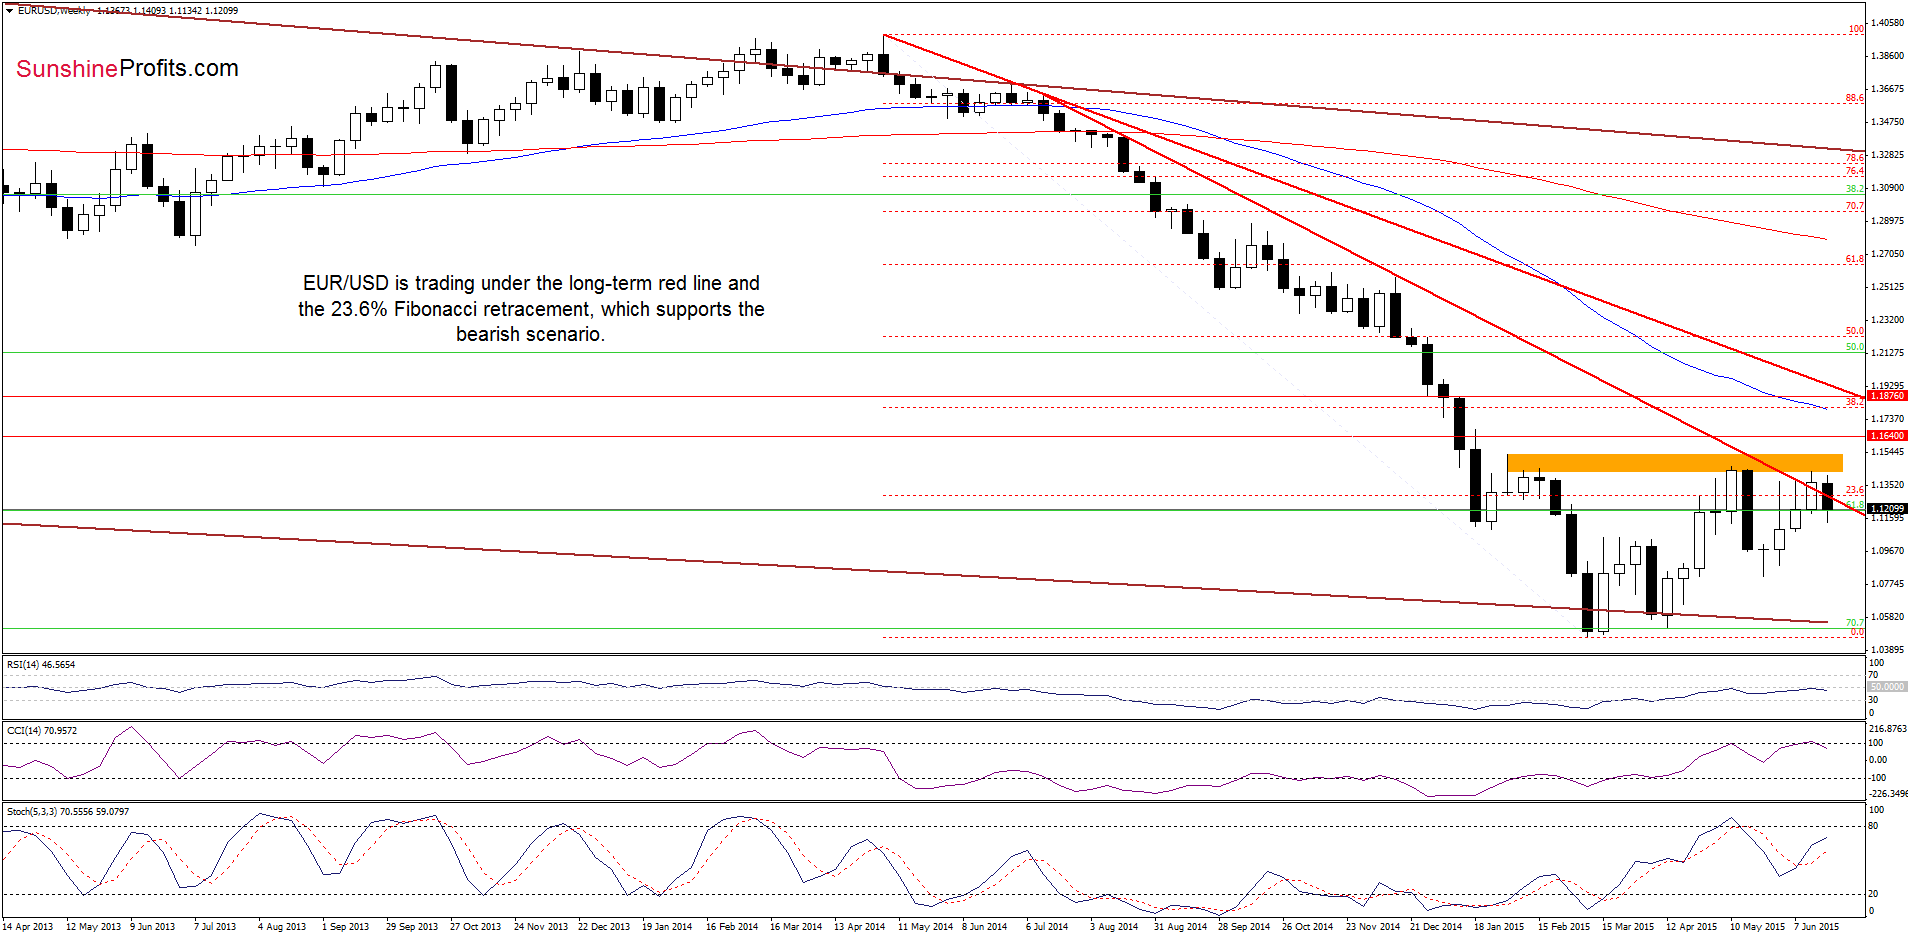
As you see on the weekly chart, EUR/USD is trading under the long-term red declining line and the 23.6% Fibonacci retracement, which means that an invalidation of earlier breakout and its negative impact on future moves are in effect, suggesting that lower values f the exchange rate are just around the corner.
Can we infer something more from the very short-term picture? Let’s examine the daily chart and find out.
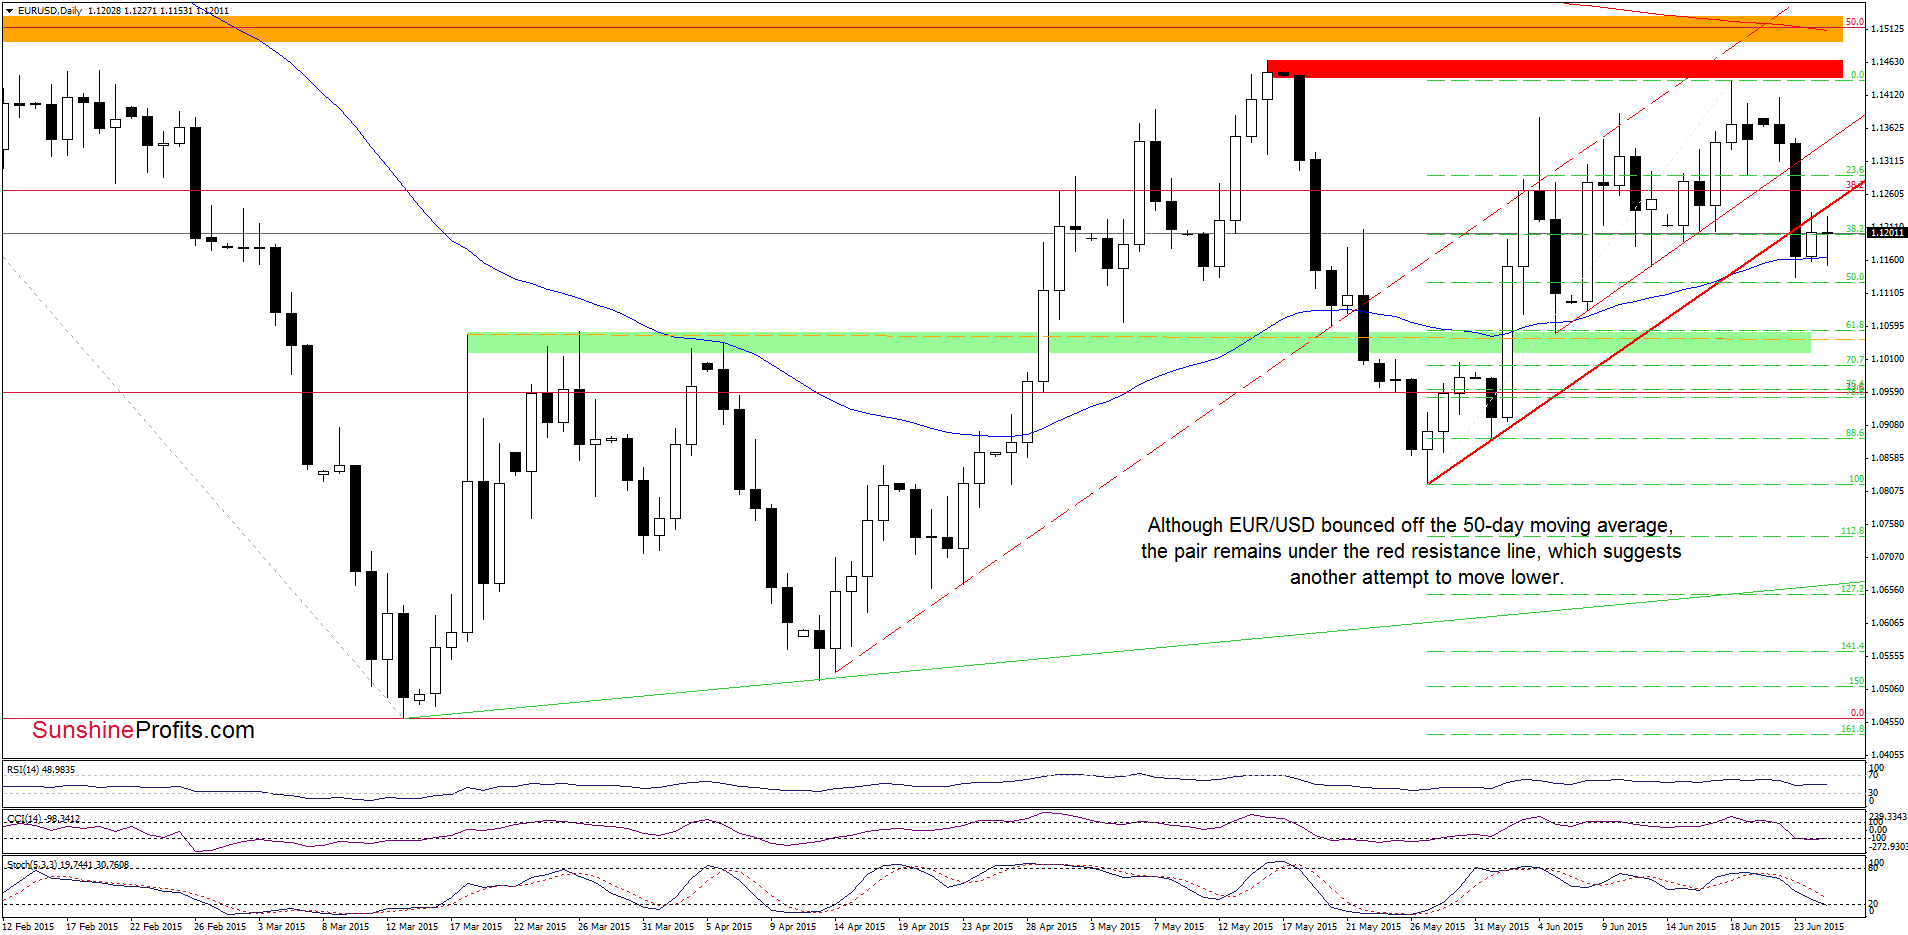
Looking at the daily chart, we see that although EUR/USD bounced off the 50-day moving average once again, the pair remains under the previously-broken red resistance line based on the May and Jun lows (it serves as the nearest resistance now), which suggests that yesterday’s upswing could be nothing more than a verification of the breakdown. If this is the case, another attempt to move lower should not surprise us (especially when we take into account sell signals generated by the indicators, which support the bearish scenario).
Very short-term outlook: mixed with bearish bias
Short-term outlook: mixed
MT outlook: mixed
LT outlook: mixed
Trading position (short-term; our opinion): No positions are justified from the risk/reward perspective at the moment. We will keep you informed should anything change, or should we see a confirmation/invalidation of the above.
USD/CAD
In our last commentaryon this currency pair, we wrote:
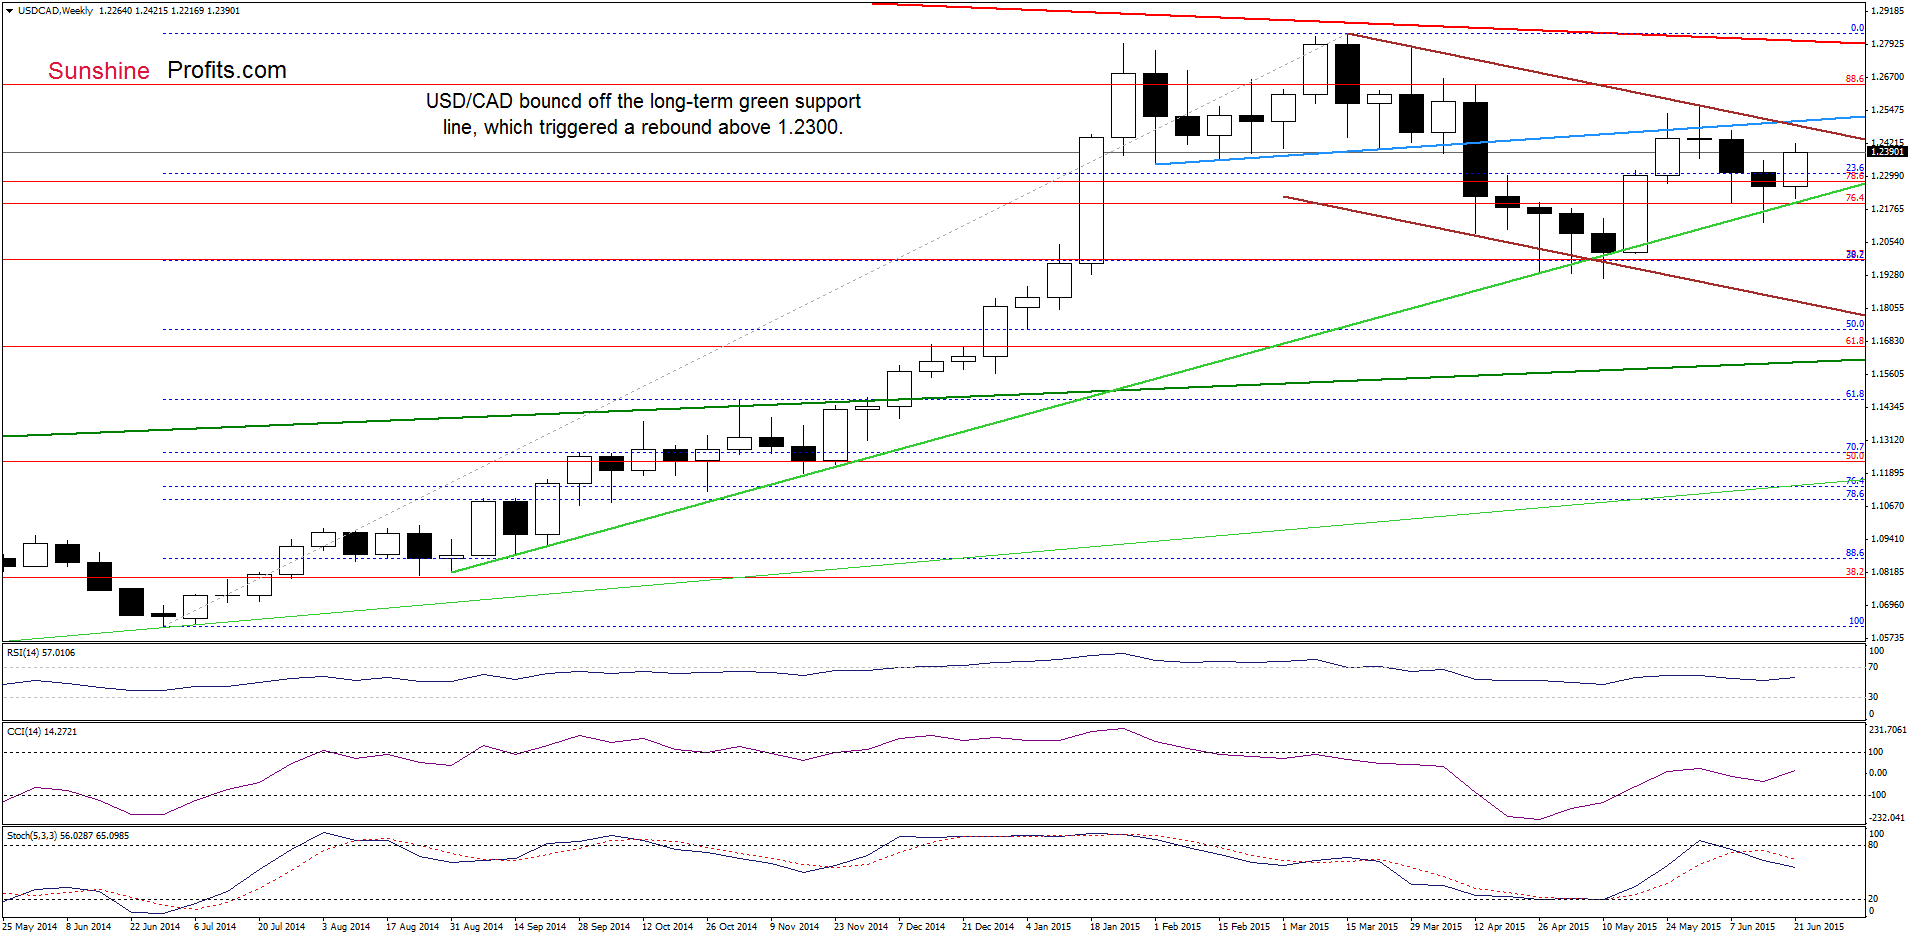
(…) although USD/CAD moved lower, the green support line continues to keep declines in check. (…) in the previous week, this long-term support triggered a rebound, which invalidated earlier small breakdown (similarly to what we saw in Apr and May). This is a positive fact, which suggests that higher values of the exchange rate are just around the corner
From today’s point of view we see that the situation developed in line with the above scenario and USD/CAD moved sharply higher in the recent days.
How did this rally affect the very short-term picture? Let’s check.
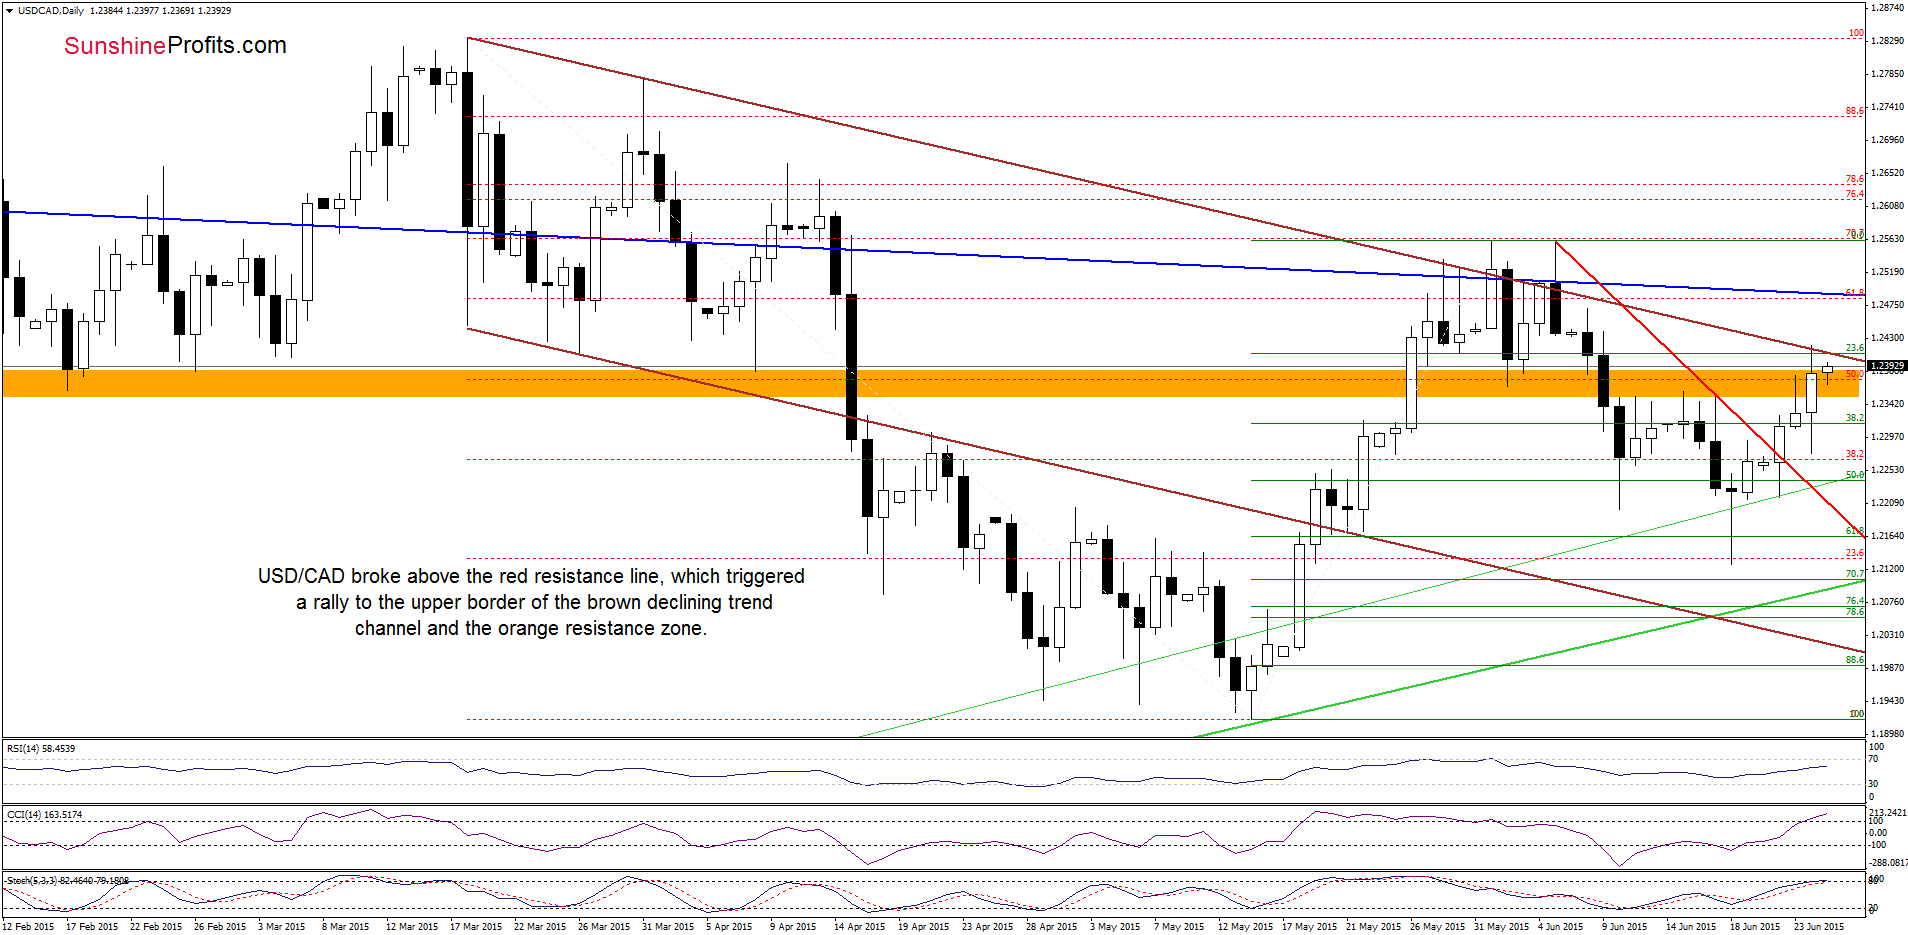
Looking at the daily chart we see that USD/CAD broke above the red resistance line (based on the Jun and Jun 17 highs), which encouraged currency bulls to act and resulted in an increase to the orange resistance zone and the upper border of the brown declining trend channel. At the beginning of the month this solid resistance line was strong enough to stop further rally and trigger a correction. Taking this fact into account, and combining it with the current position of the indicators (the CCI is overbought, while the Stochastic Oscillator climbed to the level of 80), it seems that a pullback from here is more likely than not. If we see such price action, the exchange rate will likely test the lower border of the resistance zone, which serves as the nearest support (around 1.2350-1.2360).
Very short-term outlook: mixed with bearish bias
Short-term outlook: mixed
MT outlook: mixed
LT outlook: mixed
Trading position (short-term; our opinion): No positions are justified from the risk/reward perspective at the moment. We will keep you informed should anything change, or should we see a confirmation/invalidation of the above.
USD/CHF
Quoting our Tuesday’s commentary:
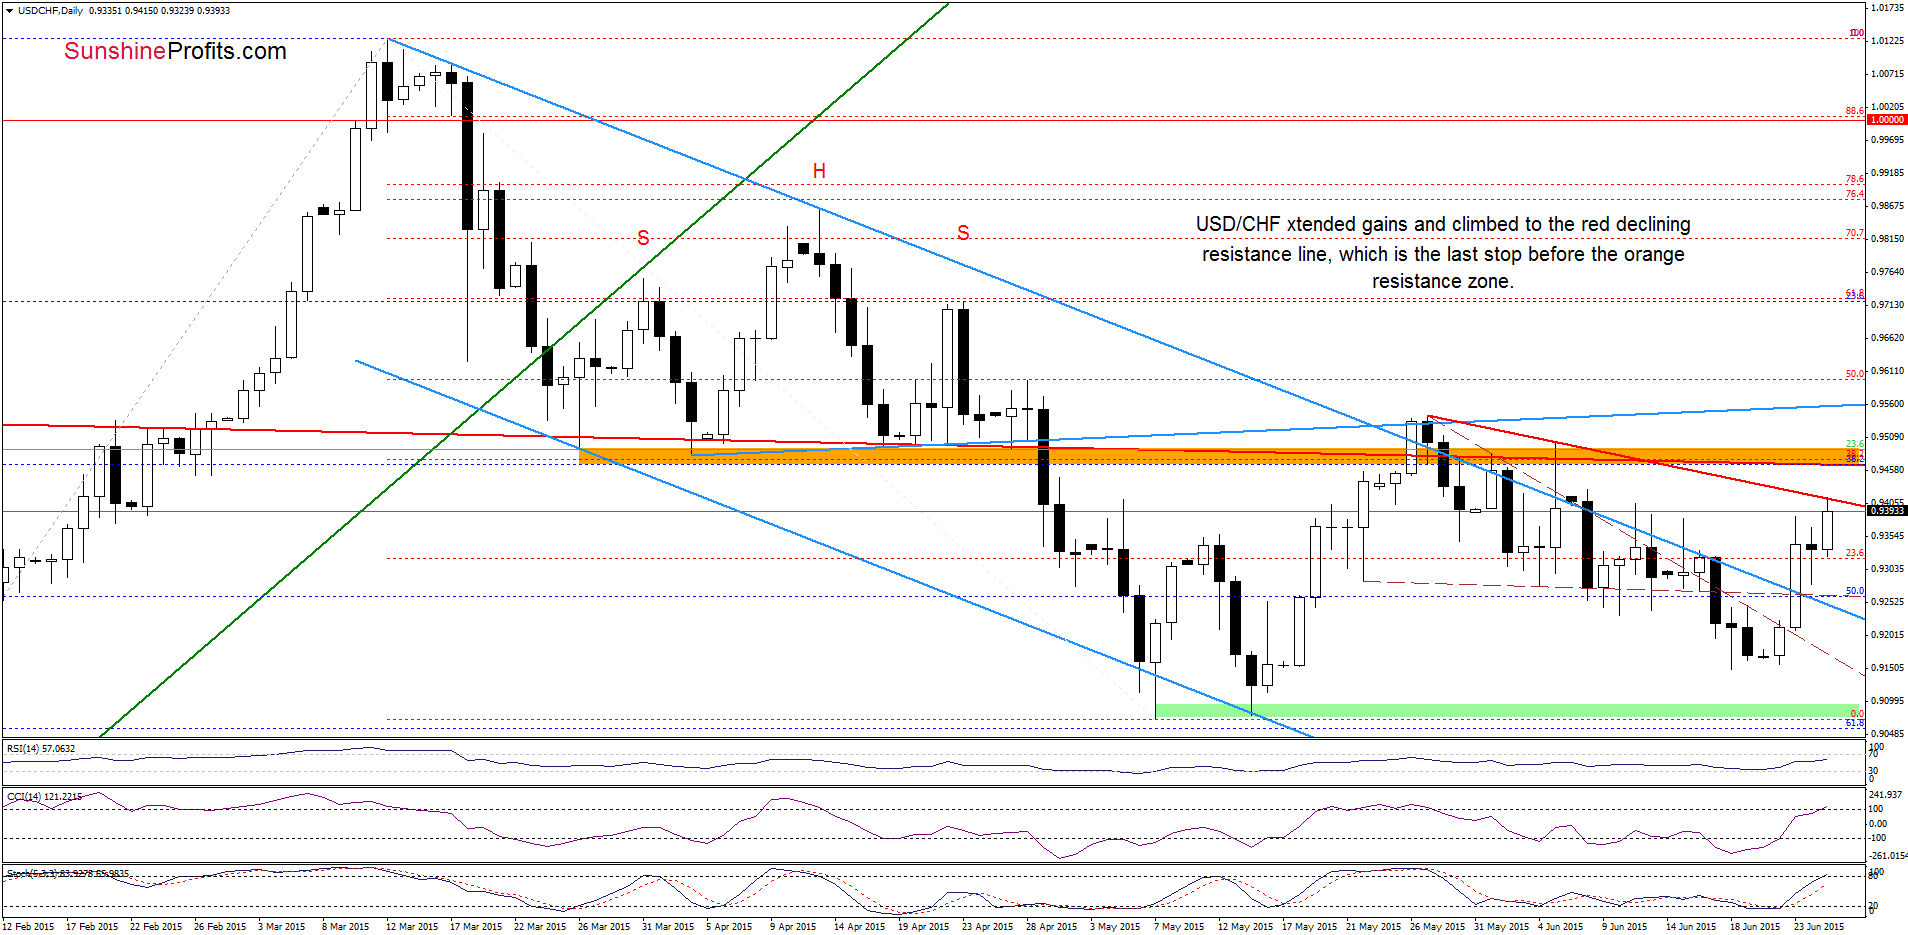
The first thing that catches the eye on the daily chart is a breakout above the upper border of the declining blue trend channel, the upper line of the brown triangle and the red dashed resistance line. This is a bullish signal, which suggests further improvement and a rally to (at least) the red resistance line based on the May 27 and June5 highs (especially when we take into account buy signals generated by the indicators).
As you see on the daily chart, USD/CHF moved sharply higher, reaching our upside target earlier today, which is a positive signal. Will we see a breakout? Looking at the current position of the indicators (buy signals supports the bullish case at the moment) it seems to us that higher values of the exchange rate are just around the corner.
Are there any medium-term factors that could support further improvement? Let’s examine the weekly chart and find out.
On Tuesday, we wrote:
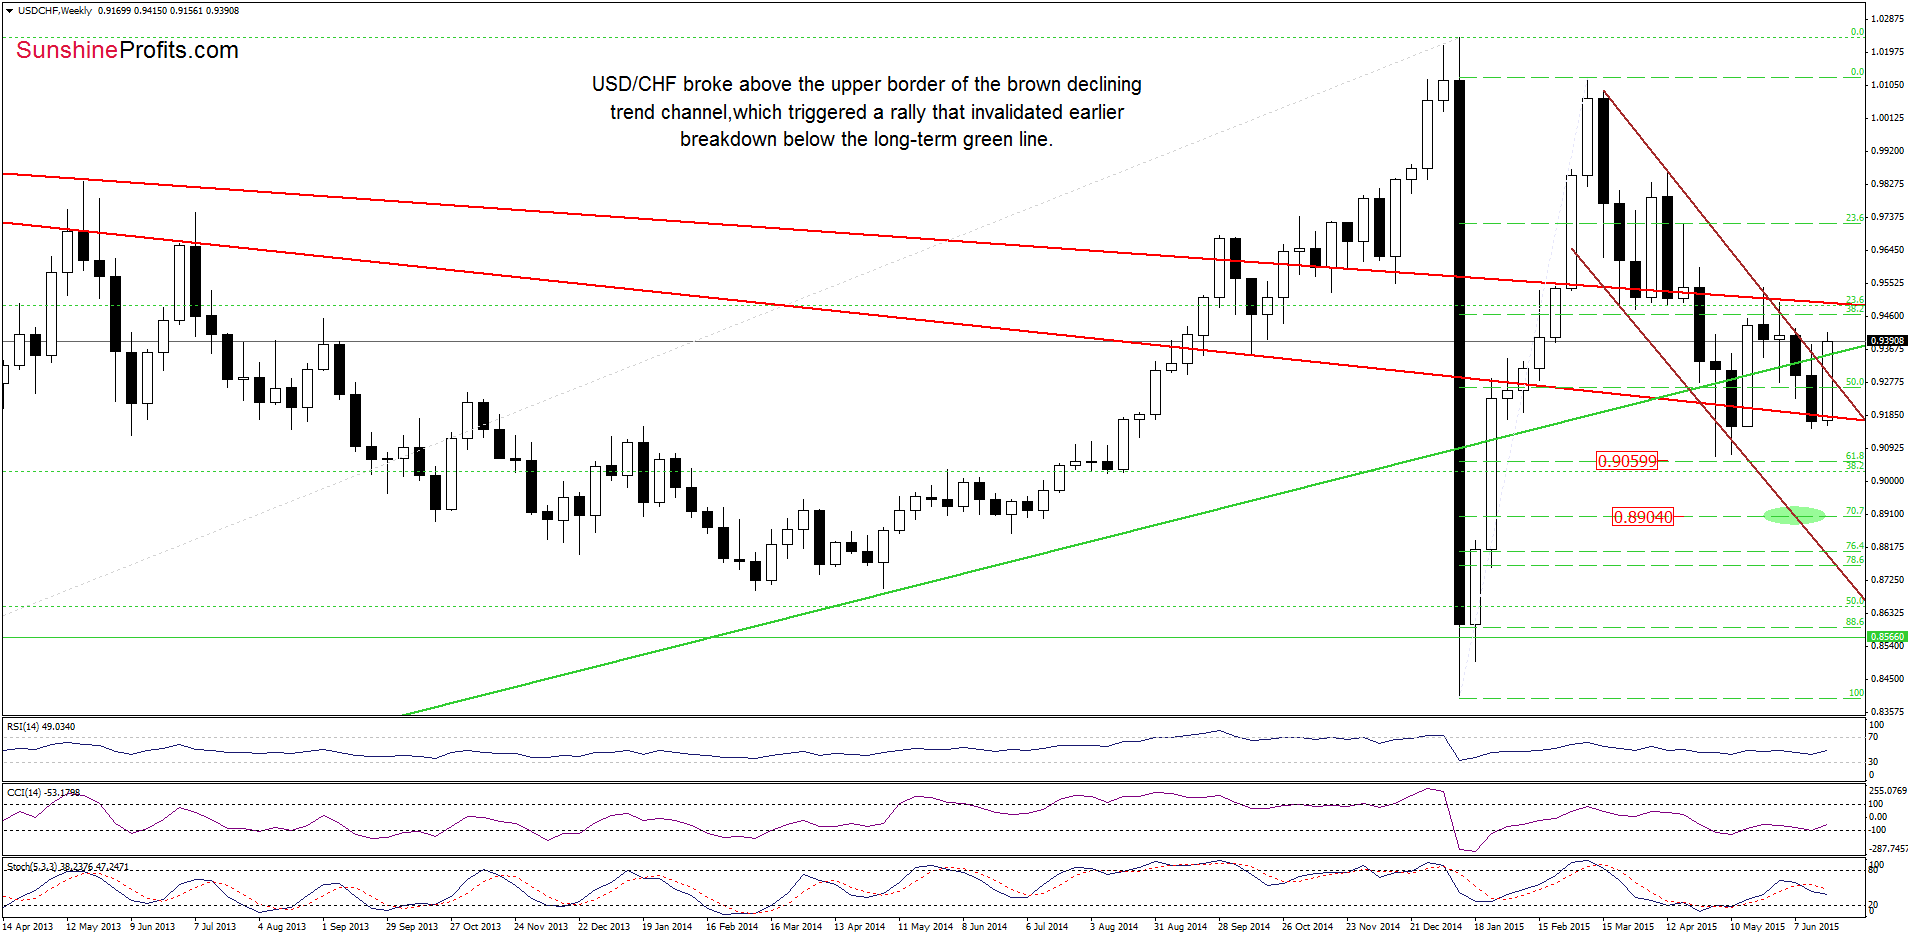
(…) USD/CHF invalidated earlier breakdown under the long-term red support line, which resulted in a sharp rebound and a climb to the upper border of the brown declining trend channel. (…) if currency bulls manage to break above it, it would be a strong positive signal, which will likely trigger a rally to the long-term red declining resistance line in the following week.
Looking at the weekly chart, we see that USD/CHF broke above the key resistance line, which triggered a rally that invalidated earlier breakdown below the long-term green line. This is a positive signal, which suggests that our upside target from the previous commentary will be in play in the coming days.
Very short-term outlook: bullish
Short-term outlook: bullish
MT outlook: mixed
LT outlook: mixed
Trading position (short-term; our opinion): No positions are justified from the risk/reward perspective at the moment. We will keep you informed should anything change, or should we see a confirmation/invalidation of the above.
Thank you.
Nadia Simmons
Forex & Oil Trading Strategist
Przemyslaw Radomski, CFA
Founder, Editor-in-chief
Gold & Silver Trading Alerts
Forex Trading Alerts
Oil Investment Updates
Oil Trading Alerts

