

Yesterday’s data, which showed that U.S. existing home sales rose by 5.1% (to the highest level since November 2009) continued to weight also today, supporting the greenback and pushing the USD Index above the level of 95. As a result, USD/CHF moved sharply higher and broke above 3 short-term resistance lines. Will we see further rally in the coming days?
In our opinion the following forex trading positions are justified - summary:
EUR/USD
Quoting our last alert:
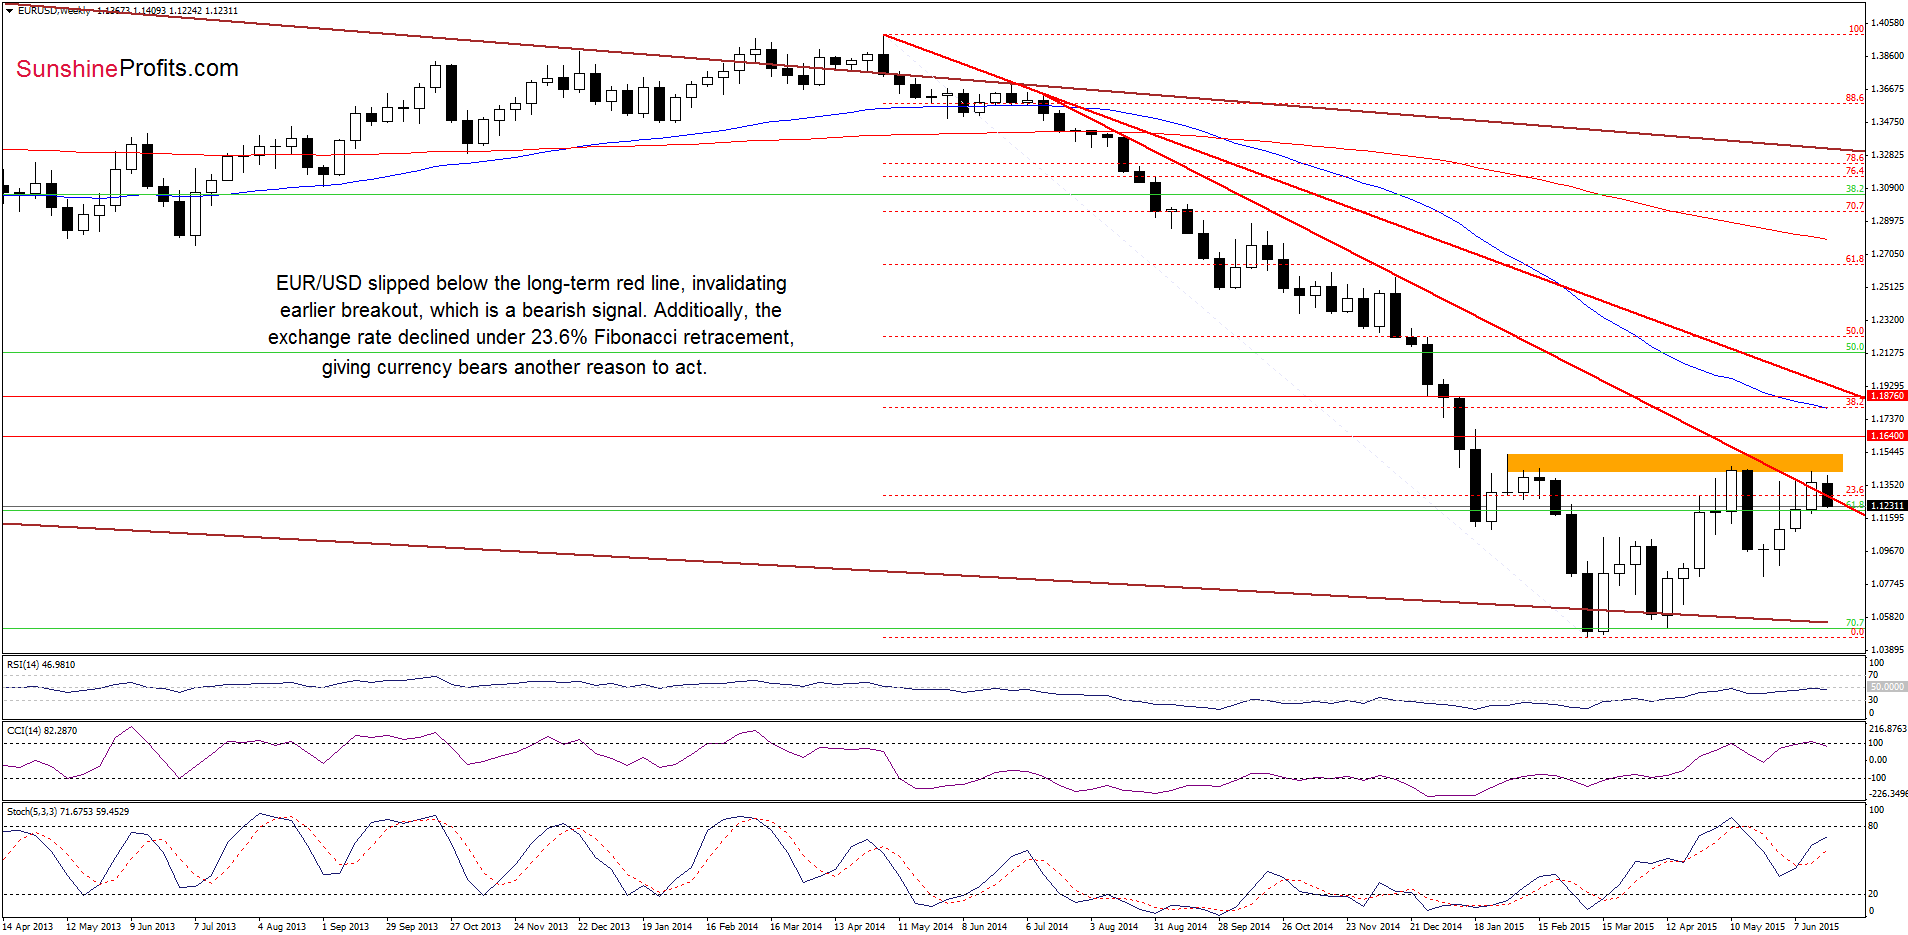
(…) we should keep in mind that as long as there is no successful breakout above the orange resistance zone further rally is not likely to be seen and another pullback should not surprise us.
On the weekly chart, we see that the situation developed n line with the above scenario and EUR/USD moved sharply lower. With this downswing, the exchange rate invalidated the breakout above the long-term red declining line and the 23.6% Fibonacci retracement, which is a bearish signal that suggests further deterioration in the coming week. Additionally, the CCI generated a sell signal, supporting the bearish case.
How did this drop affect the very short-term picture? Let’s examine the daily chart and find out.
Yesterday, we wrote the following:
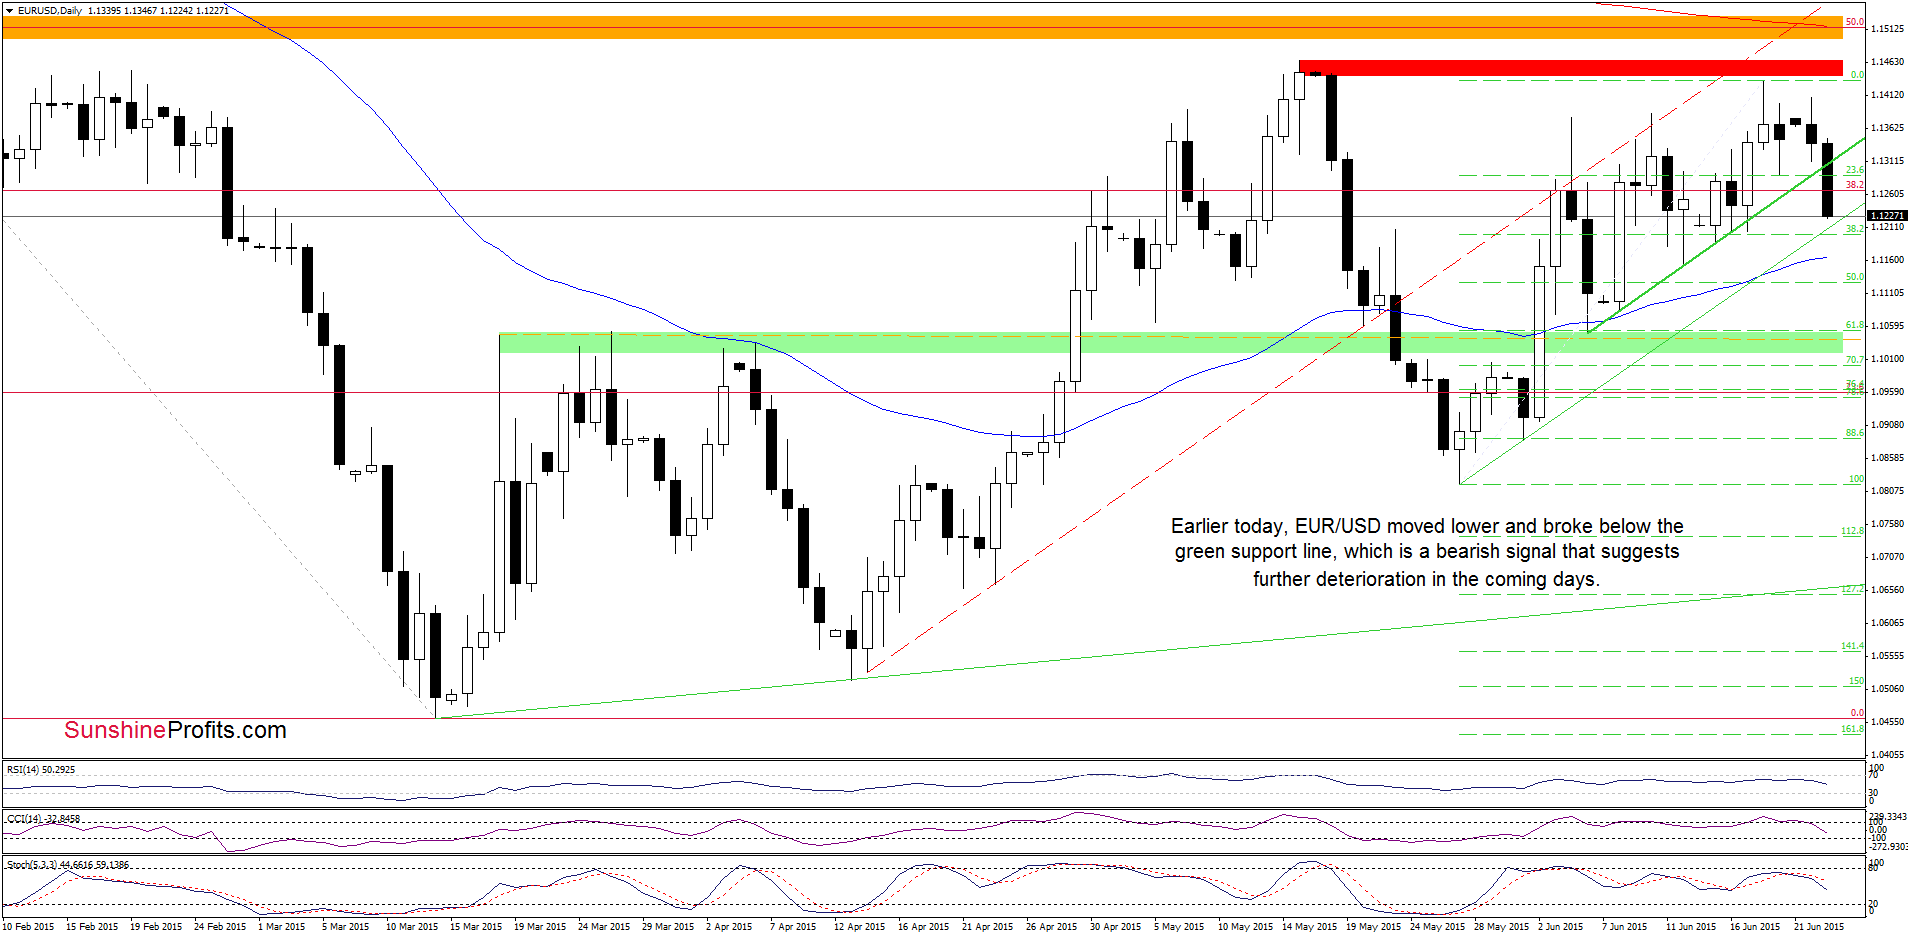
(…) the CCI and Stochastic Oscillator are very close to generating sell signals, which suggests that reversal is just around the corner.
From the daily perspective, we see that currency bears pushed EUR/USD sharply lower as we expected. With this downswing, the exchange rate broke below the green support line, which is a negative sign that suggests further declines in the coming day(s). If this is the case, and the pair extends drops, the initial downside target would be around 1.1204, where the next green support line (created by the May and Jun lows) and the 38.2% Fibonacci retracement (based on the entire May-mid-Jun rally) are. If this solid support is broken, we could see a decline to 1.1124 (the 50% retracement) or even to the green support zone (created by the mid-Mar and Apr highs and reinforced by the 61.8% Fibonacci retracement).
Very short-term outlook: bearish
Short-term outlook: mixed
MT outlook: mixed
LT outlook: mixed
Trading position (short-term; our opinion): No positions are justified from the risk/reward perspective at the moment. We will keep you informed should anything change, or should we see a confirmation/invalidation of the above.
USD/JPY
The situation in the medium term hasn’t changed much as USD/JPY is trading in a narrow range between the green support zone (created by the previously-broken 76.4% and 78.6% Fibonacci retracement levels) and the previously-broken June 2007 high.
Will the very short-term picture give us more clues about future moves? Let’s check.
Quoting our last commentary on this currency pair:
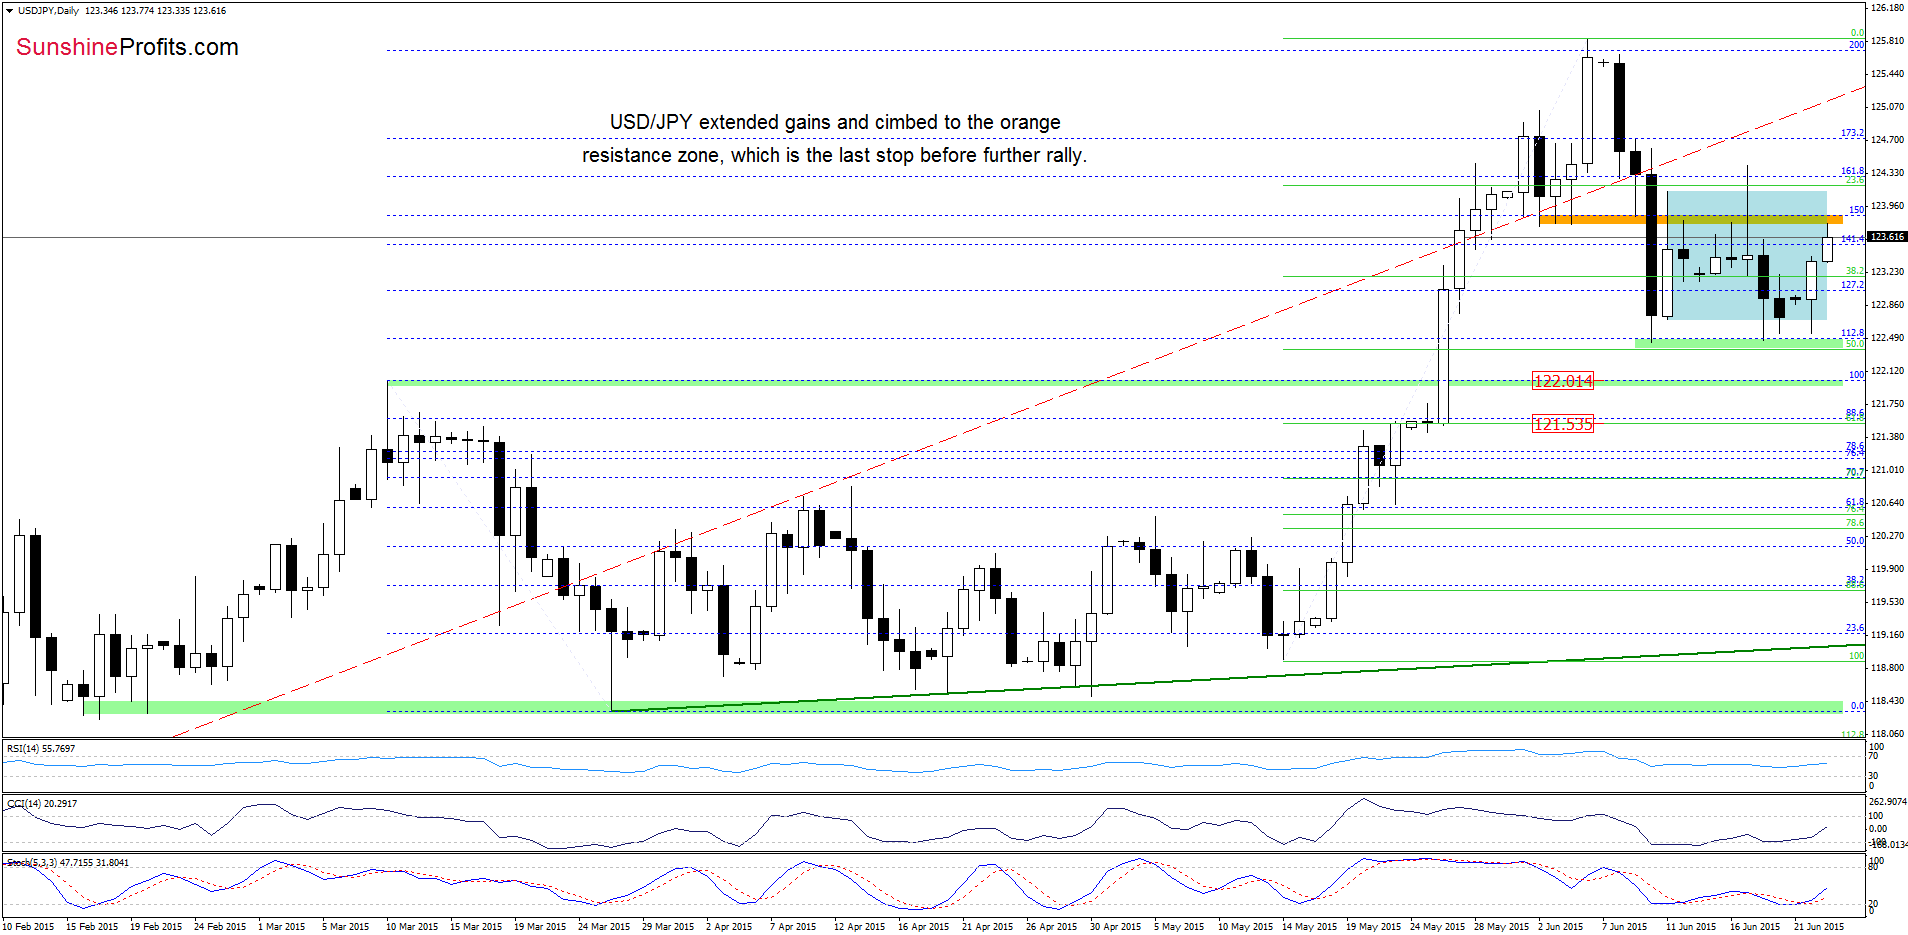
(…) the Jun low (…) withstood the selling pressure, which resulted in a rebound and an invalidation of the breakdown below the lower border of the consolidation. This is a positive signal, which suggests further improvement and an increase to the orange resistance zone in the coming days.
Looking at the daily chart, we see that currency bears realized the above scenario and pushed USD/JPY to our upside target earlier today. In the previous weeks, this solid resistance area was strong enough to stop further improvement and trigger declines, which suggests that we could see similar price action in the coming day. Nevertheless, buy signals generated by the indicators suggest that currency bulls will try to push the pair higher in the near future (especially when we factor in a triple bottom formation created by the recent lows). However, in our opinion, further rally will be more likely (and reliable) if we see a daily close above this zone.
Very short-term outlook: mixed with bullish bias
Short-term outlook: mixed
MT outlook: mixed
LT outlook: bullish
Trading position (short-term; our opinion): No positions are justified from the risk/reward perspective at the moment. We will keep you informed should anything change, or should we see a confirmation/invalidation of the above.
USD/CHF
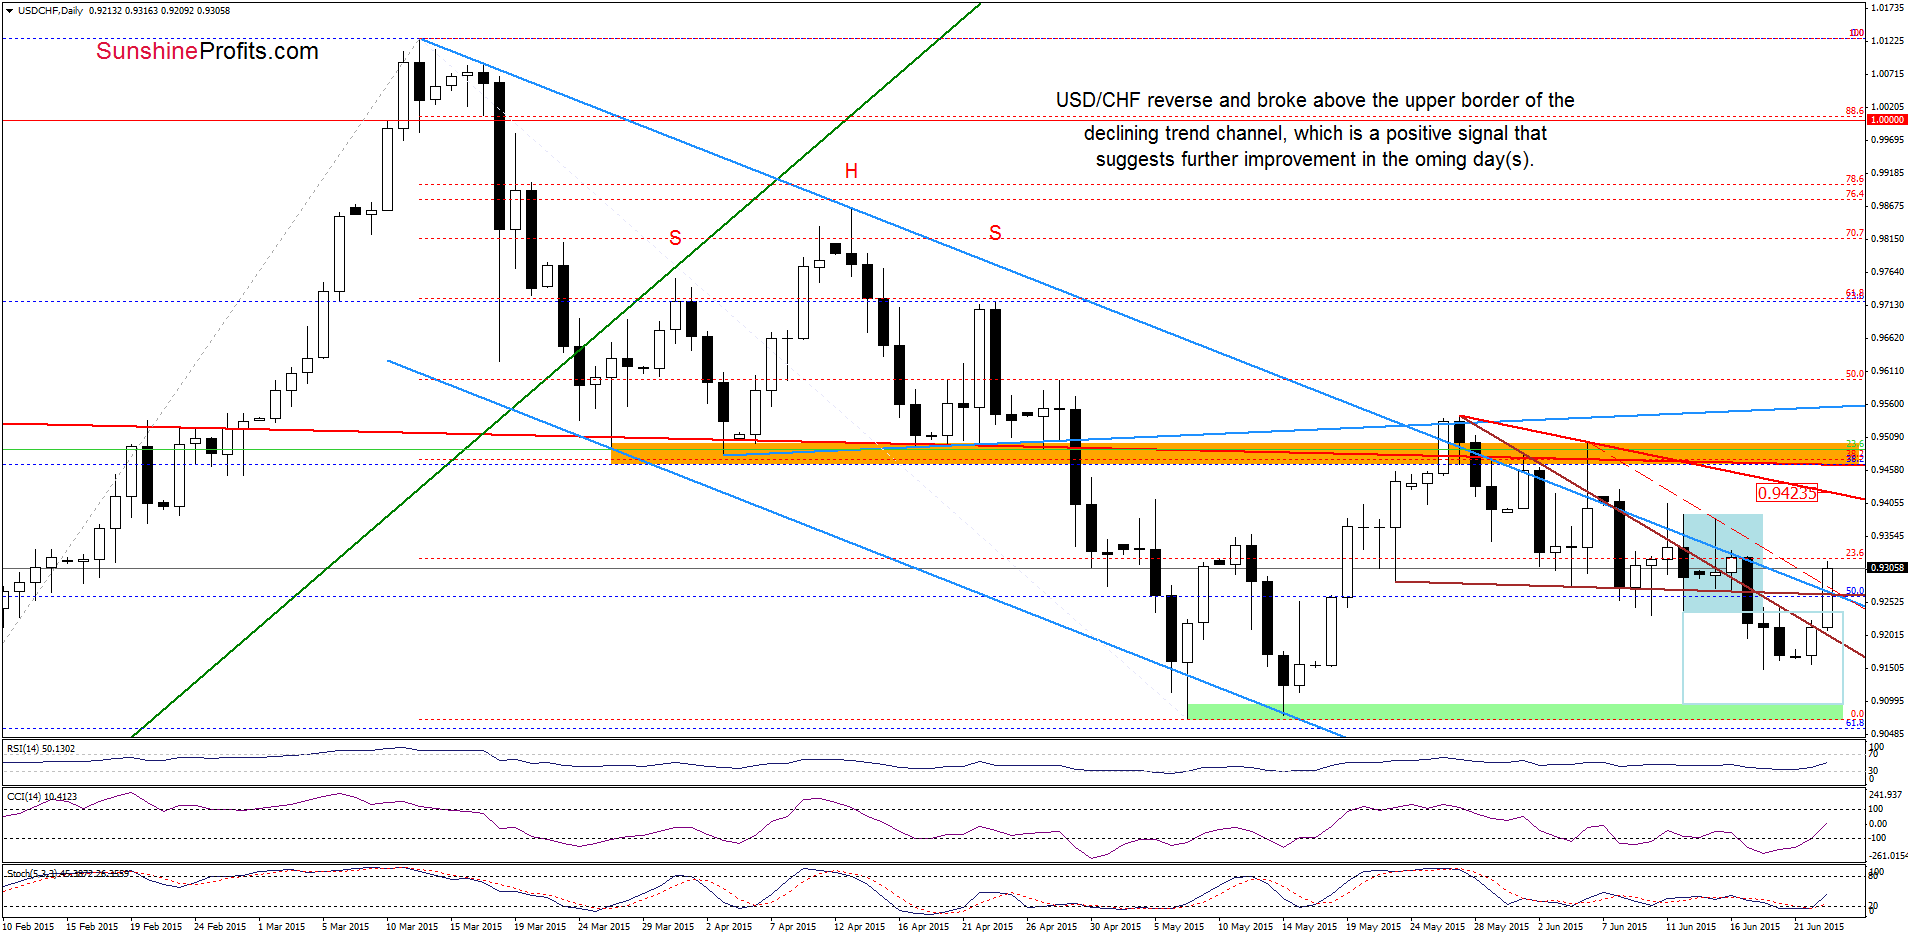
The first thing that catches the eye on the daily chart is a breakout above the upper border of the declining blue trend channel, the upper line of the brown triangle and the red dashed resistance line. This is a bullish signal, which suggests further improvement and a rally to (at least) the red resistance line based on the May 27 and June5 highs (especially when we take into account buy signals generated by the indicators).
Are there any medium-term factors that could hinder the realization of the above scenario? Let’s find out.
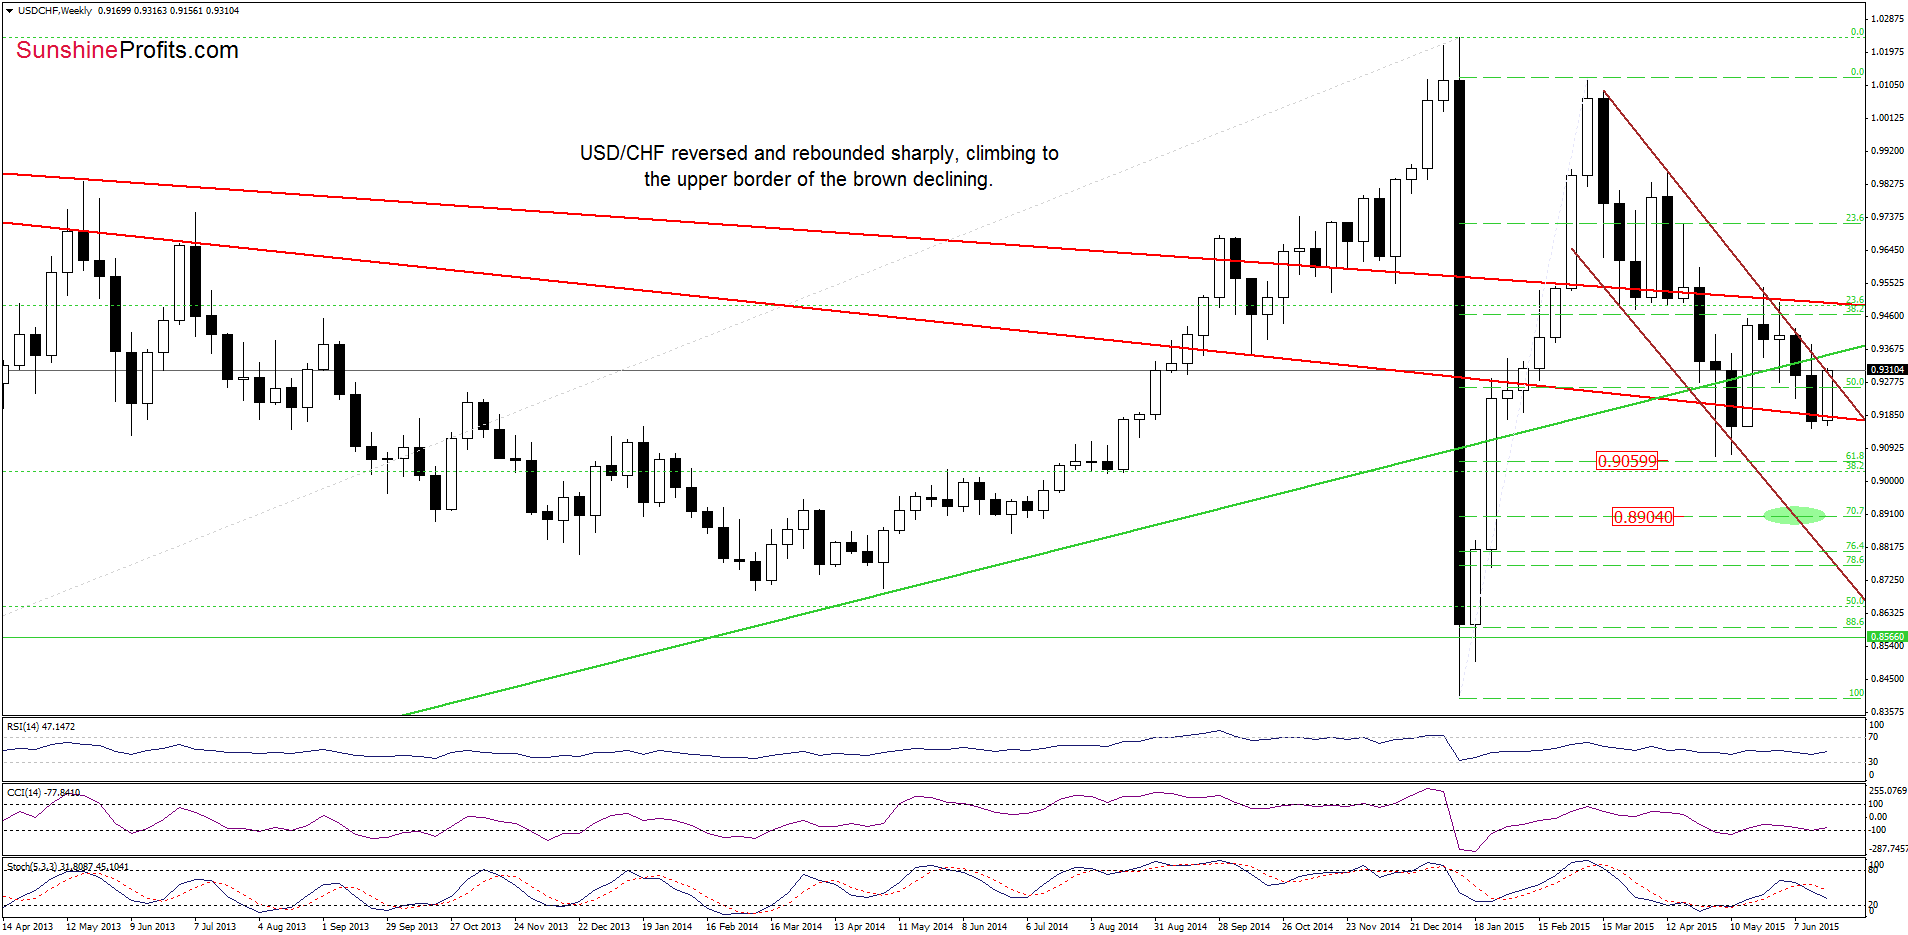
As you see on the above chart USD/CHF invalidated earlier breakdown under the long-term red support line, which resulted in a sharp rebound and a climb to the upper border of the brown declining trend channel. In the previous weeks, this strong resistance has triggered several downswings, which clearly means that as long as there is no successful breakout above this major line, further rally is not likely to be seen. However, if currency bulls manage to break above it, it would be a strong positive signal, which will likely trigger a rally to the long-term red declining resistance line in the following week.
Very short-term outlook: bullish
Short-term outlook: mixed with bullish bias
MT outlook: mixed
LT outlook: mixed
Trading position (short-term; our opinion): No positions are justified from the risk/reward perspective at the moment. We will keep you informed should anything change, or should we see a confirmation/invalidation of the above.
Thank you.
Nadia Simmons
Forex & Oil Trading Strategist
Przemyslaw Radomski, CFA
Founder, Editor-in-chief
Gold & Silver Trading Alerts
Forex Trading Alerts
Oil Investment Updates
Oil Trading Alerts

