

Although EUR/USD moved sharply lower earlier today, the exchange rate reversed as the Greek government submitted a new package of economic reforms to its creditors, indicating that it is prepared to make concessions to break a deadlock to unlock bailout funds. As a result, the common currency bounced off the short-term support and climbed above 1.1400. Will we see further improvement in the coming week?
In our opinion the following forex trading positions are justified - summary:
EUR/USD
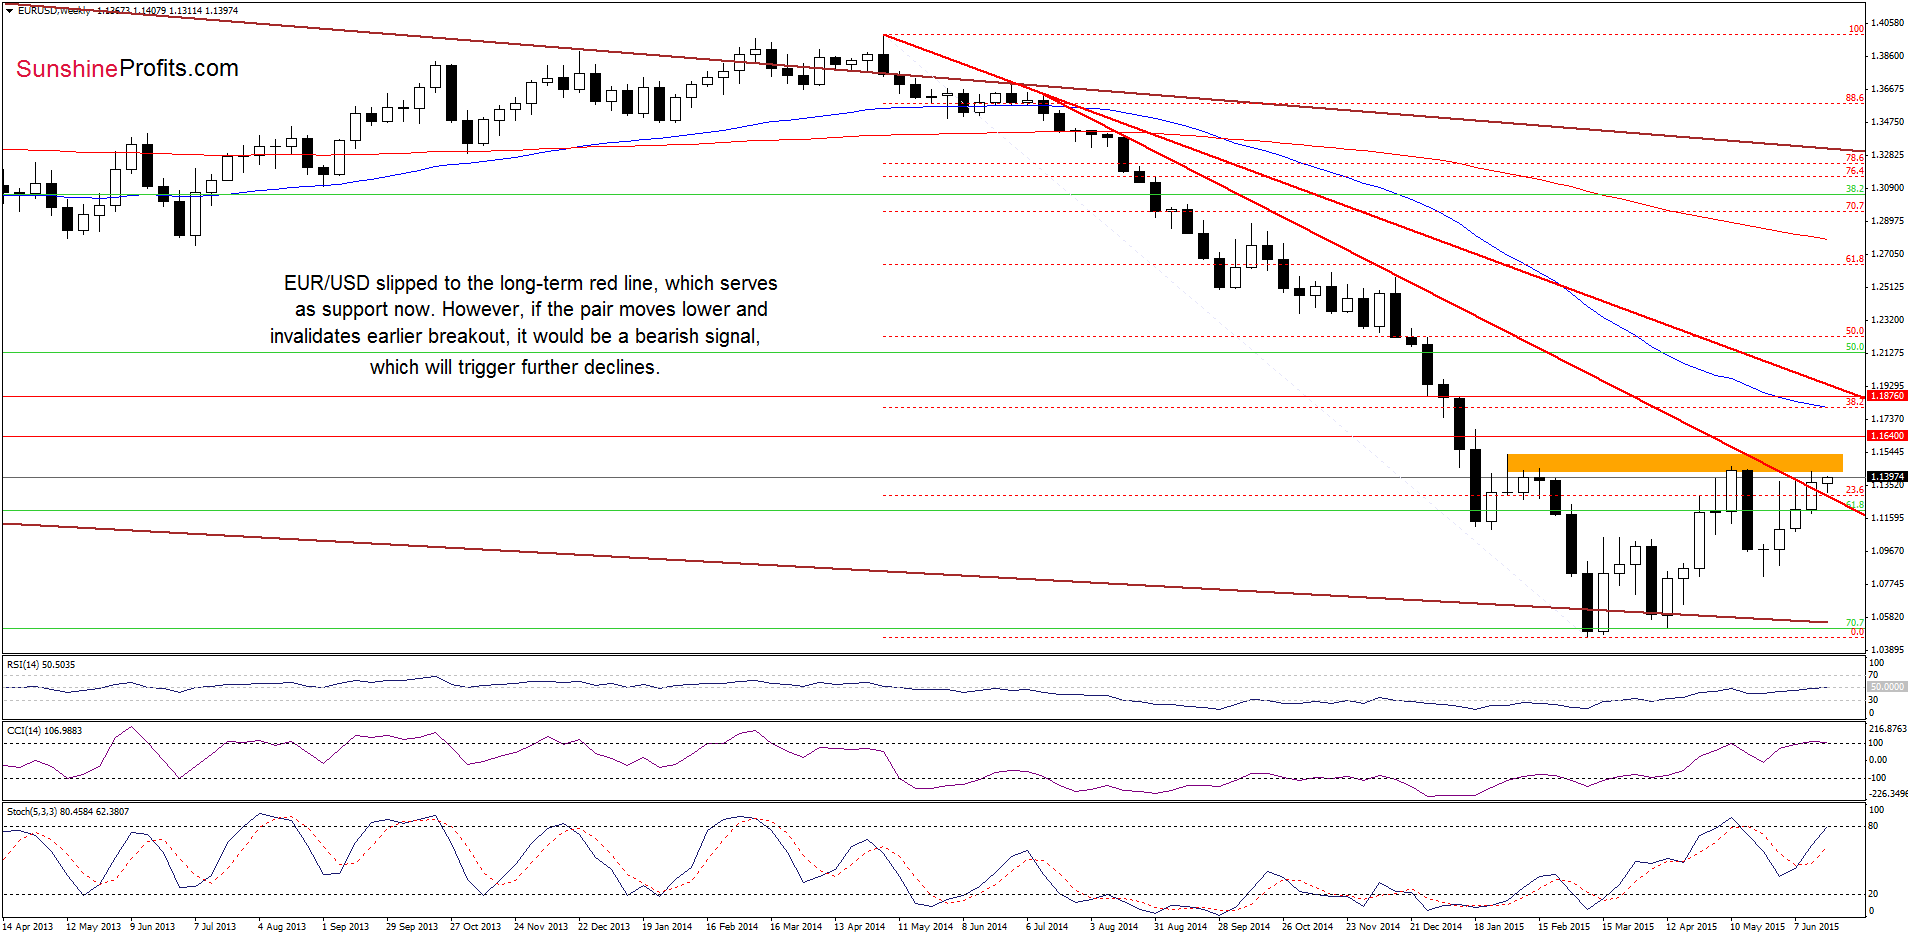
Looking at the weekly chart we see that although EUR/USD slipped to the long-term red declining line, this support withstood the selling pressure and triggered a rebound. Although this is a positive signal that suggests further improvement, we should keep in mind that as long as there is no successful breakout above the orange resistance zone further rally is not likely to be seen and another pullback should not surprise us.
Are there any short-term factors that could encourage currency bears to act? Let’s examine the daily chart and find out.
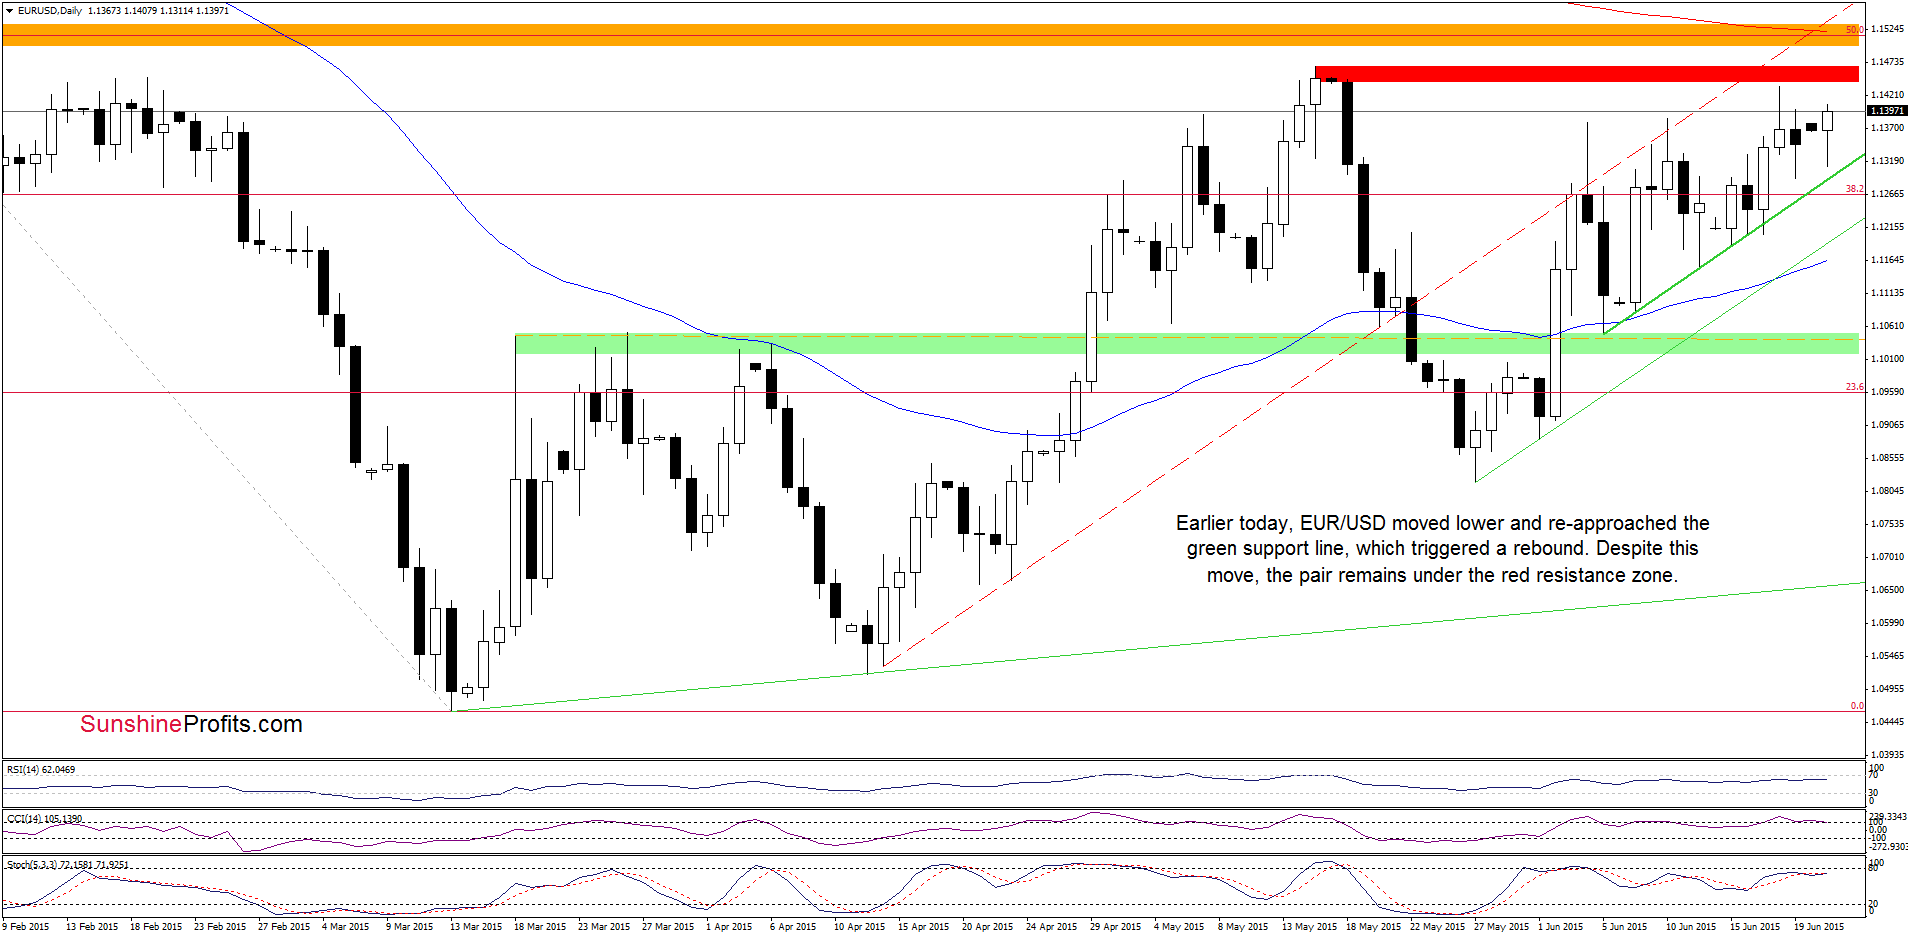
From this perspective, we see that EUR/USD moved lower and re-approached the green line earlier today. Despite this deterioration, the support line encouraged currency bulls to act, which resulted in a rebound that took the exchange rate above the Friday’s high. This is a positive signal, which suggests that we could see a test of the last week’s high in the coming day(s). Nevertheless, we should keep in mind that the CCI and Stochastic Oscillator are very close to generating sell signals, which suggests that reversal is just around the corner.
Very short-term outlook: mixed with bearish bias
Short-term outlook: mixed
MT outlook: mixed
LT outlook: mixed
Trading position (short-term; our opinion): No positions are justified from the risk/reward perspective at the moment. We will keep you informed should anything change, or should we see a confirmation/invalidation of the above.
GBP/USD
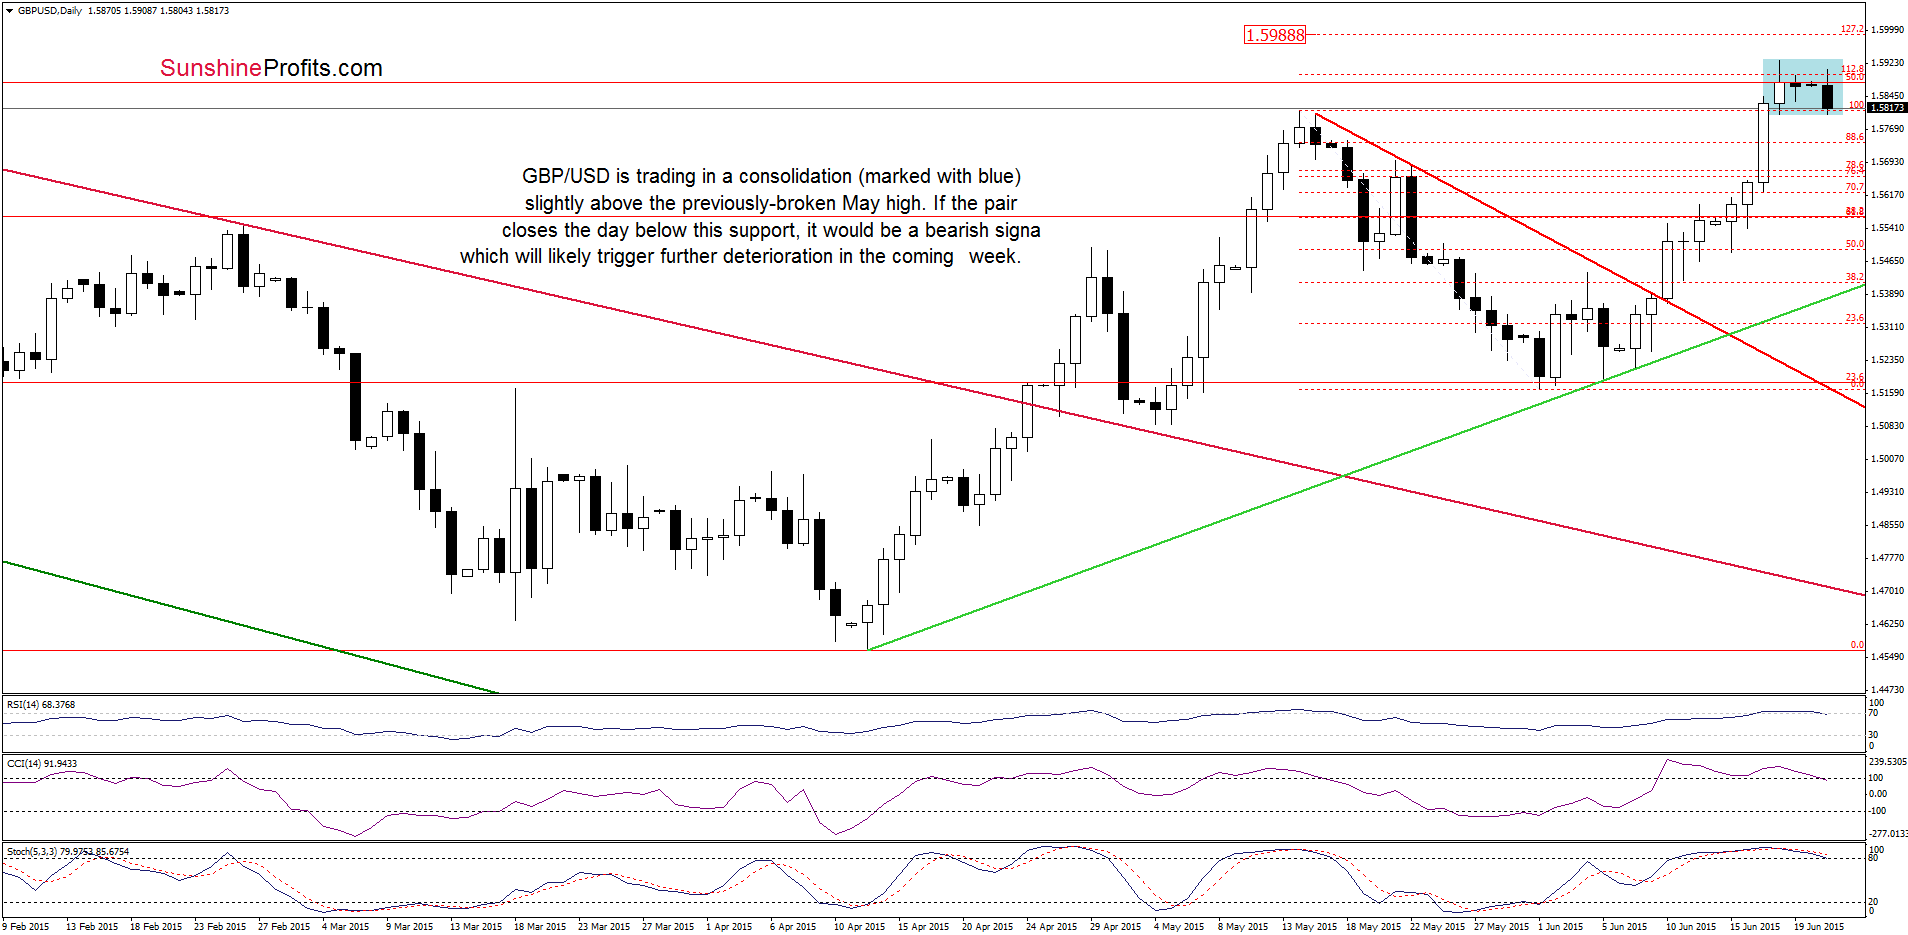
On the daily chart, we see that GBP/USD is trading in a consolidation (marked with blue) slightly above the previously-broken May high. Although the pair could go north or south from here, the current position of the indicators suggests that the next move will be to the downside (the CCI and Stochastic Oscillator generated sell signals). Nevertheless, in our opinion, such price action will be more likely (and reliable) if we see a daily close below the support level created by the May high of 1.5813.
Can we infer something more from the weekly chart? Let’s check.
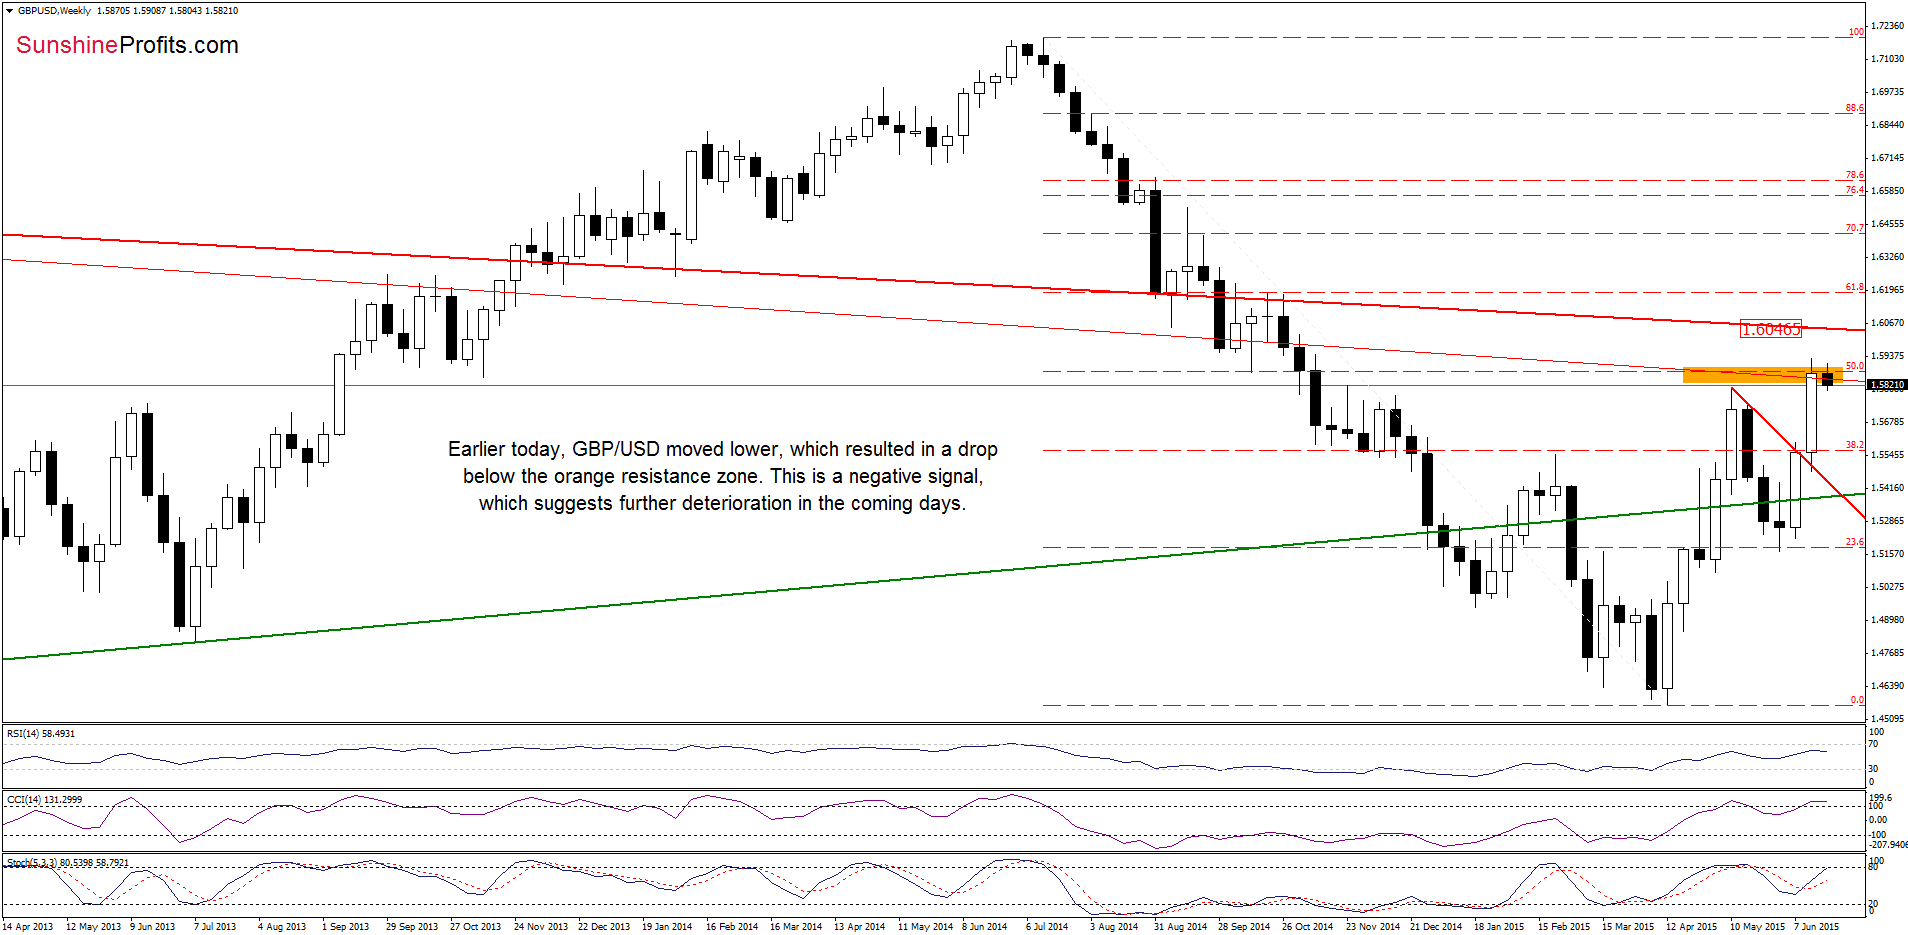
The first thing that catches the eye on the weekly chart is an invalidation of the breakout above the orange resistance zone (created by the 50% Fibonacci retracement and the red resistance line based on the previous highs), which suggests that if currency bulls do not push the pair higher in the coming day, further deterioration should not surprise us.
Very short-term outlook: mixed with bearish bias
Short-term outlook: mixed with bearish bias
MT outlook: mixed
LT outlook: mixed
Trading position (short-term; our opinion): No positions are justified from the risk/reward perspective at the moment. We will keep you informed should anything change, or should we see a confirmation/invalidation of the above.
USD/CAD
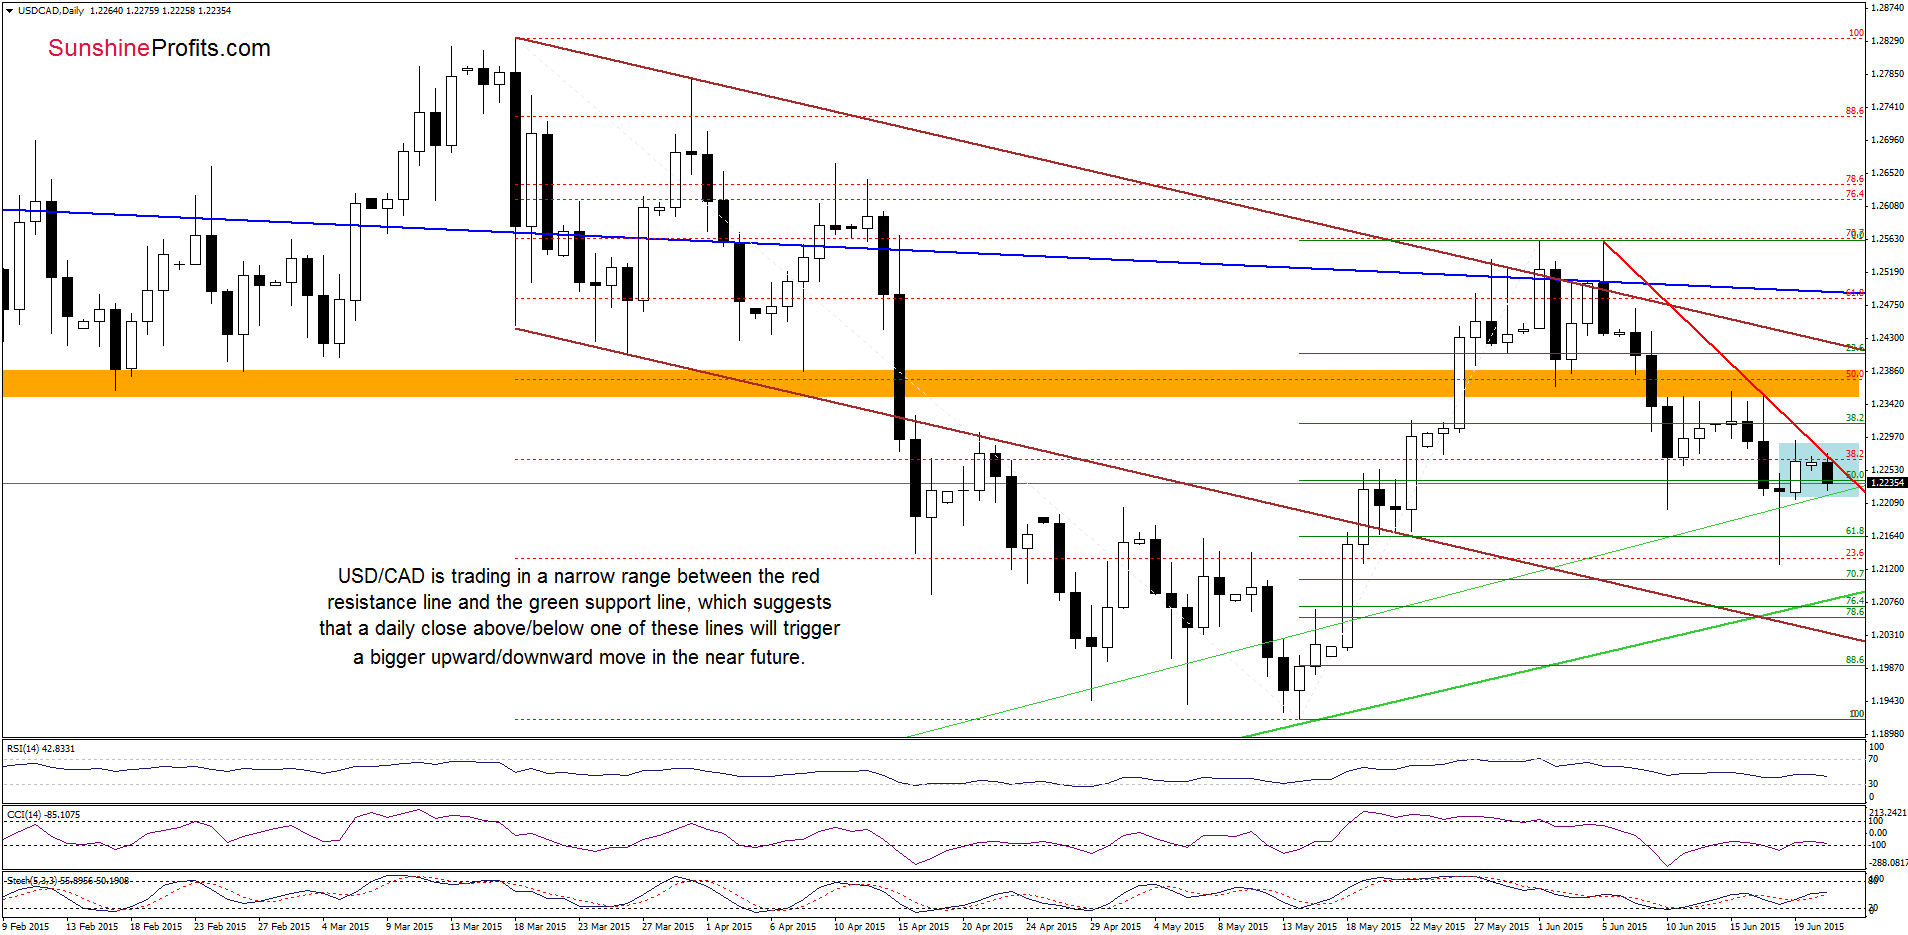
Looking at the daily chart we see that USD/CAD is trading in a narrow range between the red resistance (based on the Jun and Jun 17 highs) and the green support lines. This means that a daily close above/below one of these lines will trigger a bigger upward/downward move in the near future.
Will the weekly chart give us more clues about future moves? Let’s check.
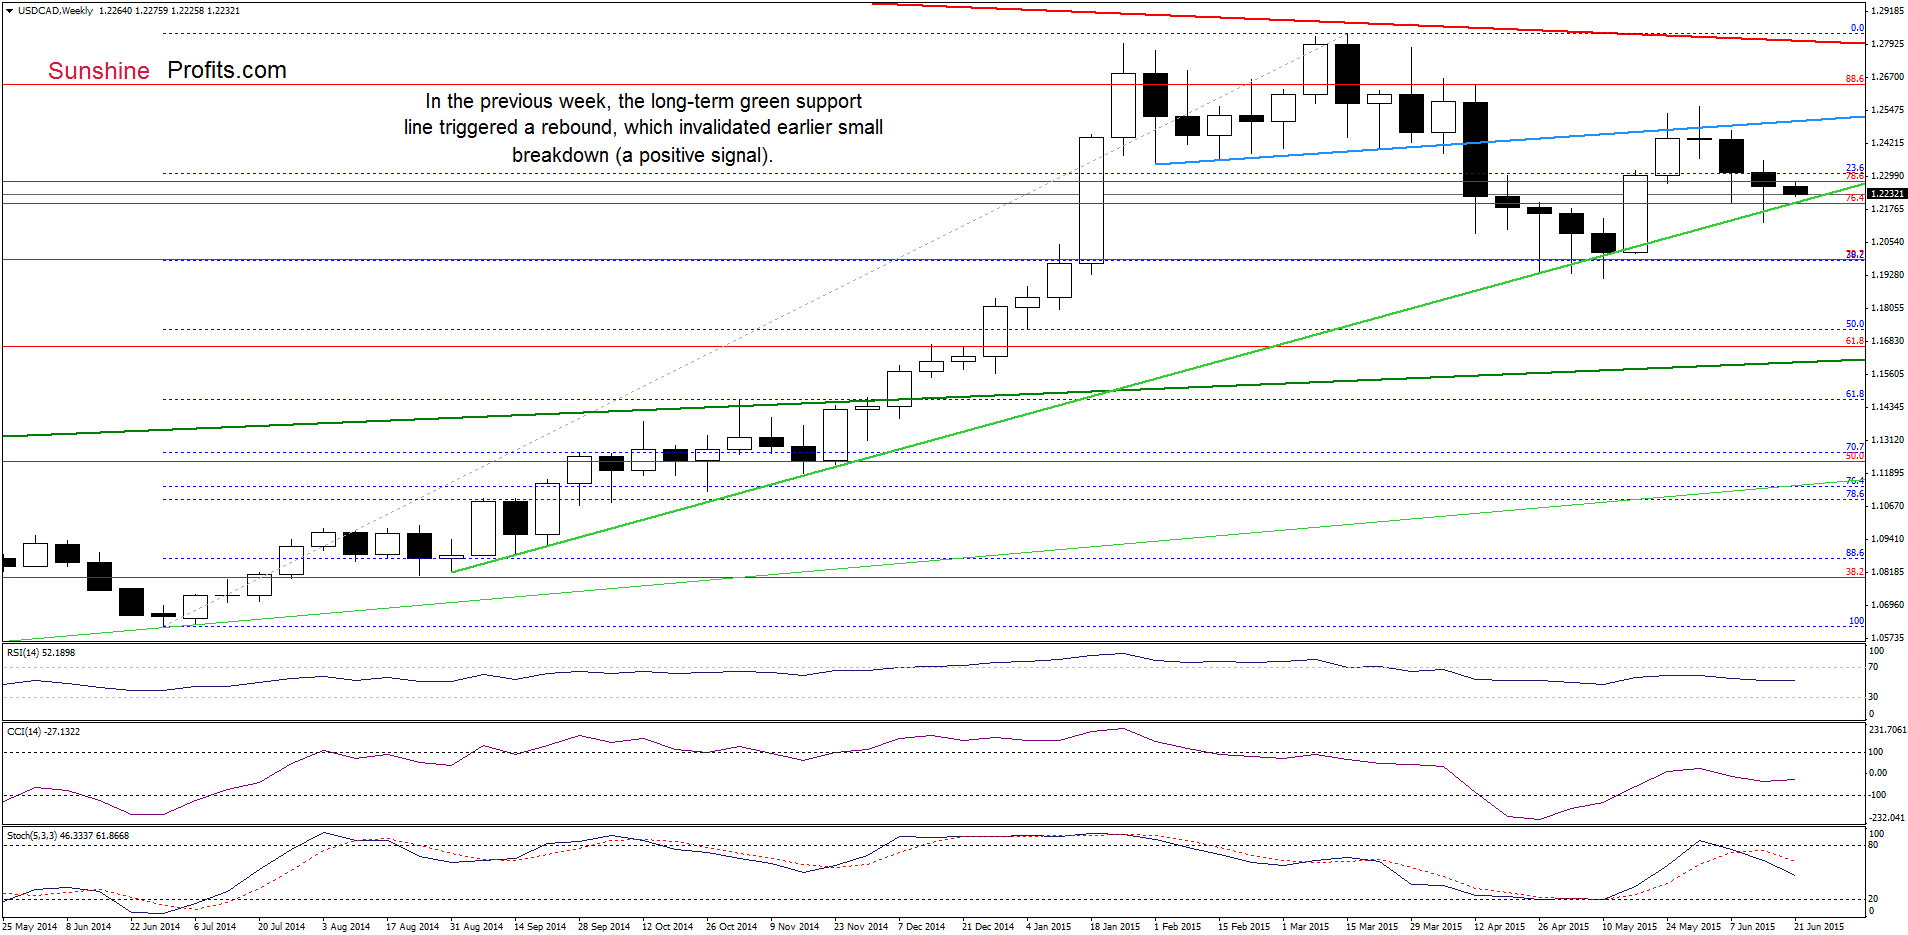
From today’s point of view we see that although USD/CAD moved lower, the green support line continues to keep declines in check. As you see on the above chart, in the previous week, this long-term support triggered a rebound, which invalidated earlier small breakdown (similarly to what we saw in Apr and May). This is a positive fact, which suggests that higher values of the exchange rate are just around the corner (especially when we factor in buy signals generated by the daily indicators).
Very short-term outlook: mixed with bullish bias
Short-term outlook: mixed
MT outlook: mixed
LT outlook: mixed
Trading position (short-term; our opinion): No positions are justified from the risk/reward perspective at the moment. We will keep you informed should anything change, or should we see a confirmation/invalidation of the above.
Thank you.
Nadia Simmons
Forex & Oil Trading Strategist
Przemyslaw Radomski, CFA
Founder, Editor-in-chief
Gold & Silver Trading Alerts
Forex Trading Alerts
Oil Investment Updates
Oil Trading Alerts

