

Although USD Index moved sharply lower after Wednesday’s FED statement and extended losses on the following day, hitting a monthly low against the basket of major currencies, the greenback reversed after solid job data, which showed that that initial jobless claims fell by 12,000. Earlier today, the Bank of Japan left its monetary policy unchanged, which resulted in further improvement in USD/JPY. Will we see a post double-bottom rally in the coming week?
In our opinion the following forex trading positions are justified - summary:
EUR/USD
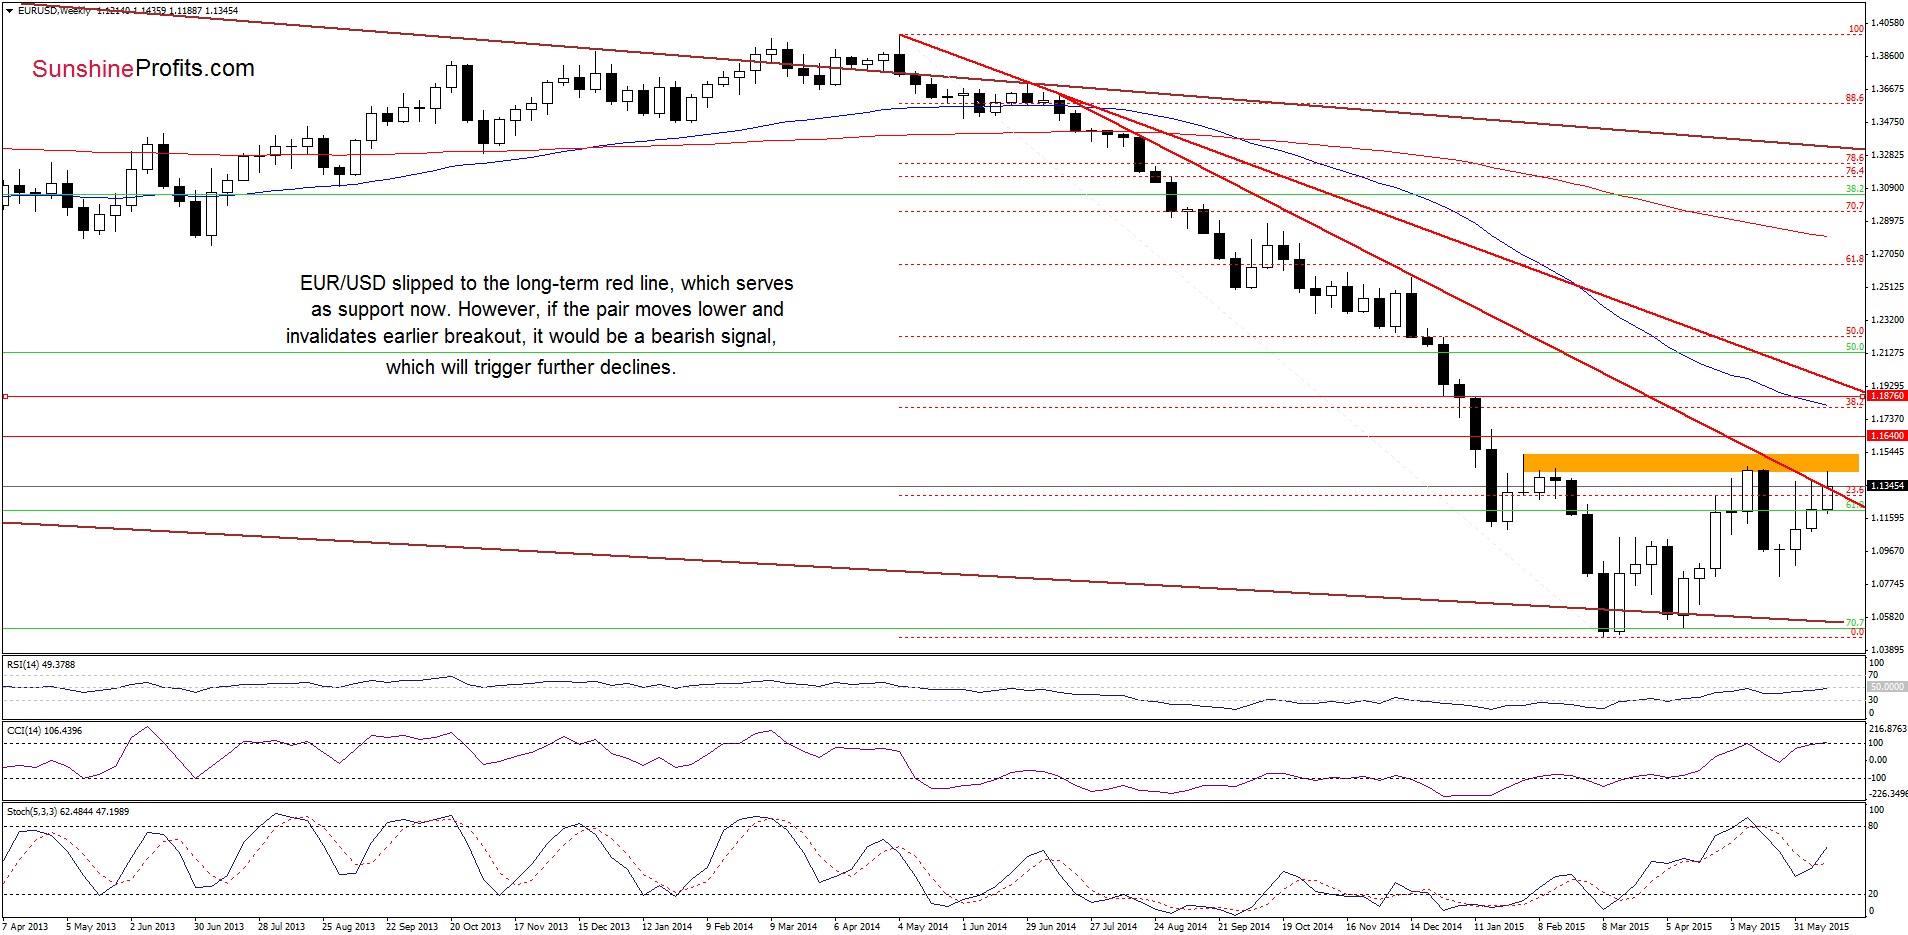
Looking at the weekly chart we see that the proximity to the orange resistance zone stopped further improvement, triggering a pullback. With this downswing, EUR/USD slipped to the long-term red declining line, which serves as support now. If the pair extends losses and closes the week under this line, it would be a bearish signal, which will likely result in a breakdown below the 23.6% Fibonacci retracement and trigger further deterioration in the coming week.
Are there any short-term factors that could encourage currency bears to act? Let’s examine the daily chart and find out.
Yesterday, we wrote the following:
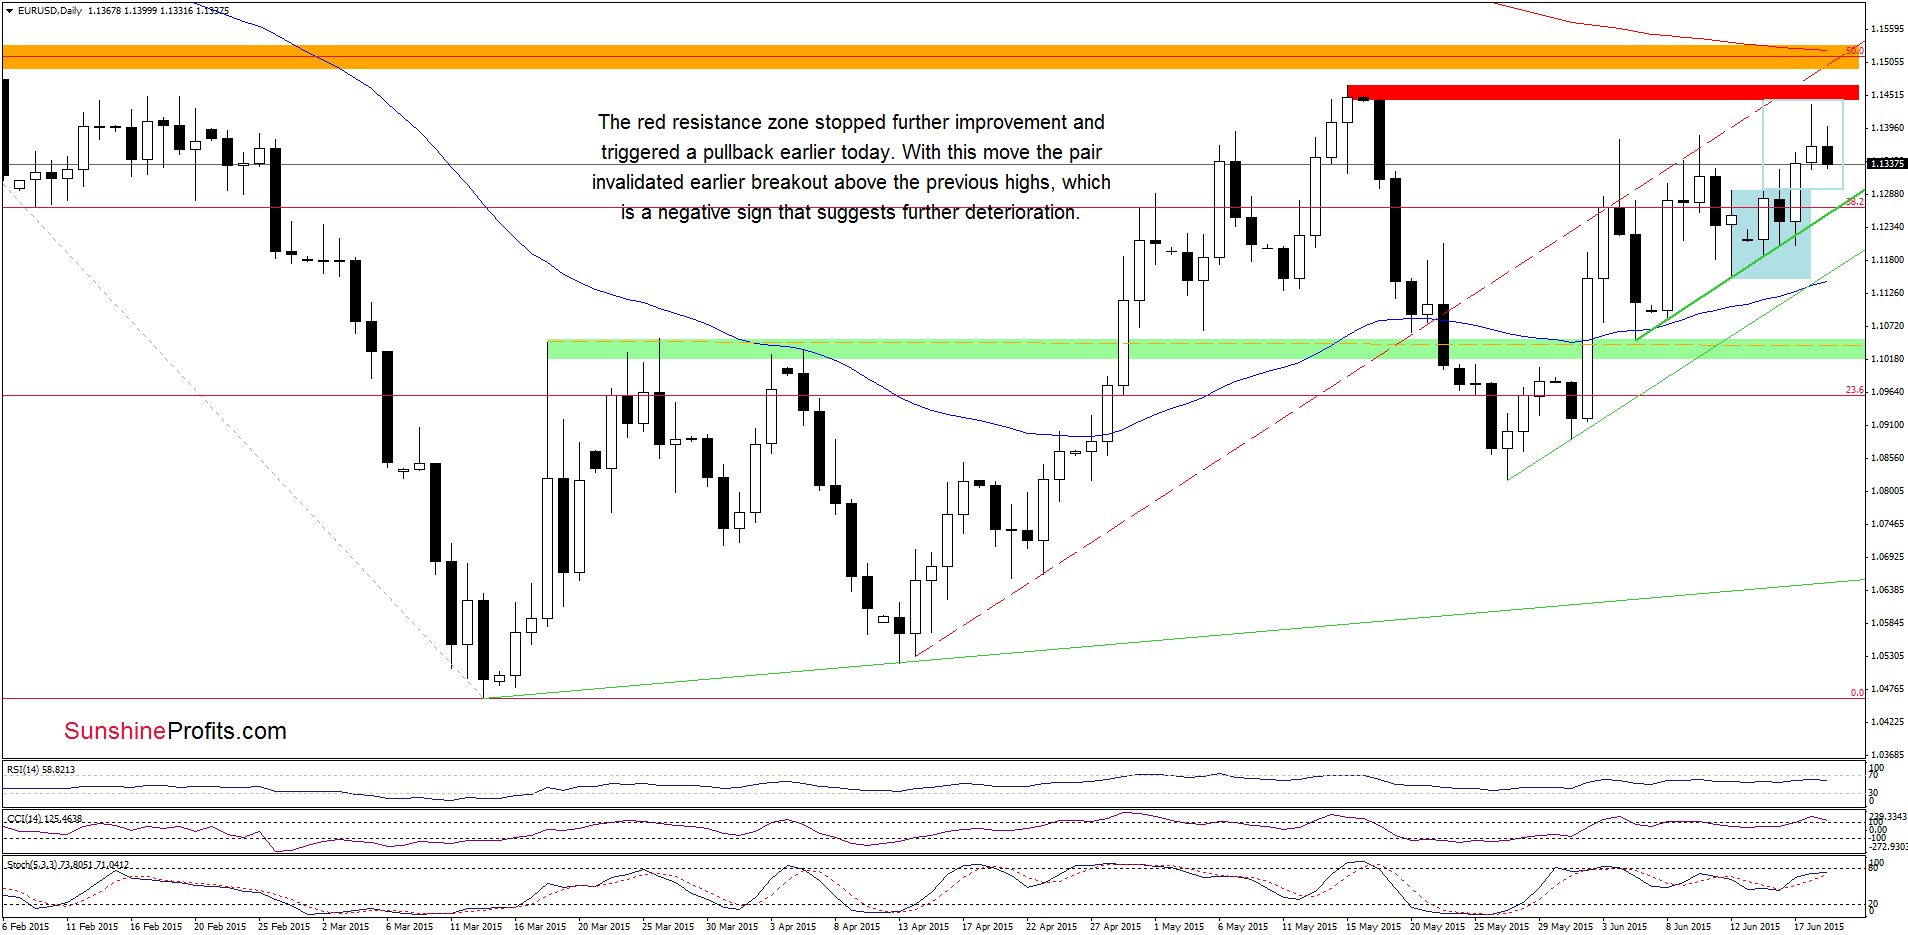
(…) EUR/USD broke above the orange resistance zone (created by the 76.4% and 78.6% Fibonacci retracement levels), which triggered further rally and resulted in a climb above the recent highs. This is a positive signal that suggests (…) a test of the mid-May high. (…) in this area the size of the upswing will correspond to the height of the blue consolidation, which could reduce the selling pressure and trigger a pullback (especially when we factor in the proximity to the orange resistance zone and the red resistance line)
From this perspective, we see that the situation developed in line with the above scenario as the red resistance zone stopped further improvement and triggered a pullback. Earlier today, the pair extended losses, invalidating earlier breakout above the previous highs. This is a negative signal, which suggests further deterioration and a test of the green support line based on the Jun lows (currently around 1.1256) in the coming day(s). Additionally, the CCI and Stochastic Oscillator are very close to generating sell signals, which supports the bearish case.
Very short-term outlook: mixed with bearish bias
Short-term outlook: mixed
MT outlook: mixed
LT outlook: mixed
Trading position (short-term; our opinion): No positions are justified from the risk/reward perspective at the moment. We will keep you informed should anything change, or should we see a confirmation/invalidation of the above.
USD/JPY
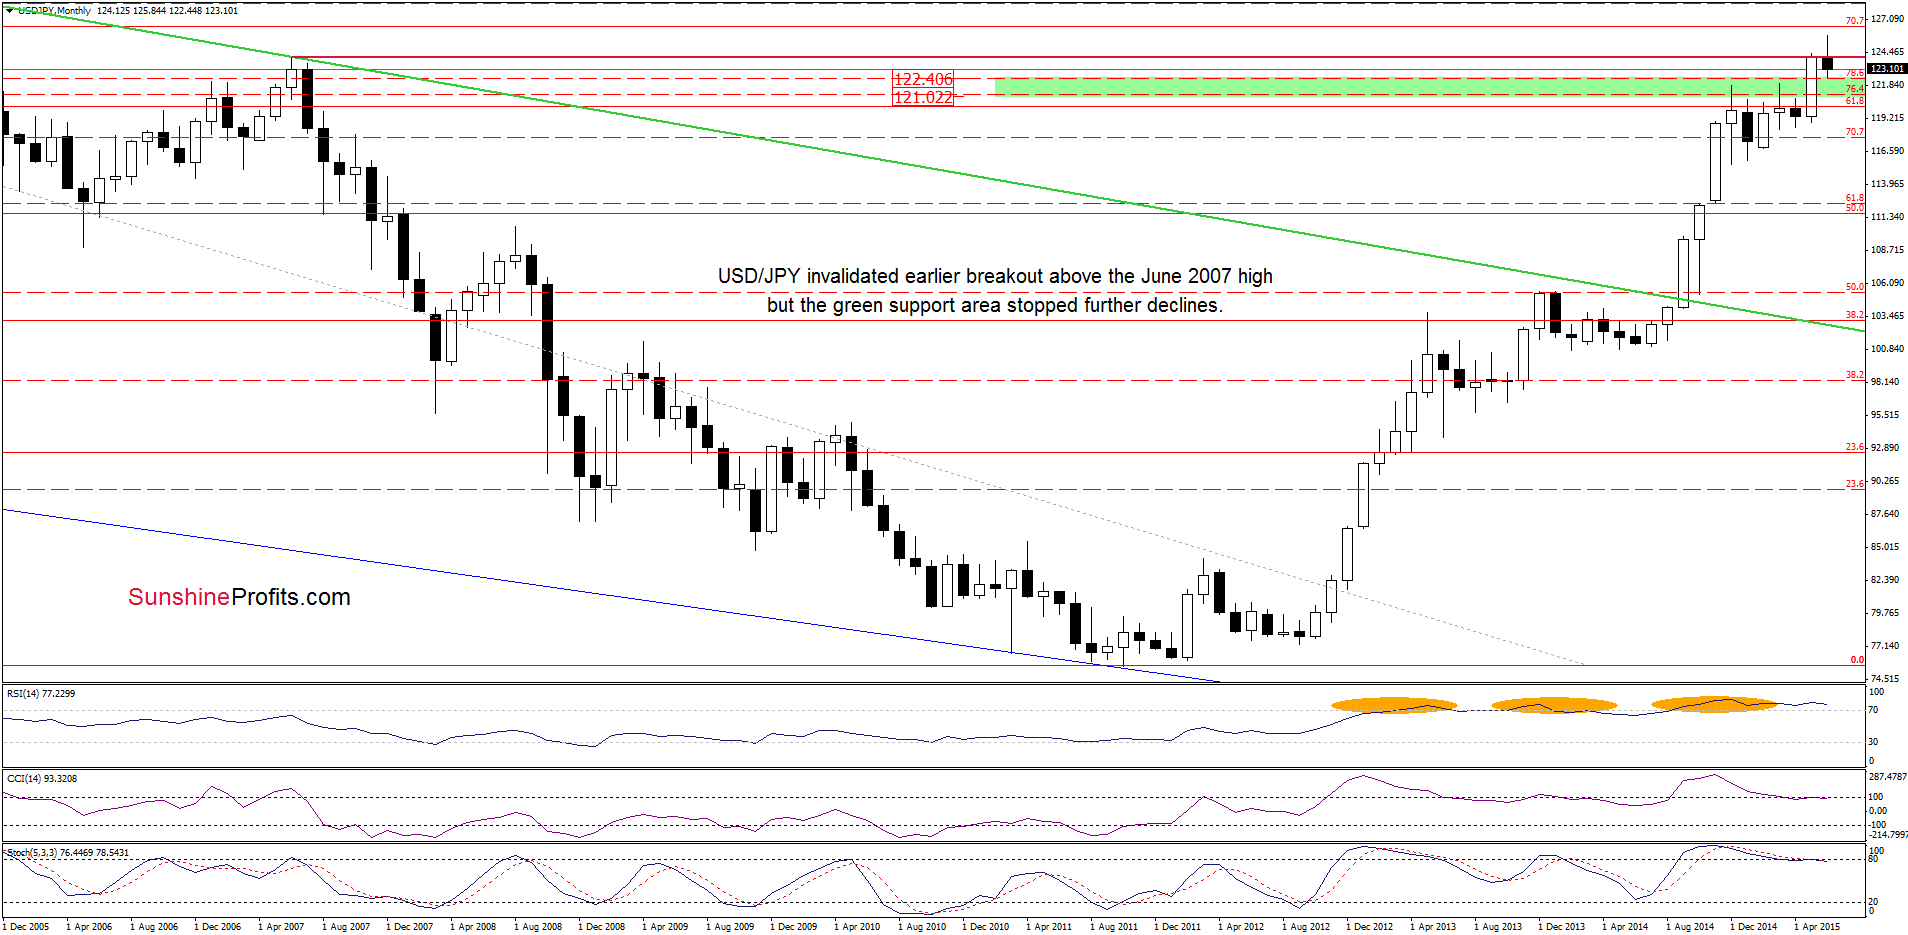
Looking at the monthly chart we see that the green support zone (created by the previously-broken 76.4% and 78.6% Fibonacci retracement levels) stopped further deterioration, triggering a pullback.
How did this move affect the very short-term picture? Let’s check.
Quoting our last commentary on this currency pair:
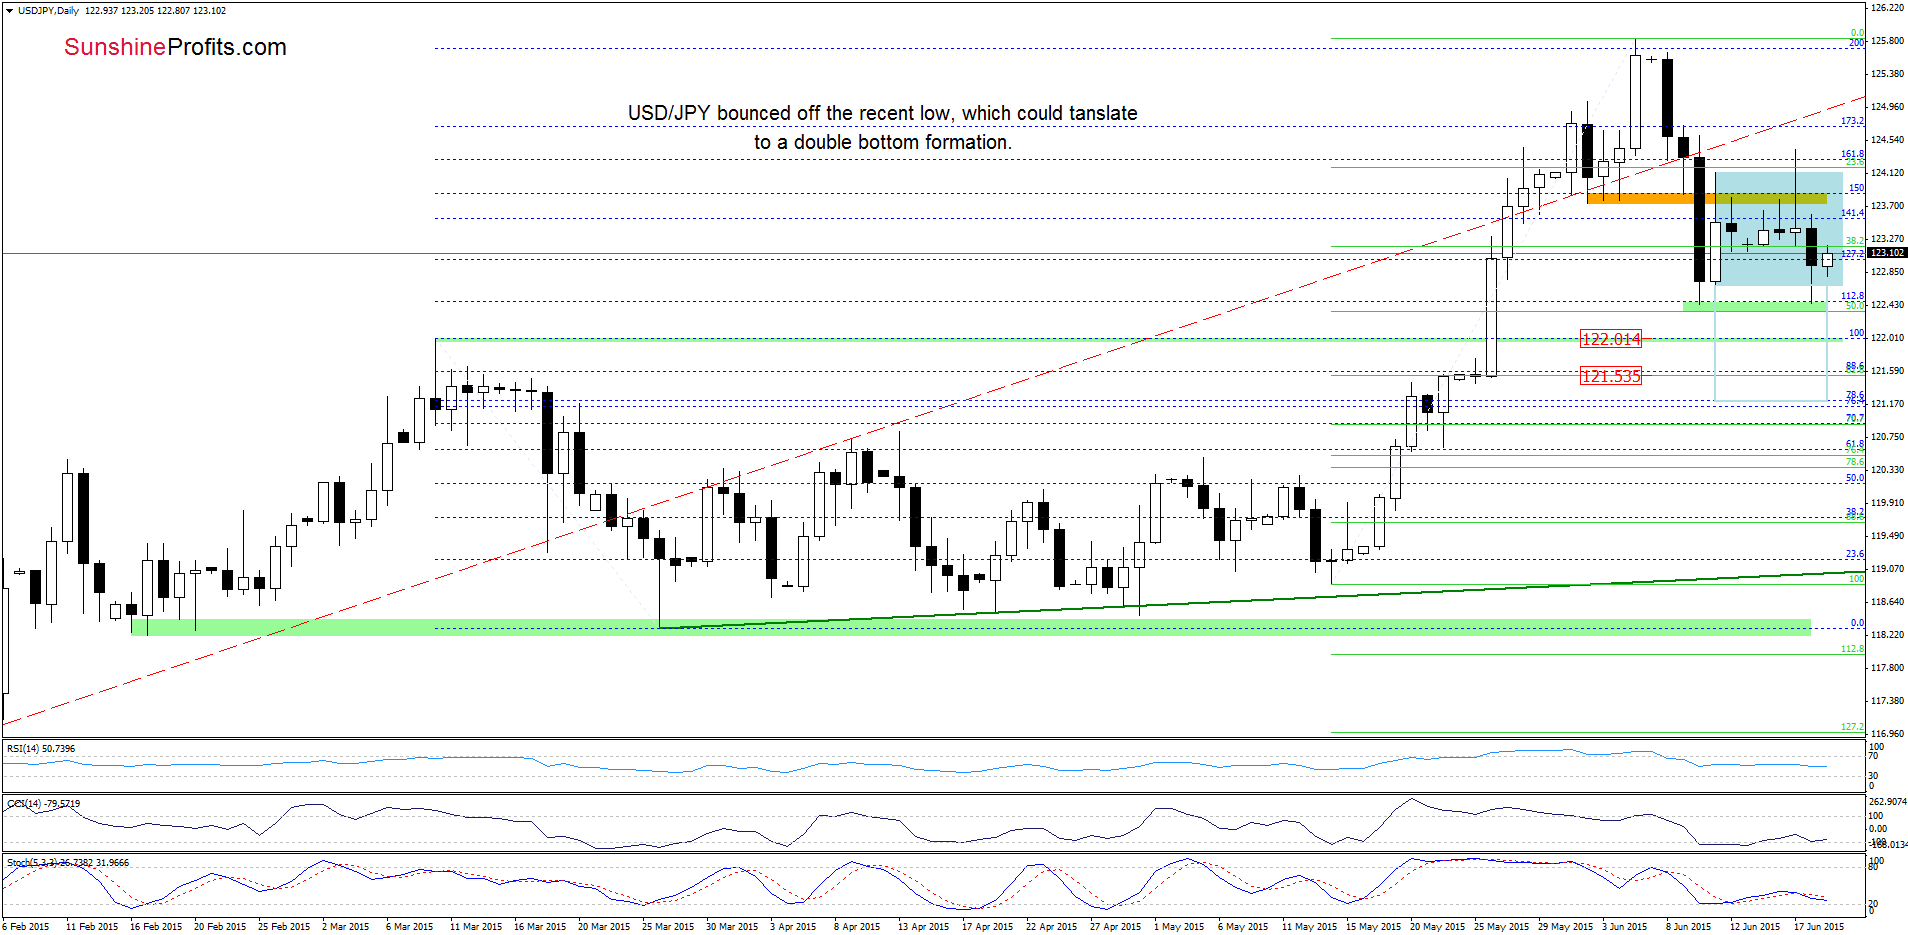
(…) USD/JPY broke below the lower border of the consolidation (marked with blue), which is a negative signal that suggests further deterioration. If this is the case, (…), we’ll see at least test of the Jun low.
From today’s point of view we see that currency bears pushed the pair to our initial downside target yesterday. Despite this drop, this support level withstood the selling pressure, which resulted in a rebound and an invalidation of the breakdown below the lower border of the consolidation. This is a positive signal, which suggests further improvement and an increase to the orange resistance zone in the coming days. Nevertheless, further rally will be more likely if we see a daily close above this zone.
Very short-term outlook: mixed with bullish bias
Short-term outlook: mixed
MT outlook: mixed
LT outlook: bullish
Trading position (short-term; our opinion): No positions are justified from the risk/reward perspective at the moment. We will keep you informed should anything change, or should we see a confirmation/invalidation of the above.
AUD/USD
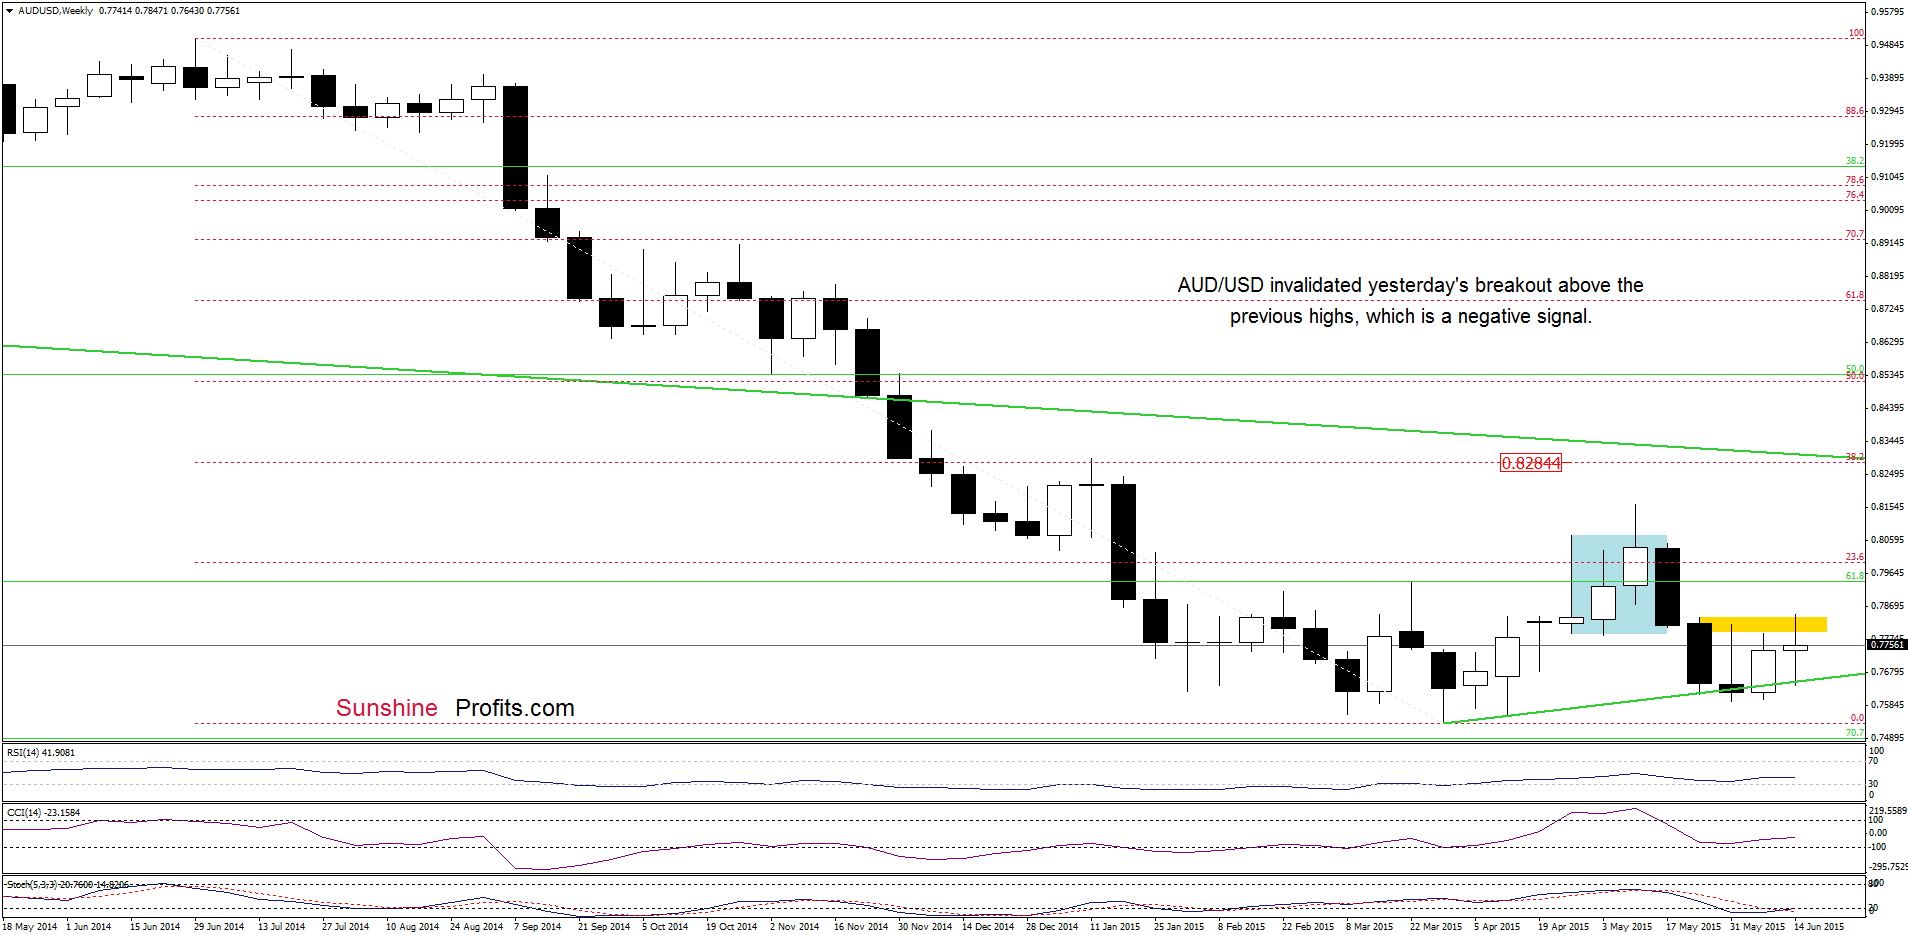
As you see on the weekly chart, although AUD/USD moved sharply higher, the pair reversed and invalidated earlier breakout above the yellow resistance zone created by the previous highs. This is a negative signal, which suggests further declines.
Having said that, let’s check what impact did this drop have on the very short-term picture.
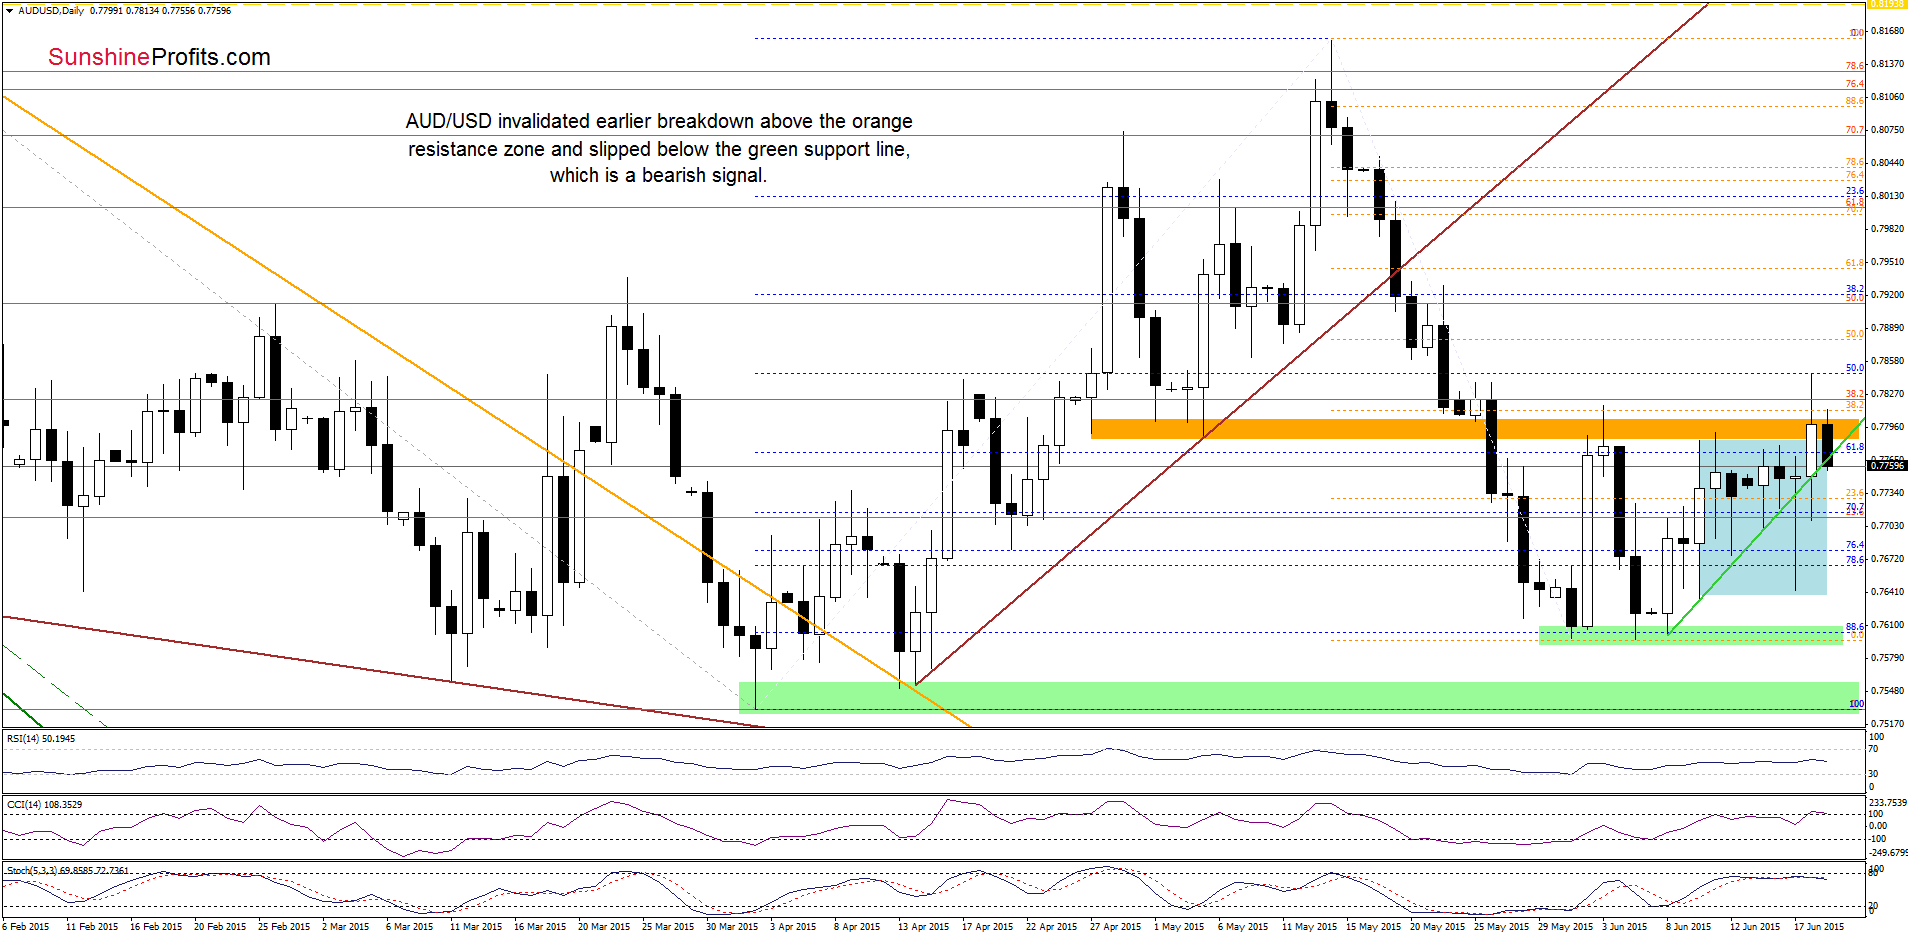
On the daily chart, we see that AUD/USD invalidated yesterday’s breakout above the orange resistance zone and slipped below the green support line earlier today. Although this is a bearish signal that suggests further deterioration, we should keep in mind that we saw similar drops in the recent days. As you see on the above chart, none of them brought daily closure below this line which resulted in a sharp rally on Thursday. Therefore, we think that this signal will be more bearish if AUD/USD closes today’s session under the green line. If we see such price action, the exchange rate will move lower from here and re-test the support zone created by the recent lows (around 0.7634-0.7643) in the coming week. Finishing today’s commentary on this currency pair, please note that the current position of the indicators suggests that lower values of AUD/USD are quite likely (especially if the CCI and Stochastic Oscillator generate sell signals).
Very short-term outlook: mixed with bearish bias
Short-term outlook: mixed
MT outlook: mixed
LT outlook: mixed
Trading position (short-term; our opinion): No positions are justified from the risk/reward perspective at the moment. We will keep you informed should anything change, or should we see a confirmation/invalidation of the above.
Thank you.
Nadia Simmons
Forex & Oil Trading Strategist
Przemyslaw Radomski, CFA
Founder, Editor-in-chief
Gold & Silver Trading Alerts
Forex Trading Alerts
Oil Investment Updates
Oil Trading Alerts

