

Although Fed Chair Janet Yellen said the economy has “expanded moderately” after a weak first quarter, Fed officials lowered expectations for GDP growth in 2015 (the second time since December) and its interest-rate projections. As a result, the USD Index moved sharply lower, declining below 95. Earlier today, the index extended losses and hit a fresh three week low. What impact did this decline have on the short-term picture of our six currency pairs?
In our opinion the following forex trading positions are justified - summary:
Taking into account yesterday’s FED statement, we decided to take a closer look at the current situation in the USD Index. Let’s start with the daily chart.
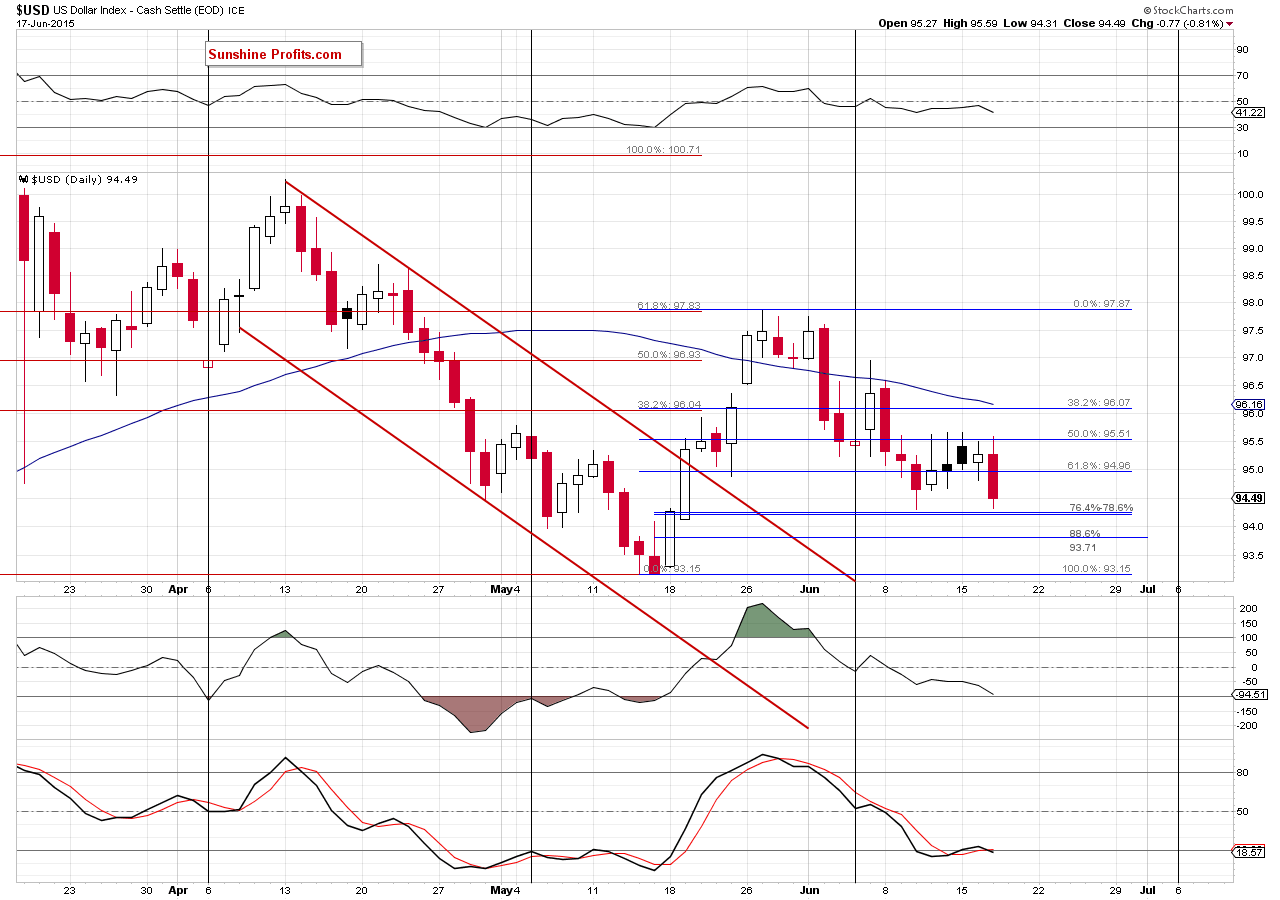
Yesterday, the index moved sharply lower and approached the previous low and the support area created by the 76.4% and 78.6% Fibonacci retracement levels. Earlier today, the greenback extended declines and dropped below 94, hitting a fresh low. This is a negative signal, which suggests further deterioration and a drop to around 93.71, where the 88.6% Fibonacci retracement is. Additionally, the current position of the indicators suggests lower values of the index (there are no buy signals). Therefore, if the above-mentioned support is broken, we’ll see a test of the mid-May low.
What could happen if currency bears manage to push the USD Index lower? Let’s take a closer look at the weekly chart and find out.
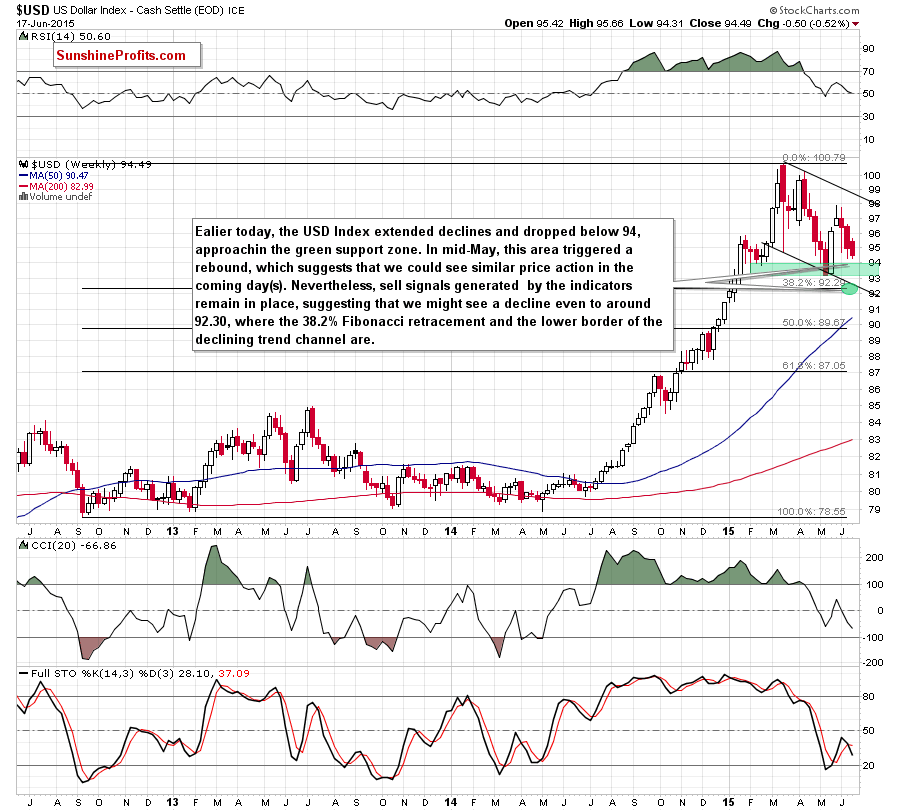
From this perspective, we see that the current decline approached the greenback to the green support zone. In mid-May this area was strong enough to stop further deterioration and trigger a rebound, which suggests that we could see a similar price action in the coming days. However, sell signals generated by the weekly indicators remain in place, suggesting that we might see a decline even to around 92.30, where the 38.2% Fibonacci retracement and the lower border of the declining trend channel are.
Overall quite a lot changed based on yesterday’s and today’s pre-market action and this time the price changed the short-term outlook for the USD Index (without changing the medium-term outlook). Consequently, in our opinion it is justified from the risk/reward point of view to close the positions that would suffer due to declining USD Index. We are closing some of them at a small loss and some of them at a profit with overall result being very close to 0. The more important thing, however, is that since the medium-term trend remains up, the move lower will only provide us with an even better entry point then the one that we had previously. Consequently, it seems that “thanks” to USD’s projected decline, we will increase the overall profits from the medium-term upswing in the USD.
Having said that, let’s check how this downward move affected the very short-term picture of our six currency pairs.
EUR/USD
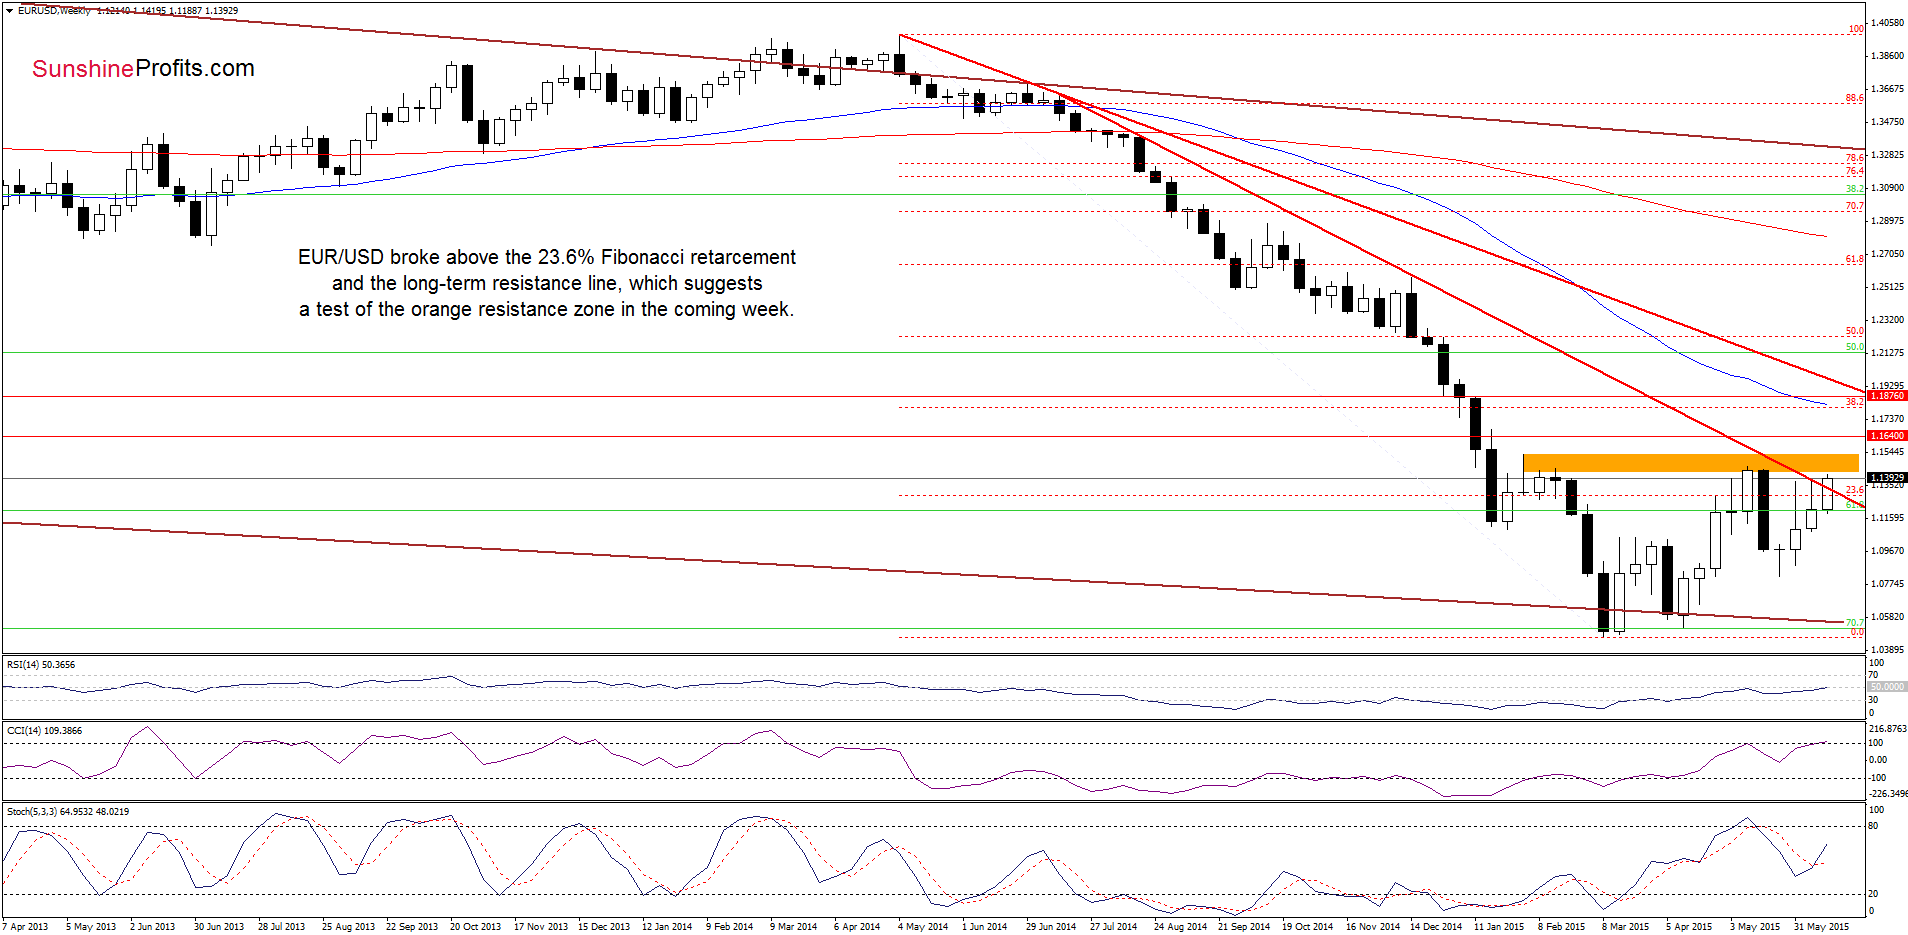
The first thing that catches the eye on the weekly chart is a comeback above the 23.6% Fibonacci retracement and a breakout above the long-term red declining line. This is a positive signal (which will be even more bullish if we see a weekly close above this line), which suggests further improvement and a test of the orange resistance zone (created by the Feb highs in the coming week.
Are there any short-term factors that could hinder the realization of the above scenario? Let’s examine the daily chart and find out.
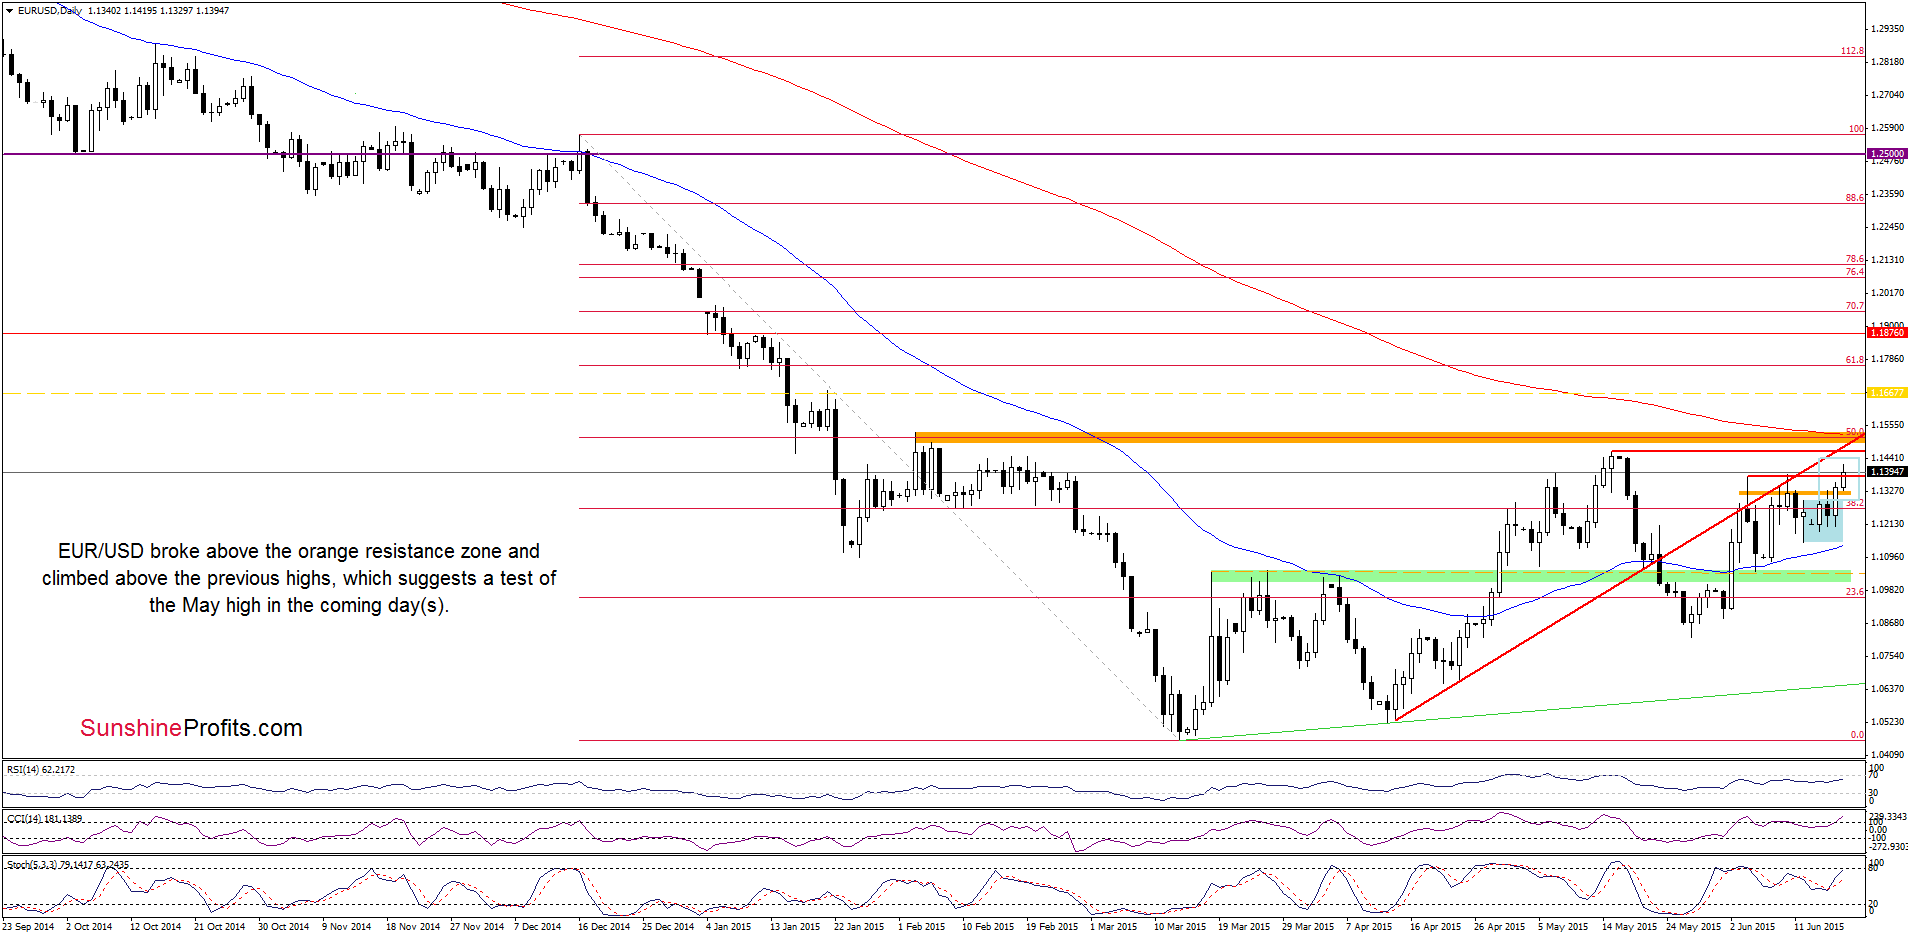
From this perspective, we see that EUR/USD broke above the orange resistance zone (created by the 76.4% and 78.6% Fibonacci retracement levels), which triggered further rally and resulted in a climb above the recent highs. This is a positive signal that suggests further rally and a test of the mid-May high. Please note that in this area the size of the upswing will correspond to the height of the blue consolidation, which could reduce the selling pressure and trigger a pullback (especially when we factor in the proximity to the orange resistance zone and the red resistance line) in the coming days.
Very short-term outlook: bullish
Short-term outlook: mixed
MT outlook: mixed
LT outlook: mixed
Trading position (short-term; our opinion): No positions are justified from the risk/reward perspective at the moment. We will keep you informed should anything change, or should we see a confirmation/invalidation of the above.
GBP/USD
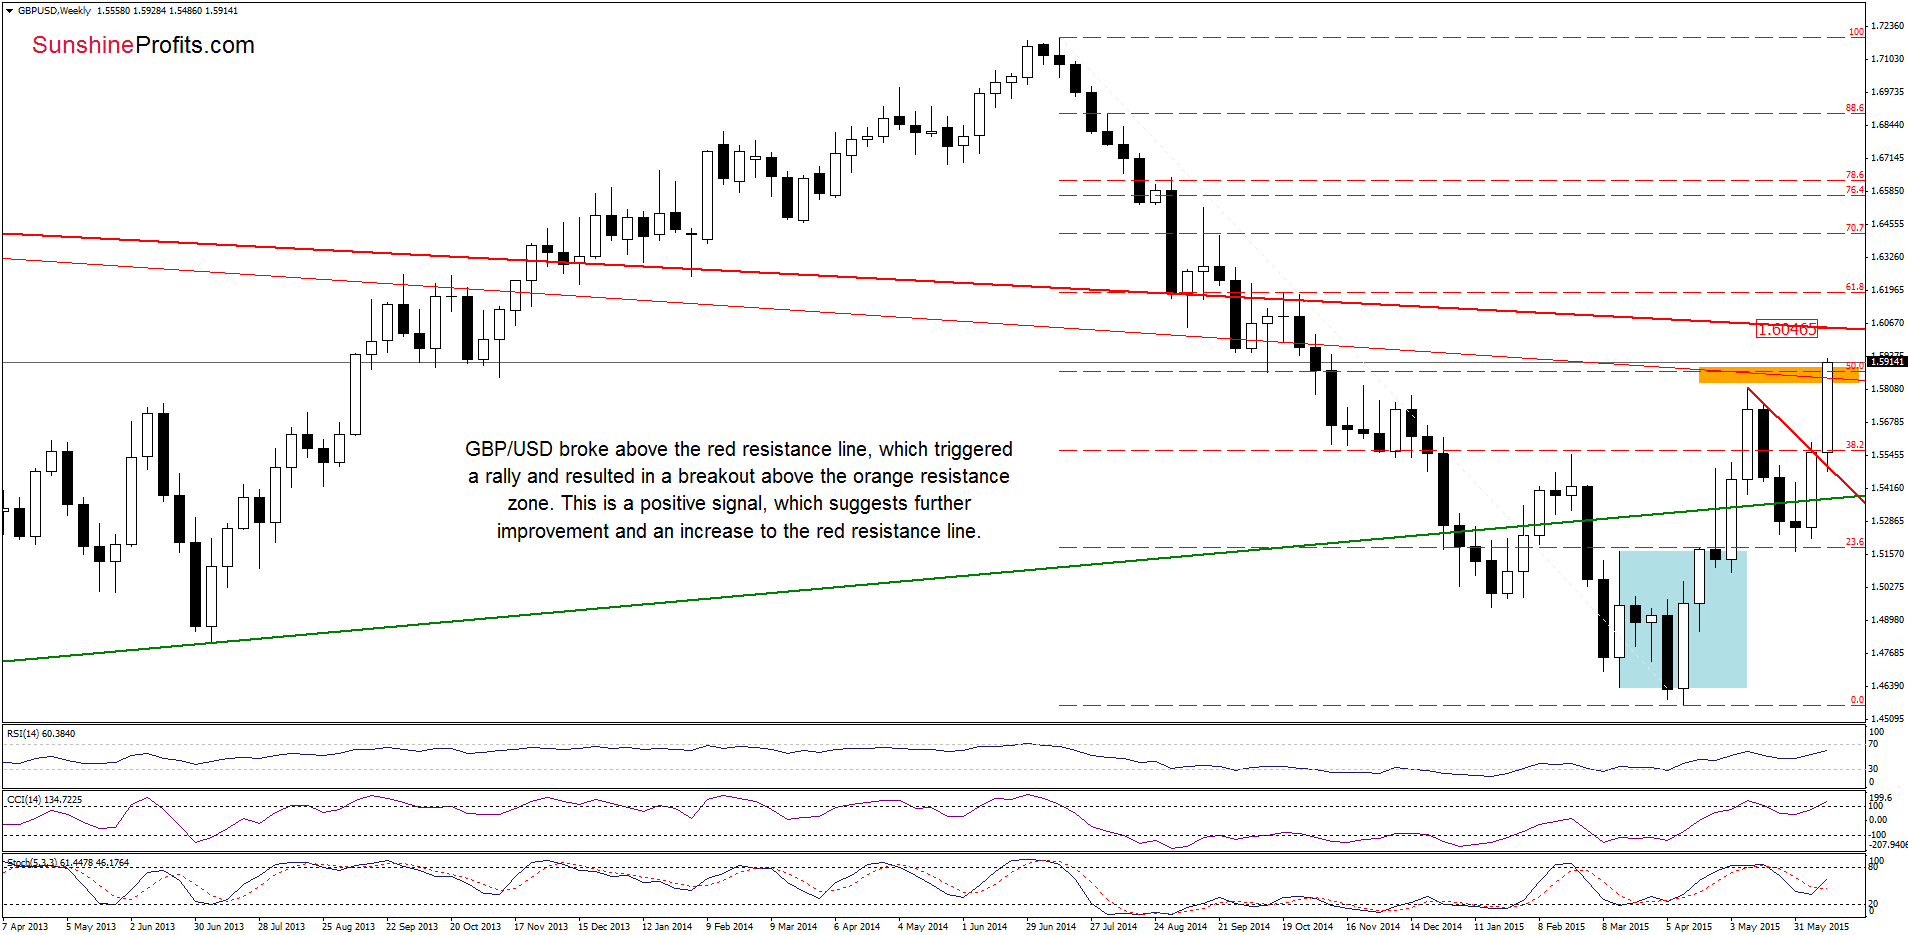
As you see on the weekly chart, GBP/USD broke above the red resistance line based on the previous highs, which triggered a sharp rally that took the pair to a fresh 2015 high. With this move, the exchange rate also broke above the orange resistance zone, which is a bullish signal that suggests an increase to the red resistance line based on the Aug 2008 and Apr 2011 highs (currently around 1.6046).
What impact did this move have on the very short-term chart? Let’s check.
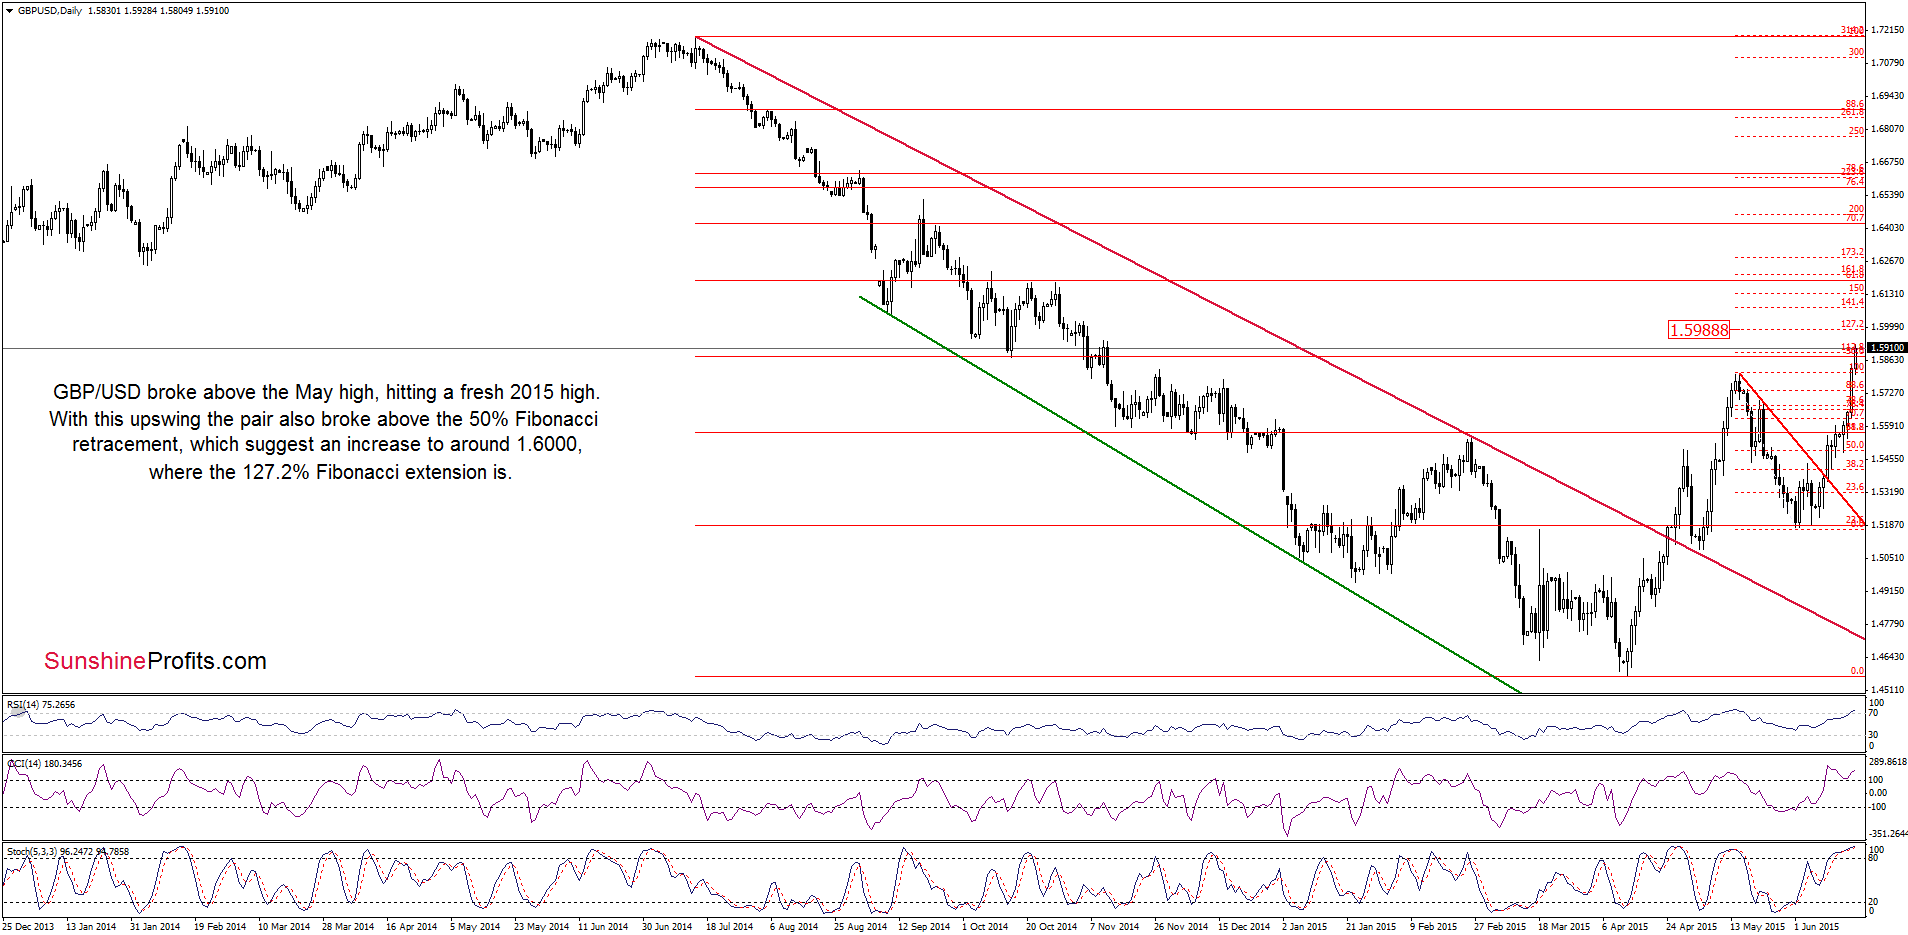
Looking at the daily chart we see that GBP/USD broke above the May high and the 50% Fibonacci retracement (based on the entire Jul 2014-Apr 2015 decline) and the 112.8% Fibonacci extension, which suggests a test of the psychologically important barrier of 1.6000 in the coming day(s). In this area there is also the 127.2% Fibonacci extension, which reinforces this zone and could encourage currency bears to act – especially when we factor in the current position of the indicators (the RSI climbed above 70, while the CCI and Stochastic Oscillator are overbought). Nevertheless, if this resistance level is broken, the next upside target would be the above-mentioned long-term red resistance line.
Very short-term outlook: bullish
Short-term outlook: mixed
MT outlook: mixed
LT outlook: mixed
Trading position (short-term; our opinion): No positions are justified from the risk/reward perspective at the moment. We will keep you informed should anything change, or should we see a confirmation/invalidation of the above.
USD/JPY
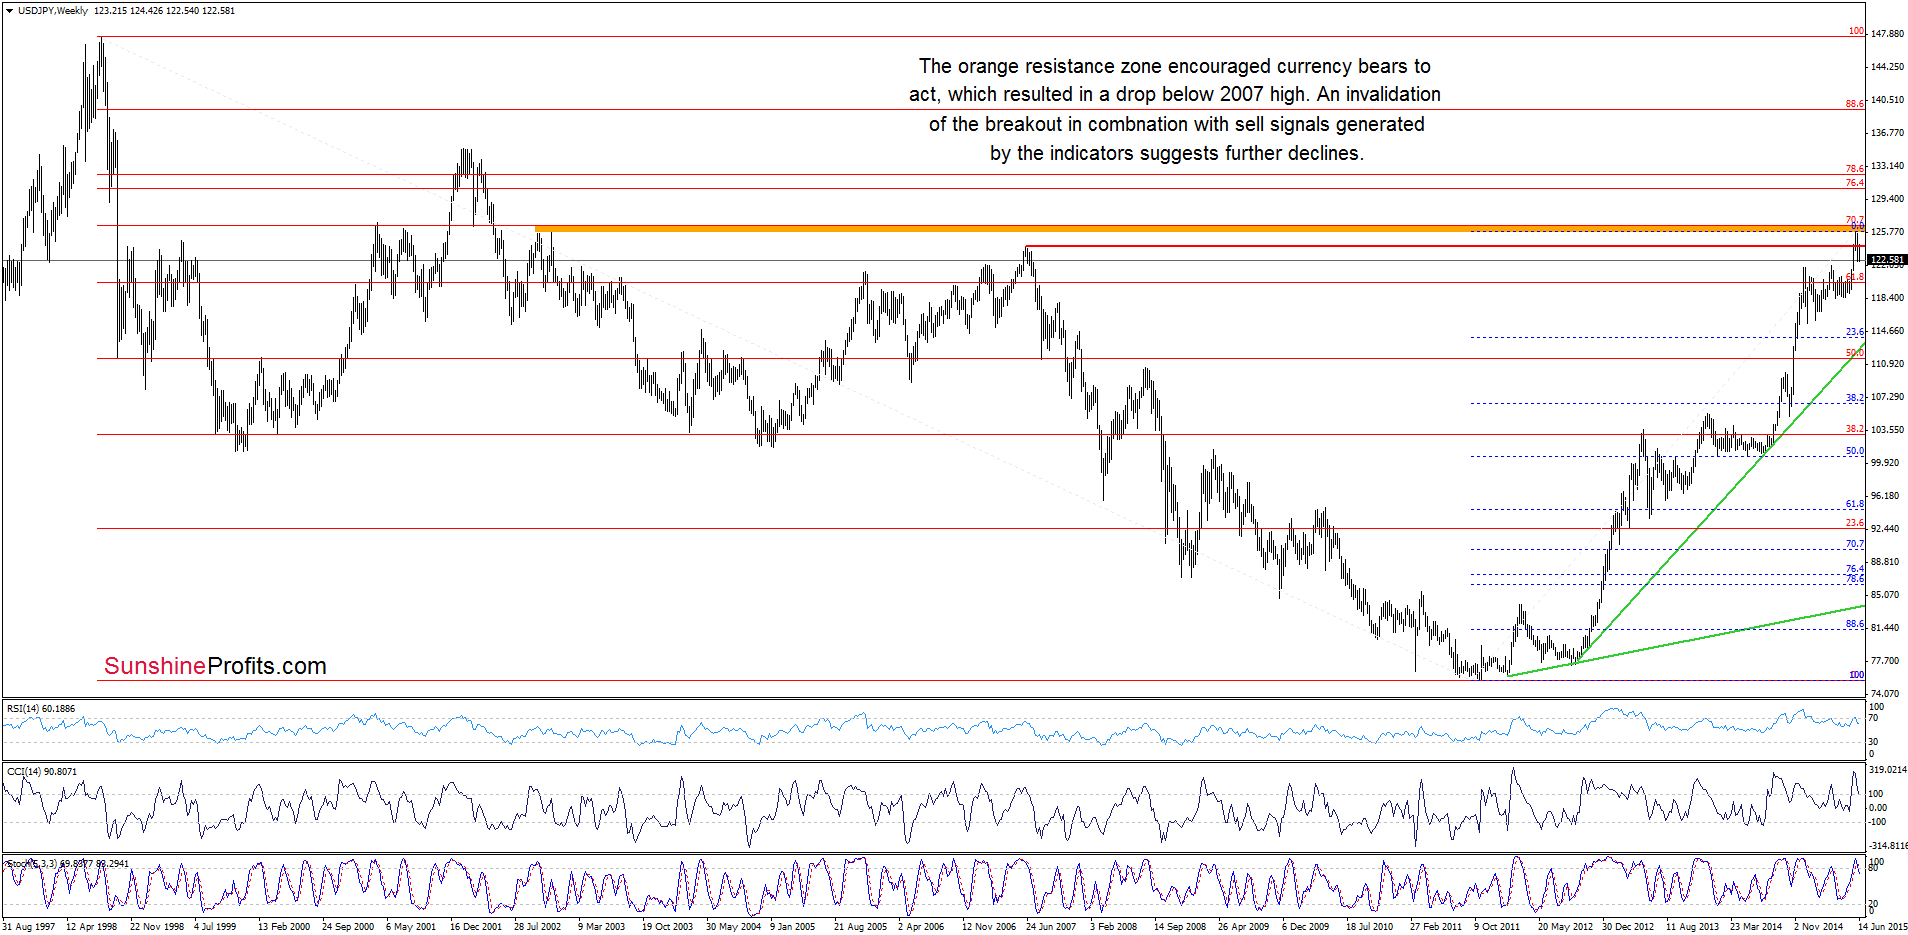
On the weekly chart we see that the orange resistance zone encouraged currency bears to act, which resulted in another drop below the June 2007 high. Taking this fact into account, and combining with sell signals generated by the indicators, it seems that further deterioration is just around the corner.
How low could the exchange rate go in the coming days? Let’s take a closer look at the daily chart and find out.
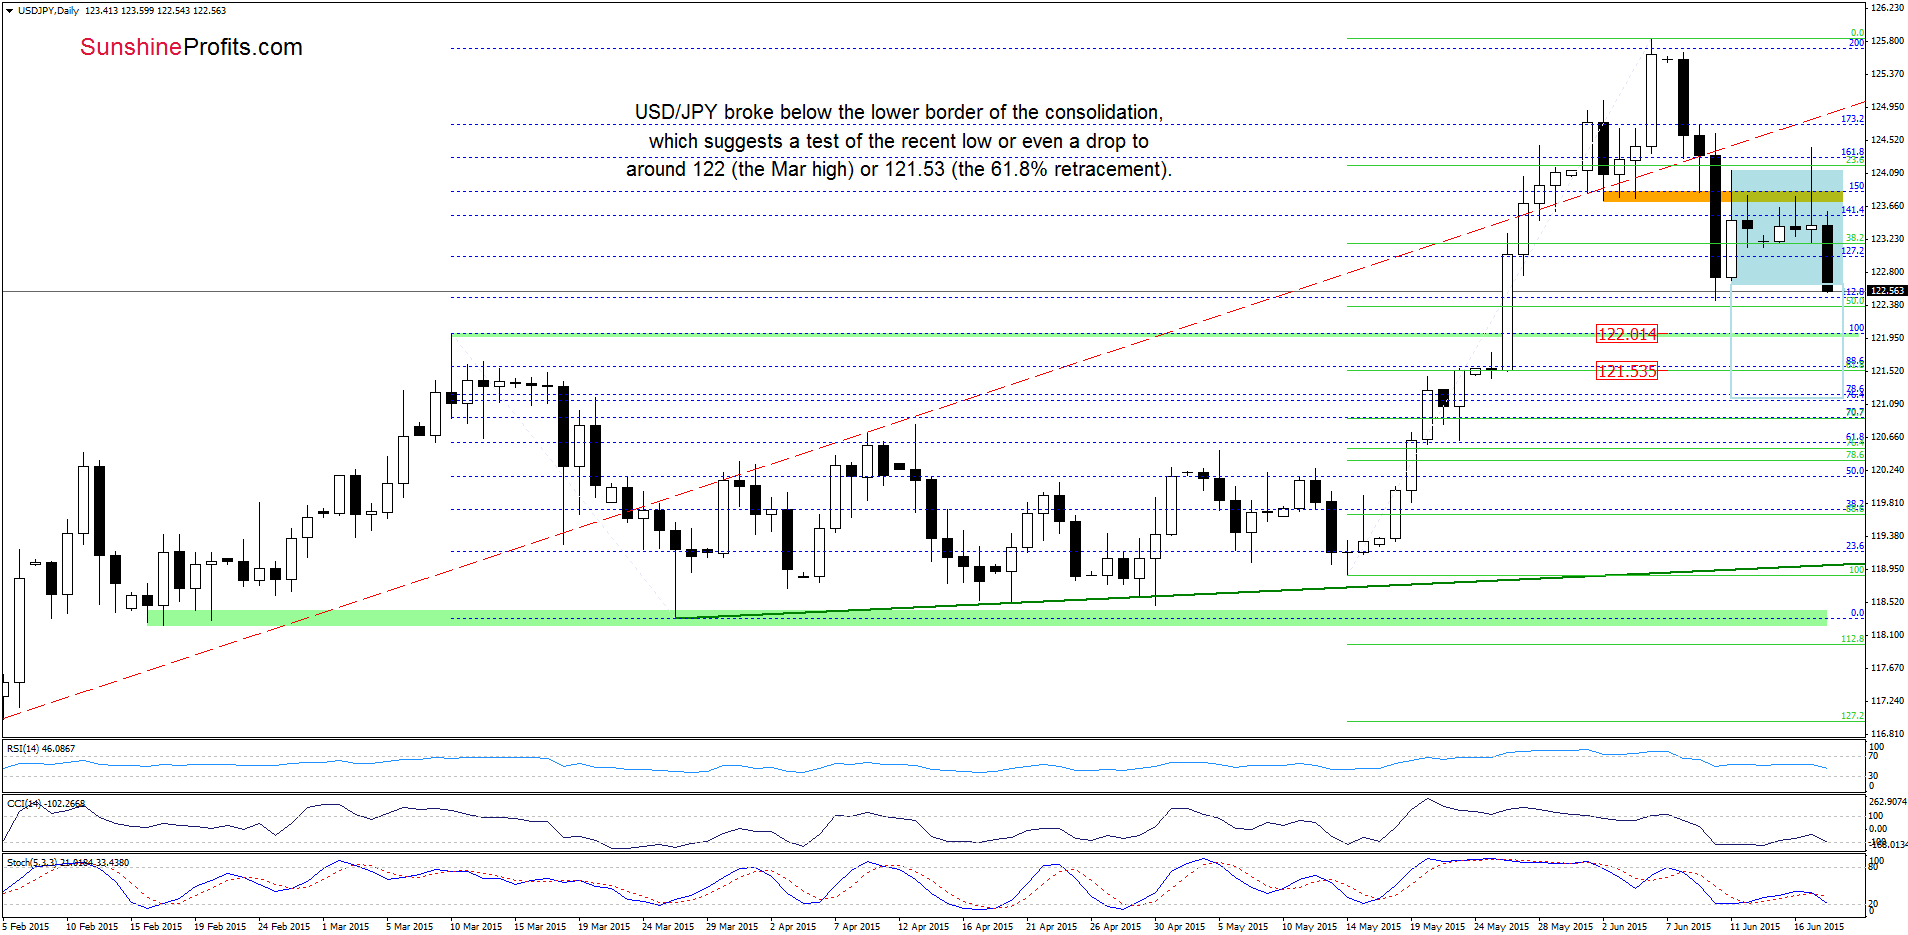
Looking at the daily chart, we see that USD/JPY broke below the lower border of the consolidation (marked with blue), which is a negative signal that suggests further deterioration. If this is the case, and the pair closes today’s session under the lower line of the formation, we’ll see at least test of the Jun low. If this support is broken, the next target would be around 122 (the Mar high) or even 121.35, where the 61.8% Fibonacci retracement based on the mid-May-Jun rally is.
Very short-term outlook: mixed
Short-term outlook: mixed
MT outlook: mixed
LT outlook: bullish
Trading position (short-term; our opinion): No positions are justified from the risk/reward perspective at the moment. We will keep you informed should anything change, or should we see a confirmation/invalidation of the above.
USD/CAD
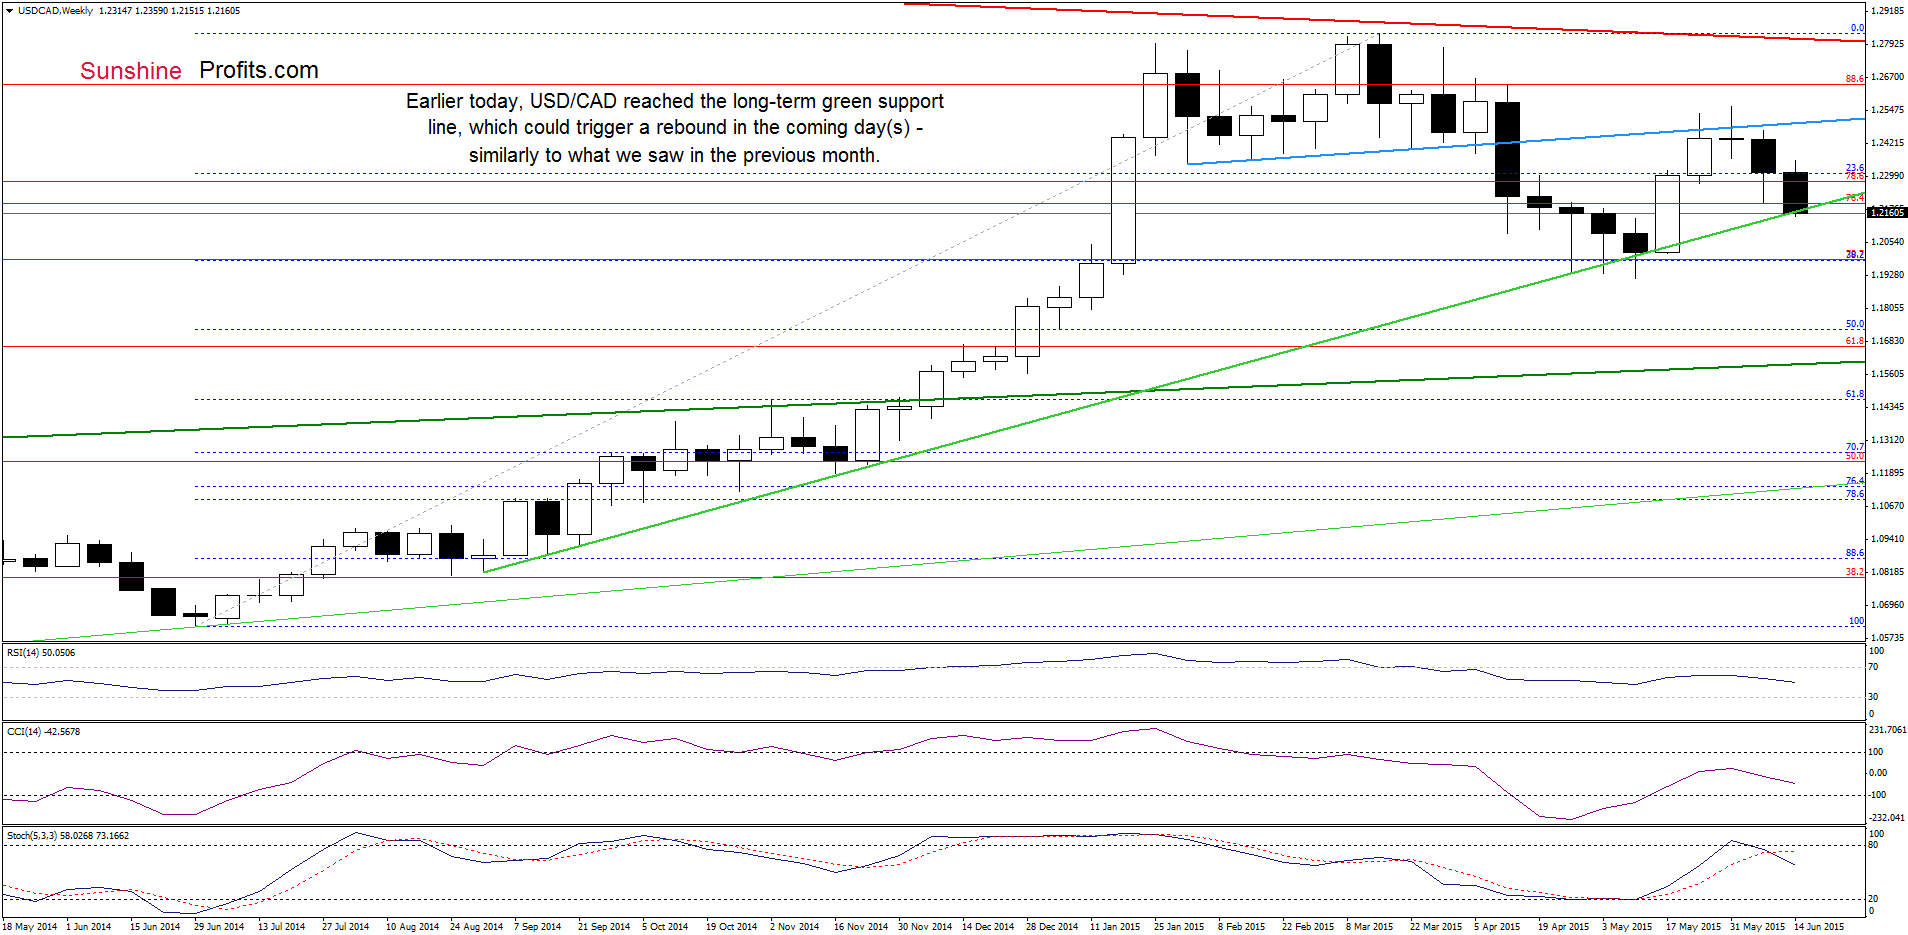
The first thing that catches the eye on the weekly chart is a drop to the long-term green line. In the previous month this support was strong enough to stop currency bears and trigger a rally, which suggests that we could see similar price action n the coming days. Nevertheless, sell signal generated by the Stochastic Oscillator doesn’t bode well for USD/CAD. What’s next?
Will the very short-term picture give us more clues about future moves? Let’s check.
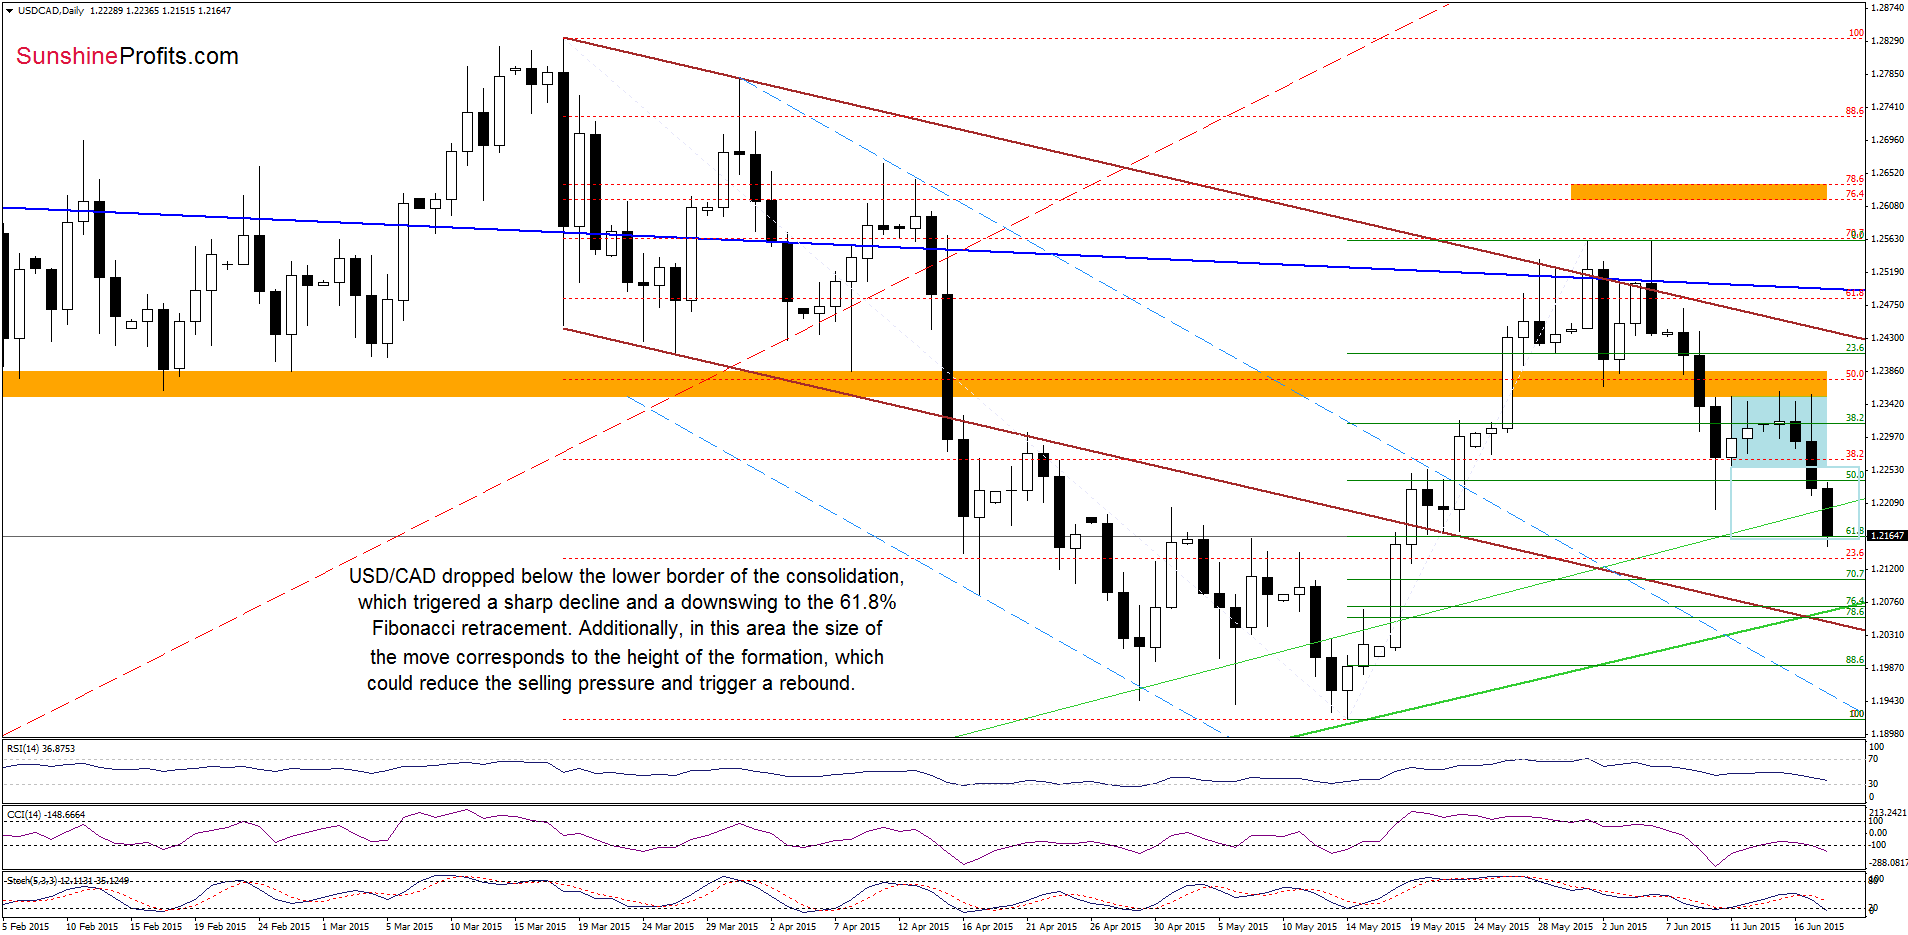
Looking at the daily chart we see that USD/CAD broke below the lower border of the blue consolidation, which triggered a sharp decline and a downward move to the 61.8% Fibonacci retracement. Additionally, in this area the size of the move corresponds to the height of the formation, which could reduce the selling pressure and trigger a rebound from here in the coming day(s). Nevertheless, we should keep in mind that the current position of the indicators suggests lower values of the exchange rate. If this is the case, and USD/CAD drops under the long-term support line marked on the weekly chart, we’ll likely see a drop to around 1.2106, where the 70.7% Fibonacci retracement is.
Very short-term outlook: mixed with bearish bias
Short-term outlook: mixed
MT outlook: mixed
LT outlook: mixed
Trading position (short-term; our opinion): No positions are justified from the risk/reward perspective at the moment. We will keep you informed should anything change, or should we see a confirmation/invalidation of the above.
USD/CHF
Yesterday, we wrote the following:
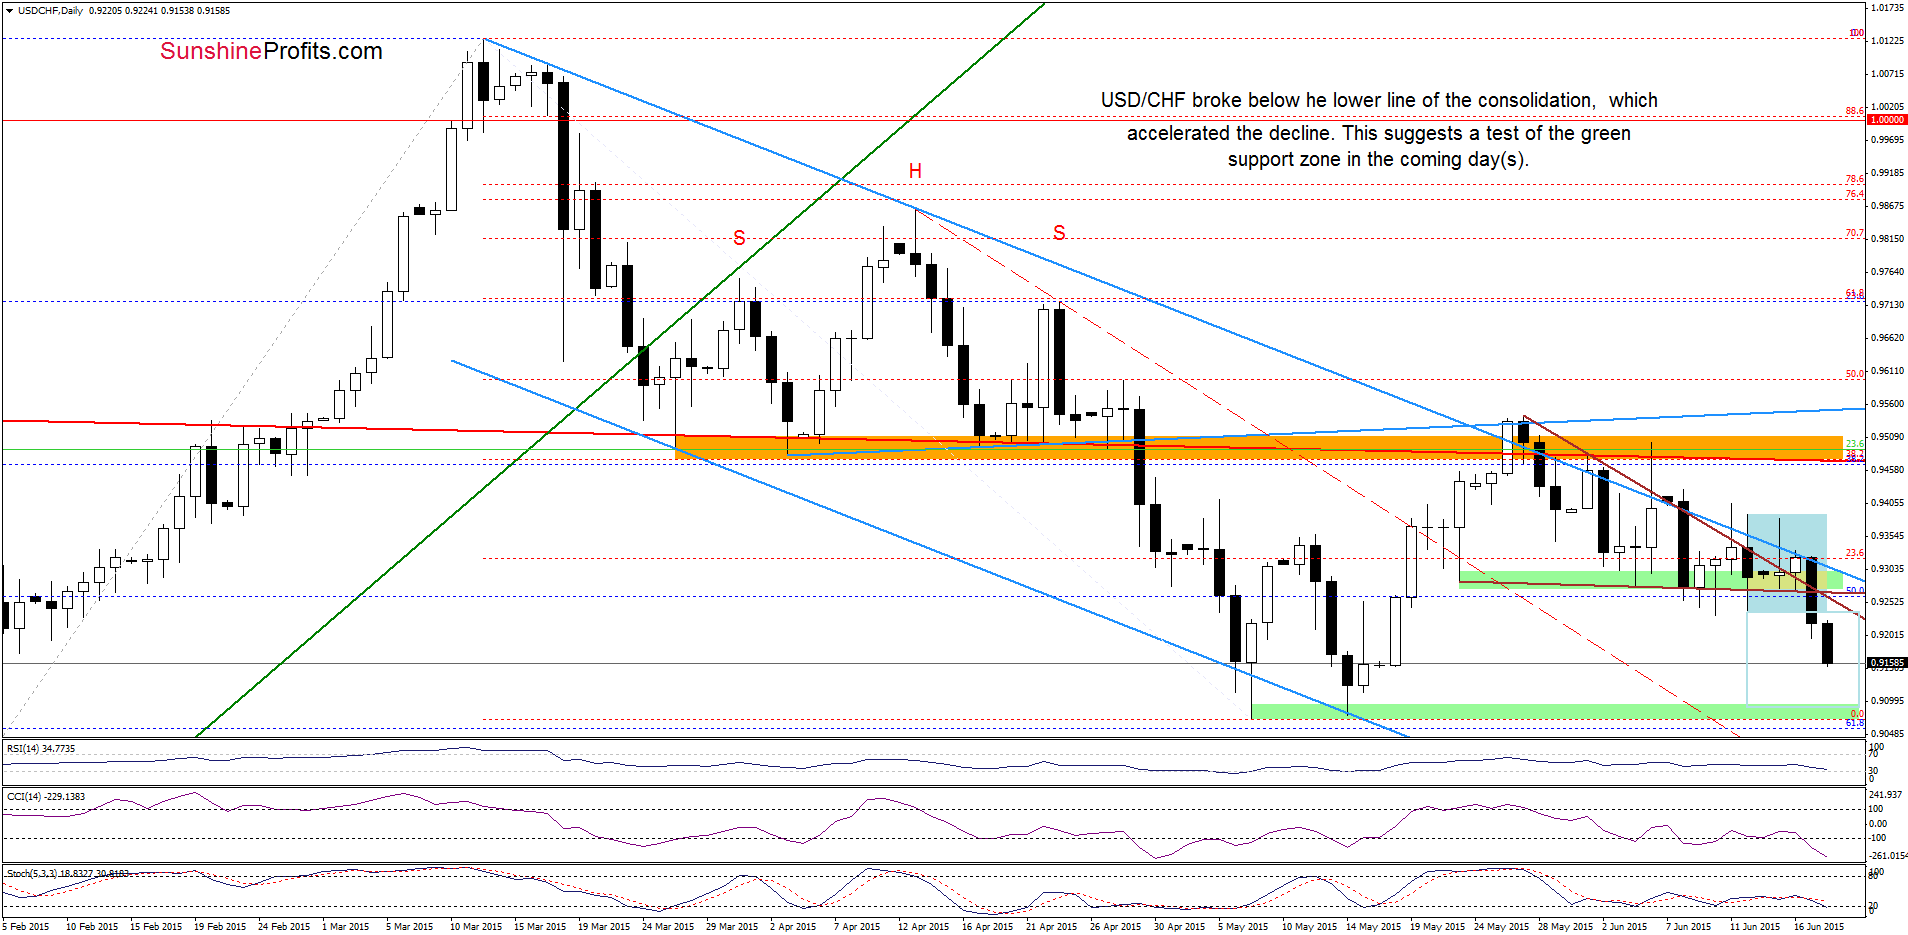
(…) the blue resistance line triggered a decline, which took the exchange rate to the lower border of the consolidation (marked with blue). (…) if the pair closes the day under the recent lows, it would be a bearish signal, which will likely trigger a decline to around 0.9070-0.9080, where the May lows are (additionally, in this area the size of the downswing will correspond to the height of the consolidation).
From today’s point of view we see that the situation developed in line with the above scenario and USD/CHF extended losses, which means that our yesterday’s target is up-to-date also today.
How did this move affect the medium-term picture? Let’s find out.
Quoting our yesterday’s commentary on this currency pair:
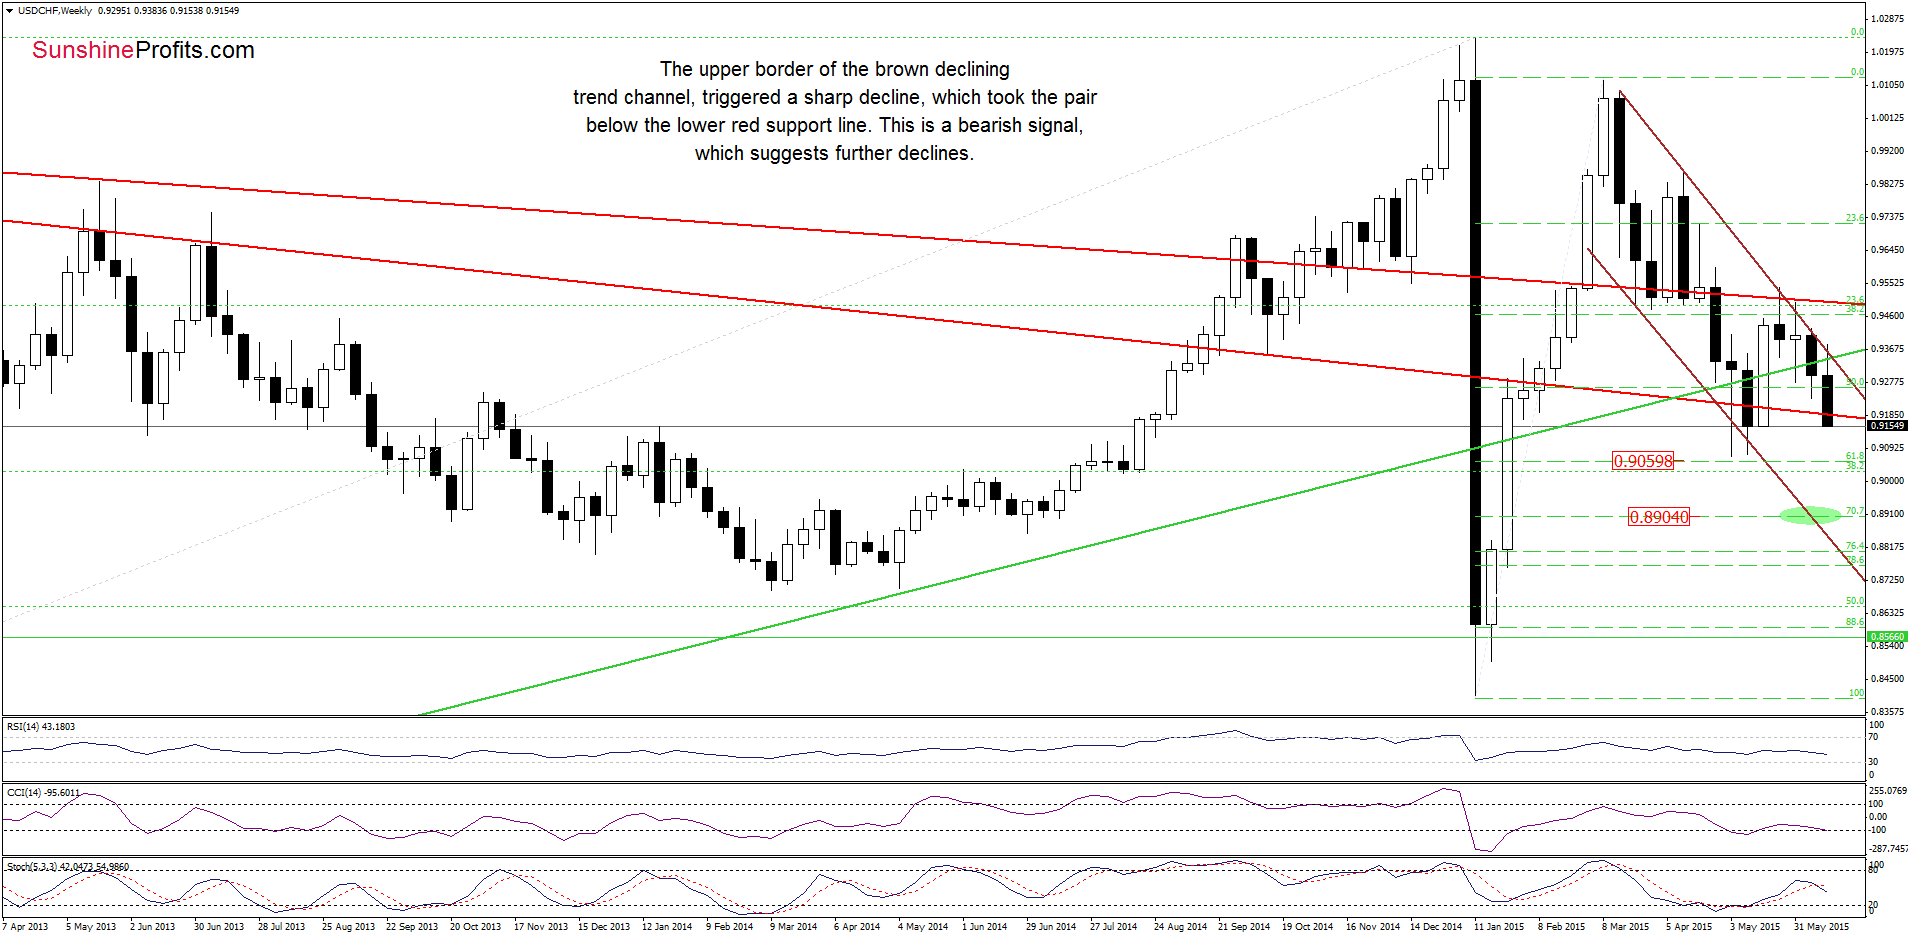
(…) USD/CHF still remains under the upper border of the brown declining trend channel. Therefore, in our opinion, as long as there is no breakout above this important resistance line further rally is not likely to be seen and another attempt to move lower should not surprise us (especially when we factor in the fact that the exchange rate declined below the long-term green support line once again).
As you see on the above chart currency bears pushed the pair lower as expected. With this downswing the exchange rate broke below the long-term red support line, which suggests (at least) a test of the May lows in the coming days.
Very short-term outlook: bearish
Short-term outlook: mixed
MT outlook: mixed
LT outlook: bearish
Trading position (short-term; our opinion): No positions are justified from the risk/reward perspective at the moment. We will keep you informed should anything change, or should we see a confirmation/invalidation of the above.
AUD/USD
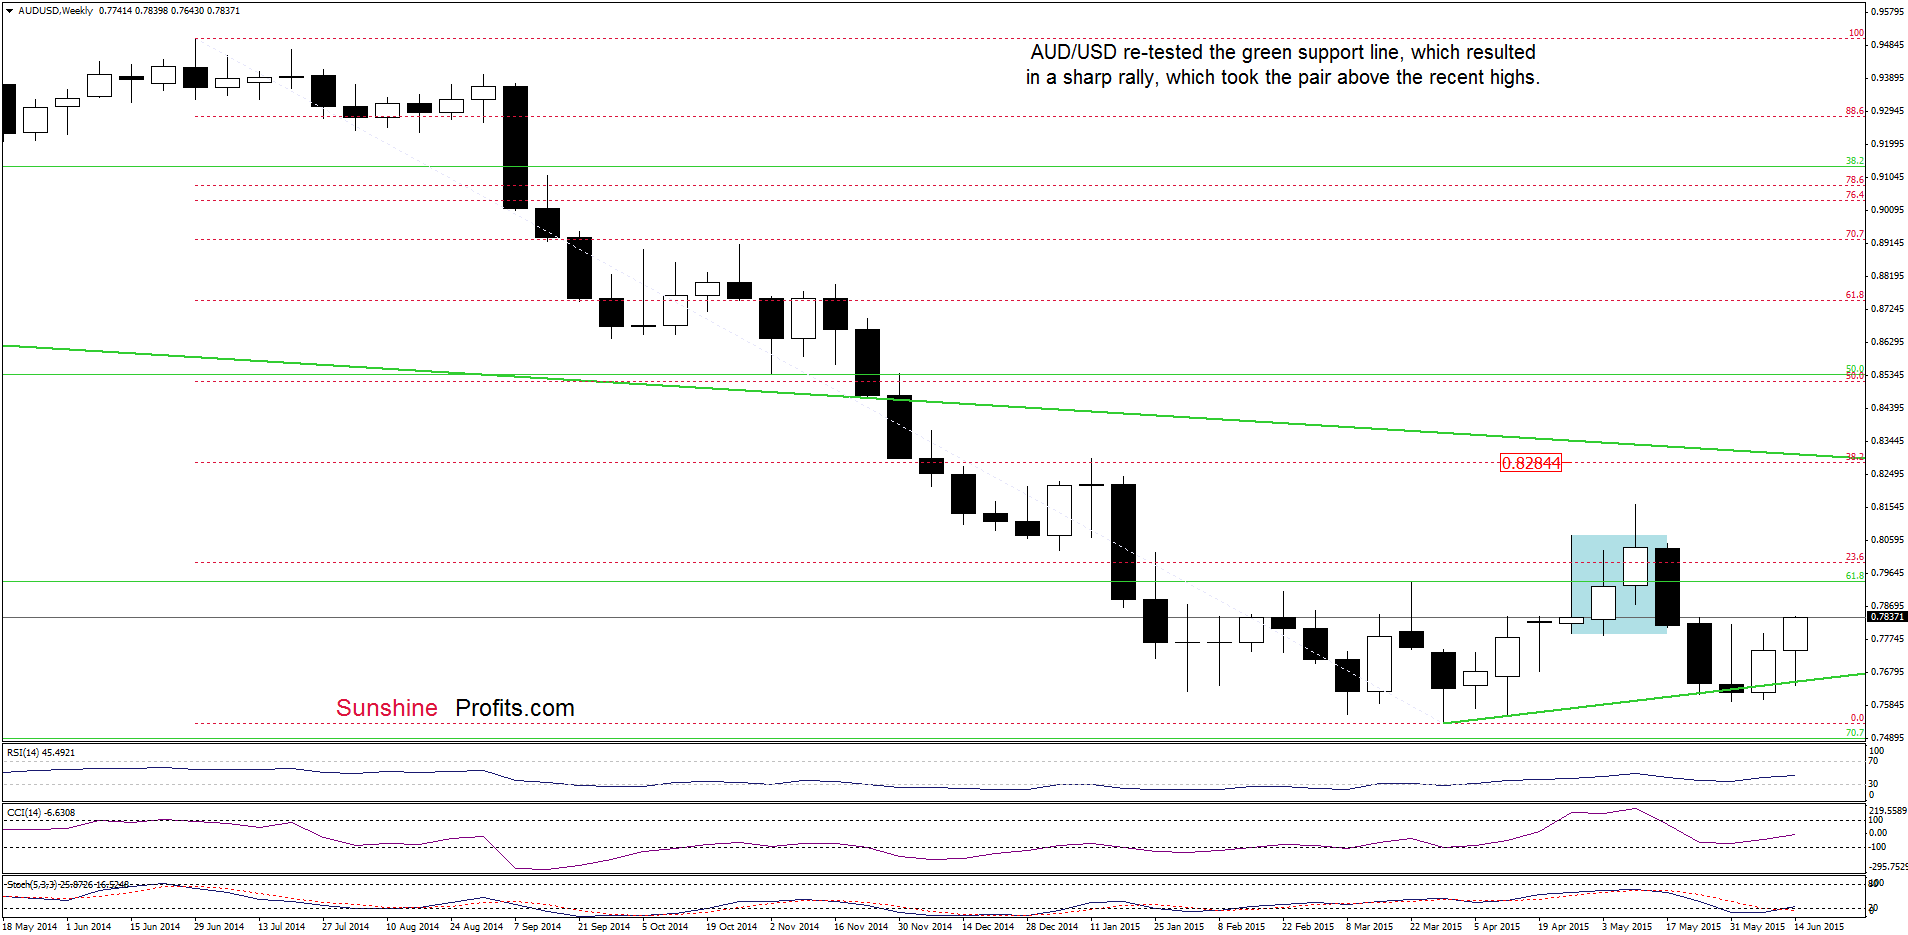
AUD/USD re-tested the strength of the green support line (based on the previous lows), which triggered a sharp rebound and took the pair above the recent highs.
How high could the exchange rate go in the coming days? Let’s examine he daily chart ad find out.
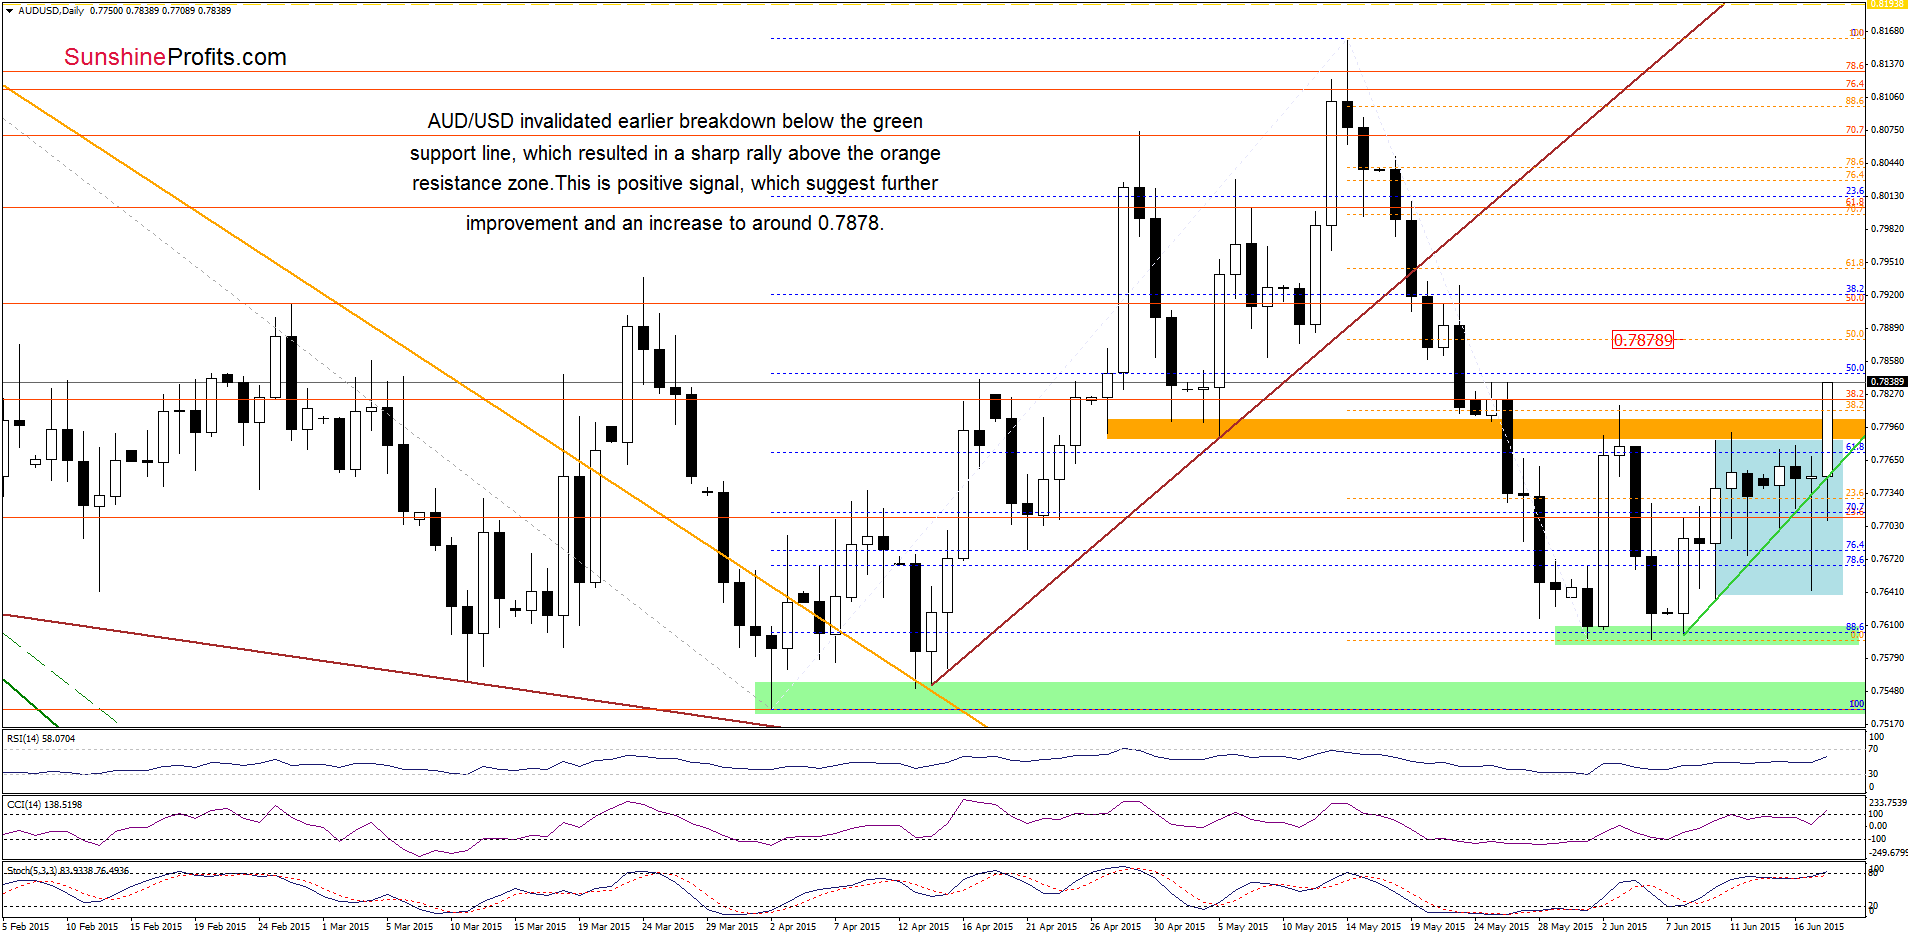
On the daily chart, we see that AUD/USD invalidated the breakdown below the green support line, which triggered a sharp rally and resulted in a breakout above the orange resistance zone earlier today. This is a bullish signal, which suggests further improvement and an increase to around 0.7878, where the 50% Fibonacci retracement (based on the May-Jun decline) is. Nevertheless, we should keep in mind that the current position of the indicators suggests that reversal in the coming week is quite likely (especially if the CCI and Stochastic Oscillator generate sell signals).
Very short-term outlook: bullish
Short-term outlook: mixed
MT outlook: mixed
LT outlook: mixed
Trading position (short-term; our opinion): No positions are justified from the risk/reward perspective at the moment. We will keep you informed should anything change, or should we see a confirmation/invalidation of the above.
Thank you.
Nadia Simmons
Forex & Oil Trading Strategist
Przemyslaw Radomski, CFA
Founder, Editor-in-chief
Gold & Silver Trading Alerts
Forex Trading Alerts
Oil Investment Updates
Oil Trading Alerts

